Tag: Market Trends

  • Analysts: CRCL Sell-Off Overdone Amidst CEO’s USD Threat Address

    Analysts: CRCL Sell-Off Overdone Amidst CEO’s USD Threat Address

    Shares of Circle (CRCL), the issuer of the USDC stablecoin, experienced an 18% decline on Tuesday following news of a competing stablecoin launch, Open USD (OUSD), backed by global partners including Coinbase, Visa, and Mastercard. However, analysts at Clear Street believe the market reaction was an overestimation by investors.

    Market Overreaction Cited

    “While OUSD boasts strong partners, similar to other leading stablecoins, the selloff appears overdone without concrete evidence of OUSD achieving significant market traction,” the analysts stated in a note released Wednesday.

    Narrative Threat Lingers, But USDC’s Resilience Noted

    Despite the impending launch of OUSD later this year, analysts acknowledge that the narrative threat may persist. Nevertheless, they point to Circle’s USDC stablecoin as having demonstrated staying power in the face of previous stablecoin introductions.

    “Although the narrative may linger, CRCL has maintained robust market share despite the continuous emergence of new stablecoins,” the analysts wrote. “Our initial assessment suggests OUSD is comparable to USDG (Global Dollar Network stablecoin), which has not captured substantial market share.”

    Circle CEO Highlights USDC’s Strengths

    Circle CEO Jeremy Allaire offered perspective on the OUSD launch in response to investor inquiries, emphasizing his company’s strengths and the “massive scale” of the USDC network, a feature OUSD will lack at its inception.

    According to Allaire, successful stablecoin networks require a broad spectrum of services and applications, substantial liquidity, and “deep integration with the policy and regulatory environment.”

    “All of these investments by Circle and our global ecosystem of thousands of partners have culminated in providing the world’s most trusted and accessible digital dollar infrastructure,” he posted on X, adding that his firm has “no intention of slowing down.”

    USDC’s Market Position

    Currently, USDC holds the position of the second-largest stablecoin and ranks as the fifth-largest cryptocurrency overall, boasting a market capitalization exceeding $73 billion. Only Tether’s USDT, with a market cap of $184 billion, surpasses it in stablecoin rankings.

    Share Performance and Outlook

    Circle shares saw a partial recovery on Wednesday, gaining 3% to trade around $64.55. However, CRCL shares, which saw a significant surge upon their public debut last year, have fallen more than 18% in the past six months and are over 75% below their 52-week high of $262.97.

    In their Wednesday note, Clear Street set a 12-month price target for Circle at $157, representing an approximate 140% increase from its trading price on Wednesday.


  • OpenUSD Gains Traction: Visa, BlackRock, Coinbase Lead 140+ Firm Support for New Stablecoin

    OpenUSD Gains Traction: Visa, BlackRock, Coinbase Lead 140+ Firm Support for New Stablecoin

    OpenUSD Initiative Sparks Major Crypto Market Buzz

    The cryptocurrency market is abuzz with the emergence of Open USD (OUSD), a new stablecoin initiative backed by a consortium of over 140 companies. Developed by Open Standard, the stablecoin is slated for launch later this year.

    Data from Santiment indicates that the extensive participation from prominent financial and crypto firms has ignited significant discussion across the market. The initiative has attracted major industry players, positioning it as one of the most talked-about developments, alongside ongoing conversations about ANSEM whale activity and Markets in Crypto-Assets (MiCA) licensing.

    Market observers are debating key aspects such as custody, transparency, liquidity, and the potential for a new major stablecoin to challenge the dominance of USDC and USDT. Regardless of the outcome, the surge in attention signals that the market is taking this launch seriously.

    This growing interest follows the official unveiling of OUSD by Open Standard, an independent entity tasked with overseeing the stablecoin. According to an official blog post, Open USD is designed to facilitate global money movement while addressing several challenges businesses encounter with existing stablecoins.

    While stablecoins have become crucial for enabling faster, more cost-effective, and programmable digital payments, Open Standard notes that many businesses still grapple with high minting and redemption fees, limited access to revenue generated by reserve assets, and reliance on third-party issuers for future enhancements.

    To tackle these issues, OUSD is built on three foundational principles. Firstly, businesses will be able to mint and redeem the stablecoin without incurring fees or facing volume restrictions. Secondly, participating partners will share in the earnings generated from the stablecoin’s reserves, after a nominal management fee is deducted to cover operational expenses. Thirdly, governance will be a collective effort managed through Open Standard, with its board comprising partner organizations rather than a single controlling issuer.

    Open Standard asserts that this structure is intended to ensure that decisions are made in the best interests of the broader ecosystem. The organization has also confirmed that over 140 businesses have already committed to supporting or utilizing Open USD. Notable signatories include Visa, Stripe, Mastercard, American Express, Coinbase, BlackRock, BNY, Standard Chartered, Intercontinental Exchange, Bybit, Solana, Base, OKX, and Ripple.

    Commenting on the development, Samara Cohen, BlackRock’s Global Head of Market Development, stated, “We believe stablecoins can play an important role in the evolution of digital markets when supported by trusted infrastructure and practical utility. Open USD is a constructive step toward giving businesses more choice in how they access tokenized value and participate in internet native digital rail.”

    The announcement of OUSD also appears to have impacted investor sentiment surrounding Circle, the issuer of USDC. On Tuesday, Circle’s (CRCL) shares saw a decline of 17.55%, closing at $62.63.

    Sam Ruskin, a former Enterprise Research Analyst at Messari, suggested via Twitter that the new stablecoin’s model could present a competitive challenge to USDC due to its three core design principles. He posited that OUSD’s innovative model might compel Circle to explore revenue-sharing agreements, seek new distribution partners, or concentrate on other facets of its stablecoin business.

  • Trump Holds $50 Million in Bitcoin

    Trump Holds $50 Million in Bitcoin

    Trump Holds Over $50 Million in Bitcoin, Federal Disclosure Reveals

    Newly released federal financial disclosure documents show that former President Donald Trump holds more than $50 million worth of Bitcoin in a cold wallet.

    The 927-page document, published by the U.S. Office of Government Ethics, indicates that the Bitcoin is held under CIC Digital LLC as a “Cryptocurrency Wallet Virtual Bitcoin Key (held in cold wallet).” The value is reported in the highest available category, “Over $50,000,000.” The exact amount could be higher, as the disclosure form does not require precise figures beyond this threshold.

    The filing specifies that the Bitcoin is held within the Donald J. Trump Revocable Trust, with Trump listed as the sole beneficiary. This trust also encompasses his stake in Trump Media & Technology Group, the parent company of Truth Social.

    The Bitcoin is notably stored in cold storage, meaning its private keys are kept offline. This method is commonly employed to mitigate online security risks, as opposed to storing assets on internet-connected systems or with third-party exchanges.

    Bitcoin is not the only digital asset held by CIC Digital LLC, according to the filing. The company also lists an Ethereum wallet valued between $5 million and $25 million. Additionally, it holds a staked Ethereum position through a Coinbase staking agreement, which generated $510,808 in validator rewards. A USDC stablecoin holding is also reported, valued between $5 million and $25 million, along with a smaller dollar-denominated wallet.

    Based on the reported valuation ranges, the combined disclosed value of Trump’s Bitcoin and Ethereum holdings alone exceeds $100 million. The disclosure also sheds light on Trump’s cryptocurrency-related earnings during the reporting period. World Liberty Financial (WLFI) reportedly generated over $500 million from the sale of governance tokens and other crypto products. CIC Digital LLC, meanwhile, earned more than $635 million from sales of Trump-branded meme coins launched shortly before his inauguration.

    Cumulatively, Trump’s disclosed crypto earnings surpassed $1 billion during his first year back in office.

    The disclosure has prompted significant scrutiny. In response, White House spokesperson Anna Kelly stated that neither Trump nor his family has engaged in, nor will they engage in, conflicts of interest. She added, “All actions by President Trump and his administration are taken in the best interest of the American people – and any so-called ‘reporters’ pushing otherwise are recycling the same, tired, false narrative that Democrats and the legacy media have been pushing for a decade.”

  • Bitfinex Analysts: Bitcoin May Drop to $40,000 Before Reaching Bottom

    Bitfinex Analysts: Bitcoin May Drop to $40,000 Before Reaching Bottom

    Bitcoin May Plunge to $40,000s Before Hitting Bottom, Bitfinex Analysts Say

    Bitcoin (BTC) has further to fall before reaching its trough in the current bear cycle, according to an analysis of on-chain indicators by researchers at the crypto exchange Bitfinex.

    The latest Bitfinex Alpha report suggests that the leading digital asset could see further declines into the $40,000 range by the end of the year as more investors exit the spot market.

    Historically, BTC has experienced declines of at least 70% from its all-time highs (ATHs) before finding a bottom and beginning to recover. During the 2022 bear market, BTC dropped 78% from its peak of $69,000, and in 2018, it plummeted 86% from cycle highs near $20,000.

    Based on these historical drawdown patterns and the typical timeframes between market peaks and troughs, analysts anticipate BTC’s current decline could extend into the $40,000s. The asset is currently down 53.9% from its ATH of $126,000. A drop into the $40,000s would represent a decline of at least 68%. Furthermore, if cycle estimates incorporate price movements relative to moving averages, analysts believe BTC could reach its bear-cycle bottom in the fourth quarter of 2026.

    Despite the asset’s floor giving way over the weekend, analysts maintain that BTC’s structural levels remain unchanged. At the time of reporting, with the coin trading near $60,000, it is positioned below the True Market Mean of $77,000, which represents the average cost basis for active investors. This level also acts as a dividing line between bullish and bearish market conditions, indicating that bitcoin’s price action will likely continue to be dictated by a structural bear market environment.

    Last week, after breaking below the $61,500 support level and hitting a new bear cycle low of $58,136, the key support level to monitor is now $53,400. The move towards $58,000 signals weakening spot demand, evidenced by selling from short-term holders, outflows from exchange-traded funds (ETFs), the collapse of the digital asset treasury channel, and negative gamma pressure.

    Notably, unlike previous downturns, bitcoin’s fall below $60,000 last week did not involve large-scale liquidations or significant fluctuations in open interest. This suggests the decline was a structural exodus from spot markets rather than a forced deleveraging event. With the market’s primary demand driver absent, bitcoin’s price is expected to remain weak and continue its downward trend in the coming weeks.

    “The market awaits a resurgence of spot demand to establish a floor and potentially turn higher,” the analysts explained.

  • Gemini AI Forecasts Soaring SanDisk Stock by 2026

    Gemini AI Forecasts Soaring SanDisk Stock by 2026

    Google Gemini AI Predicts Jaw-Dropping SanDisk Stock Price by End of 2026

    Google’s Gemini AI has issued a bullish forecast for SanDisk, projecting a significant surge to $2,650 by the end of 2026. This prediction, which represents a new all-time high for the stock, comes amid a remarkable rally that has already captured Wall Street’s attention this year.

    A Business Transformation Driving the Bull Case

    The optimistic outlook for SanDisk is rooted in a fundamental business transformation rather than mere speculative momentum. The company has emerged as a standout performer in the AI sector, a trajectory it has maintained since its spin-off from Western Digital.

    SanDisk has effectively capitalized on the unprecedented and structural demand for AI infrastructure. Its high-margin flash and enterprise memory solutions are now considered essential hardware, positioned alongside leading GPUs in the broader AI ecosystem.

    This strategic positioning is critical because memory has evolved from a commoditized component to a genuine bottleneck, limiting the pace at which AI infrastructure can scale.

    If persistent structural supply deficits, mirroring those seen throughout this year, continue and if SanDisk successfully implements a software-like multiyear subscription model across its customer base, the AI model anticipates further expansion of valuation multiples, driving the stock price toward the $2,650 target.

    The Bear Case: Overbought Conditions and Macroeconomic Risks

    The counterargument, or bear case, centers on a challenge that all momentum stocks eventually face. SanDisk’s stock is currently technically overbought, with a normalized price-to-earnings ratio of approximately 66 times. This leaves it vulnerable to a significant downturn should cyclical memory supply eventually meet demand, a pattern that has historically repeated in memory market cycles.

    Furthermore, a cooling macroeconomic environment that prompts capital expenditure cuts among the hyperscalers driving AI infrastructure spending could disproportionately impact SanDisk. This is particularly true given the concentrated nature of its growth story around this specific customer segment. Under such a scenario, the AI model forecasts a more conservative target of $1,750.

    Chart Analysis: Parabolic Rise and Consolidation

    SanDisk’s stock is currently trading at $2,050.39, following one of the most extreme rallies observed. The stock has surged from approximately $200 last October to an intraday high exceeding $2,300 this week.

    This vertical acceleration, especially the steep ascent from April onwards, is characteristic of a parabolic chart pattern.

    The price recently retreated from its all-time high near $2,354 to current levels. This pullback appears to be a normal profit-taking action after an extraordinary run, rather than an indication of a fundamental trend reversal.

    The chart shows support building around the $2,000 mark, a round-number level that the price has tested multiple times in recent sessions. Resistance is now established at the recent high of approximately $2,354, while the broader trendline from the entire 2026 move continues to point sharply upward despite the recent pullback.

    Given the magnitude and speed of this rally, momentum on the daily charts still appears firmly bullish overall, even with the current short period of consolidation.

    The pullback from recent highs reflects digestion following a strong earnings report and a wave of price target increases from major financial institutions, rather than any sign of an actual trend reversal.

    If SanDisk can maintain its footing above $2,000 and push back towards its recent highs, the climb toward the $2,650 target would represent a continuation of the supply-constrained narrative that has defined the stock’s performance this year, rather than an ascent into uncharted territory.

  • SpaceX Tokenized Trading Volume Soars 1,060%

    SpaceX Tokenized Trading Volume Soars 1,060%

    Tokenized Pre-IPO Trading Volume Surges as SpaceX Leads Market

    Trading activity in tokenized pre-initial public offering (IPO) perpetual contracts experienced a significant surge in May 2026, following several months of subdued engagement. According to a new report from CoinGecko, monthly trading volume escalated by 1,059%, climbing from $60.51 million in April to $701.44 million in May.

    SpaceX’s pre-IPO perpetual contracts emerged as the market leader, registering $305 million in monthly trading volume, which represented 43.5% of the total. This robust activity preceded the company’s highly anticipated Nasdaq listing scheduled for June 12.

    Artificial intelligence firms OpenAI and Anthropic secured the second and third positions, respectively. Collectively, contracts linked to SpaceX, OpenAI, and Anthropic accounted for over 95% of the pre-IPO perpetual trading volume recorded in May, highlighting a pronounced concentration of activity within a select few assets.

    Prior to its Nasdaq debut, SpaceX’s pre-IPO prices exhibited considerable divergence across major exchanges. However, these price points gradually converged as more information became available.

    In the week leading up to its market debut, CoinGecko observed that SpaceX perpetual contracts were trading at approximately $170 on exchanges including Binance and WEEX. In contrast, Coinbase, Gate, and OKX priced them lower, around $155. As details surrounding the initial public offering became public, prices across the major exchanges steadily narrowed to a range between $160 and $165 by June 10.

    During the final two days before the listing, prices on leading platforms continued to rise in unison, surpassing $180. On June 12, the day of the listing, new information regarding the expected IPO price was reflected in pre-IPO markets, triggering sharp price fluctuations. Despite this volatility, pre-IPO prices ultimately closed at an average of $157, representing a 4.67% premium over SpaceX’s opening price of $150.

    Beyond SpaceX, several prominent cryptocurrency exchanges have been actively expanding their offerings of tokenized real-world assets (RWAs). Since the beginning of 2025, MEXC has listed the largest number of RWA products, adding 199 spot assets and 159 TradFi perpetual contracts for a total of 358 listings.

    Gate followed with 224 RWA products, comprising 146 perpetuals and 78 spot assets. WEEX, ranking third, listed 192 assets, including 84 spot and 108 perpetual offerings.

    Exchanges such as HTX, Binance, Crypto.com, Coinbase, and OKX demonstrated a greater emphasis on TradFi perpetual listings over spot RWAs. CoinGecko data indicates that each of these exchanges recorded only one or two spot RWA listings over the past 17 months. On average, exchanges featured 75 perpetual listings compared to 37 spot RWA listings during the same period.

  • XRP Surges as Key Support Level Reclaimed

    XRP Surges as Key Support Level Reclaimed

    XRP Price Holds Above $1.00 Amid Cautious Market Sentiment

    XRP is currently trading between $1.04 and $1.06, maintaining a position above the critical $1.00 mark. While the digital asset has seen a nearly 2 percent increase over the past 24 hours, analysts suggest this movement is more indicative of a recovery within a volatile range rather than a sustained bullish trend.

    Market Sentiment Remains Deeply Negative

    The broader cryptocurrency market sentiment remains heavily skewed towards fear, with the Crypto Fear & Greed Index hovering near 15, signaling “extreme fear.” Approximately 74 percent of market indicators lean bearish, suggesting cautious participation, primarily driven by retail investors. This risk-off environment renders any upward price movements fragile.

    Technical Outlook for XRP

    Technically, XRP has managed to reclaim short-term support levels following a recent downturn. Intraday momentum readings have turned slightly positive, but significant resistance is observed between $1.08 and $1.10. The price action within this zone is expected to dictate the near-term direction.

    A decisive break above this resistance could pave the way for a base formation, while a rejection might signal another failed attempt at a bounce. The overall market structure for XRP remains undecided, with traders awaiting stronger confirmation of a trend.

    Key Price Levels and Potential Scenarios

    XRP is currently navigating a sensitive technical zone, with immediate support found between $1.02 and $1.04, which has absorbed recent pullbacks. Resistance is building from $1.10 to $1.11, an area where sellers previously absorbed momentum. Trading volume in this region has been substantial, nearing $1.58 billion, but lacks the conviction for a clear breakout.

    If XRP can sustain its hold above the $1.02–$1.04 support range, momentum could gradually rebuild. A breakout above $1.10 could trigger a more significant upside continuation, with potential targets ranging from $1.50 to $1.80. Some long-term outlooks for 2026 even project XRP reaching $2.80, contingent on a broader structural recovery in the market.

    Near-Term Consolidation Expected

    In the immediate future, XRP is likely to consolidate within the $1.02 to $1.11 range. The price action may remain range-bound as market sentiment slowly stabilizes. The current market structure is neutral, failing to confirm either a breakout or a breakdown.

    A daily close below $1.00 would undermine psychological support and could lead to a decline towards sub-$0.90 levels, especially as extreme fear continues to amplify volatility risks across markets. Longer-term price projections remain dependent on a return to macro-economic stability.

    Strategic Considerations for Investors

    At $1.04, XRP’s current price is viewed as a recovery rather than a repricing. Investors who purchased at higher levels, such as above $3.00, remain significantly underwater. Even a move to $2.80 would represent a substantial holding period given the prevailing market fear. This gap between current prices and meaningful upside potential highlights the appeal of early-stage infrastructure projects, which can be considered alongside established large-cap cryptocurrencies.

    Bitcoin Hyper Emerges as a Potential Alternative

    In this environment, Bitcoin Hyper ($HYPER) is positioning itself as a novel Bitcoin Layer 2 solution, integrating the Solana Virtual Machine (SVM). This combination aims to address Bitcoin’s inherent limitations, including slow transaction finality, high fees, and limited programmability.

    The project has reportedly raised nearly $33 million, with its presale currently priced at $0.01368. Staking is available for early participants. The SVM integration is a key differentiator, promising smart contract execution speeds that could surpass Solana’s own performance, while leveraging Bitcoin’s security layer through a decentralized canonical bridge.

    For traders observing XRP’s consolidation and seeking early-stage exposure with asymmetric potential, exploring Bitcoin Hyper’s presale terms before the current stage concludes may be a strategic consideration.

  • Tom Lee: Q2 Window Dressing Drove Ethereum Price Drop

    Tom Lee: Q2 Window Dressing Drove Ethereum Price Drop

    Ethereum’s price has dipped below $1,580, marking a roughly 6% decline over the past week. Despite this downward pressure, Bitmine Chairman Tom Lee suggests the slump is a result of quarter-end adjustments rather than a fundamental shift in Ethereum’s outlook.

    Quarter-End Positioning as a Driver

    In a recent interview, Lee characterized the recent price weakness as typical “window dressing” seen at the end of financial quarters. He explained that fund managers often divest underperforming assets before reporting periods to present a more favorable portfolio. Lee believes this practice, not a deterioration of Ethereum’s underlying fundamentals, has impacted its price in recent weeks.

    Bitmine’s decision to maintain its substantial Ethereum holdings, rather than reducing exposure, appears to support Lee’s assessment. Similarly, SharpLink Gaming reportedly acquired ETH during the downturn, indicating that some institutional investors viewed the selloff as a buying opportunity.

    Ethereum has fallen 22% in the last month, slightly underperforming Bitcoin during the same timeframe. The extent to which this weakness is attributable to quarter-end flows versus a more significant trend is expected to become clearer as third-quarter trading commences.

    Technical Outlook for Ethereum

    Ethereum is currently testing a critical resistance zone between $1,600 and $1,610, an area where recent rallies have faltered. A daily close above $1,610 could bolster a recovery, potentially pushing ETH towards $1,700. Accelerated buying pressure might then target $1,800.

    Initial support is observed near $1,560, a level that has previously attracted buyers during pullbacks. A breach of this level could see ETH retest $1,500, with $1,450 representing the next significant demand zone. A sustained drop below $1,500 would undermine the current bullish sentiment.

    The most probable near-term scenario involves continued consolidation as quarter-end positioning unwinds. ETH may trade within the $1,560 to $1,610 range before a decisive move. A breakout above resistance would favor buyers, while a loss of support could shift momentum back to sellers.

    Long-Term Ethereum Prospects

    Tom Lee maintains a long-term optimistic view on Ethereum, considering it undervalued. His projections range from $7,000 to $9,000, with higher valuations contingent on the adoption of tokenization and stablecoins. While these forecasts remain speculative, ongoing institutional accumulation lends support to the long-term thesis.

    Liquidity Fragmentation and L3 Solutions

    Ethereum’s volatile price action entering the third quarter highlights a persistent structural challenge: liquidity fragmentation across the Bitcoin, Ethereum, and Solana ecosystems. This fragmentation can lead to capital being stranded at the chain level, and cross-chain execution remains cumbersome. A Layer 3 project in its presale stage is aiming to address this very issue.

    Given the near-term technical uncertainty surrounding ETH, exploring investments in earlier-stage infrastructure projects with potential for asymmetric upside may be prudent.

    LiquidChain, a Layer 3 infrastructure project, is positioning itself as a unified cross-chain liquidity layer, aiming to consolidate liquidity from BTC, ETH, and SOL into a single execution environment. Its architecture comprises four key components: a Unified Liquidity Layer, Single-Step Execution, Verifiable Settlement, and a Deploy-Once Architecture that enables developers to build once and access all three ecosystems.

    The project’s presale is currently priced at $0.01475, with $880,000 raised to date. While this represents a significant early-stage figure, it remains below the $1 million threshold that typically attracts institutional attention at the seed level. If the cross-chain thesis gains traction as the ETH and SOL ecosystems deepen their institutional presence, an L3 aggregation layer could capture value at the infrastructure level, irrespective of individual chain market share performance.

  • Claude AI Opus Forecasts Major XRP Surge by 2026

    Claude AI Opus Forecasts Major XRP Surge by 2026

    Claude AI Opus, a sophisticated AI model, has identified a significant disconnect between XRP’s price action and institutional behavior that has largely escaped the attention of those tracking XRP price predictions. The model forecasts a bullish target of $3.00, with a more conservative recovery scenario projecting a price near $2.20.

    Bullish Outlook

    The optimistic scenario hinges on a fundamental factor that XRP’s price has yet to reflect. Spot XRP Exchange-Traded Funds (ETFs) have attracted approximately $1.4 to $1.6 billion in inflows since their launch in November 2025. Notably, May saw the strongest inflow month for these ETFs throughout the year, even as Bitcoin ETFs experienced record outflows totaling $3.5 billion during the same period.

    This divergence is significant, indicating that institutions are actively accumulating XRP through regulated investment vehicles, despite the token’s current price decline alongside the broader market.

    On-chain data further supports this accumulation trend. The amount of XRP held in custody has nearly doubled, increasing from 478 million tokens in January to over 900 million by June. This represents tangible evidence of accumulation rather than mere speculative interest.

    Adding to the positive fundamental backdrop are the SEC settlement in August 2025, which concluded five years of litigation, the bipartisan Senate passage of the CLARITY Act, and the continued expansion of Ripple’s RLUSD stablecoin and tokenization infrastructure. These developments paint a picture of a fundamentally stronger asset than its current price chart suggests.

    Should macroeconomic risk appetite shift, the AI model anticipates a rapid unlocking of these accumulated institutional positions. A recovery to the previous cycle high of approximately $2.20 is considered realistic. A more ambitious target of $3.00 is possible if the CLARITY Act is enacted and broader cryptocurrency market sentiment turns significantly bullish by year-end.

    Bearish Case

    The bearish outlook is stark, acknowledging the current reality. None of the positive developments have yet translated into price appreciation. XRP is down roughly 46% from its January high, trading below all major moving averages. This performance aligns with that of high-beta assets in a market characterized by a Fear and Greed Index of just 18, indicating a general decline alongside the broader market, irrespective of underlying fundamentals.

    A breach below the psychological support level of $1.00, followed by a fall through the structural support at $0.96, could pave the way for a decline to $0.85. Such a move would effectively erase most of the gains made during the ETF era, particularly if risk-off conditions persist into the third quarter.

    Technical Analysis

    The daily chart shows XRP trading at $1.04718, following a prolonged and challenging decline from highs above $3.65 reached in July of the previous year. This downward trend has been largely uninterrupted, with a particularly sharp drop occurring in October when the price collapsed from the $2.70 zone to below $1.60 within weeks.

    Since February, XRP has generally trended lower in a series of incremental steps, currently testing the critical psychological floor of $1.00, which was identified as a key level in this prediction.

    A test at such a significant round number after an extended downtrend typically signifies a crucial decision point, rather than just another temporary pause.

    Immediate resistance is observed near $1.40, a level that XRP has failed to reclaim during recent upward attempts. A more substantial ceiling is located around $2.20, aligning with the prior cycle high and the realistic recovery target.

    Support is currently holding in the $1.00 to $1.03 zone, with the $0.96 structural level serving as the next significant test should this floor falter.

    The broader chart pattern reveals a consistent series of lower highs and lower lows extending back nearly a full year, supporting the bearish narrative of a high-beta asset declining with a weak overall market.

    Momentum indicators on the daily candles appear weak and continue to trend downwards, with little evidence yet of the basing action typically preceding a genuine reversal.

    Given XRP’s current position directly atop the critical floor identified in this analysis, the next move through $1.00 is likely to determine whether the divergence between institutional buying and price finally begins to narrow.

  • Ripple (XRP) Price Watchlist This Week

    Ripple (XRP) Price Watchlist This Week

    XRP Faces Steep Decline: Key Support Levels Tested Amidst Bearish Trend

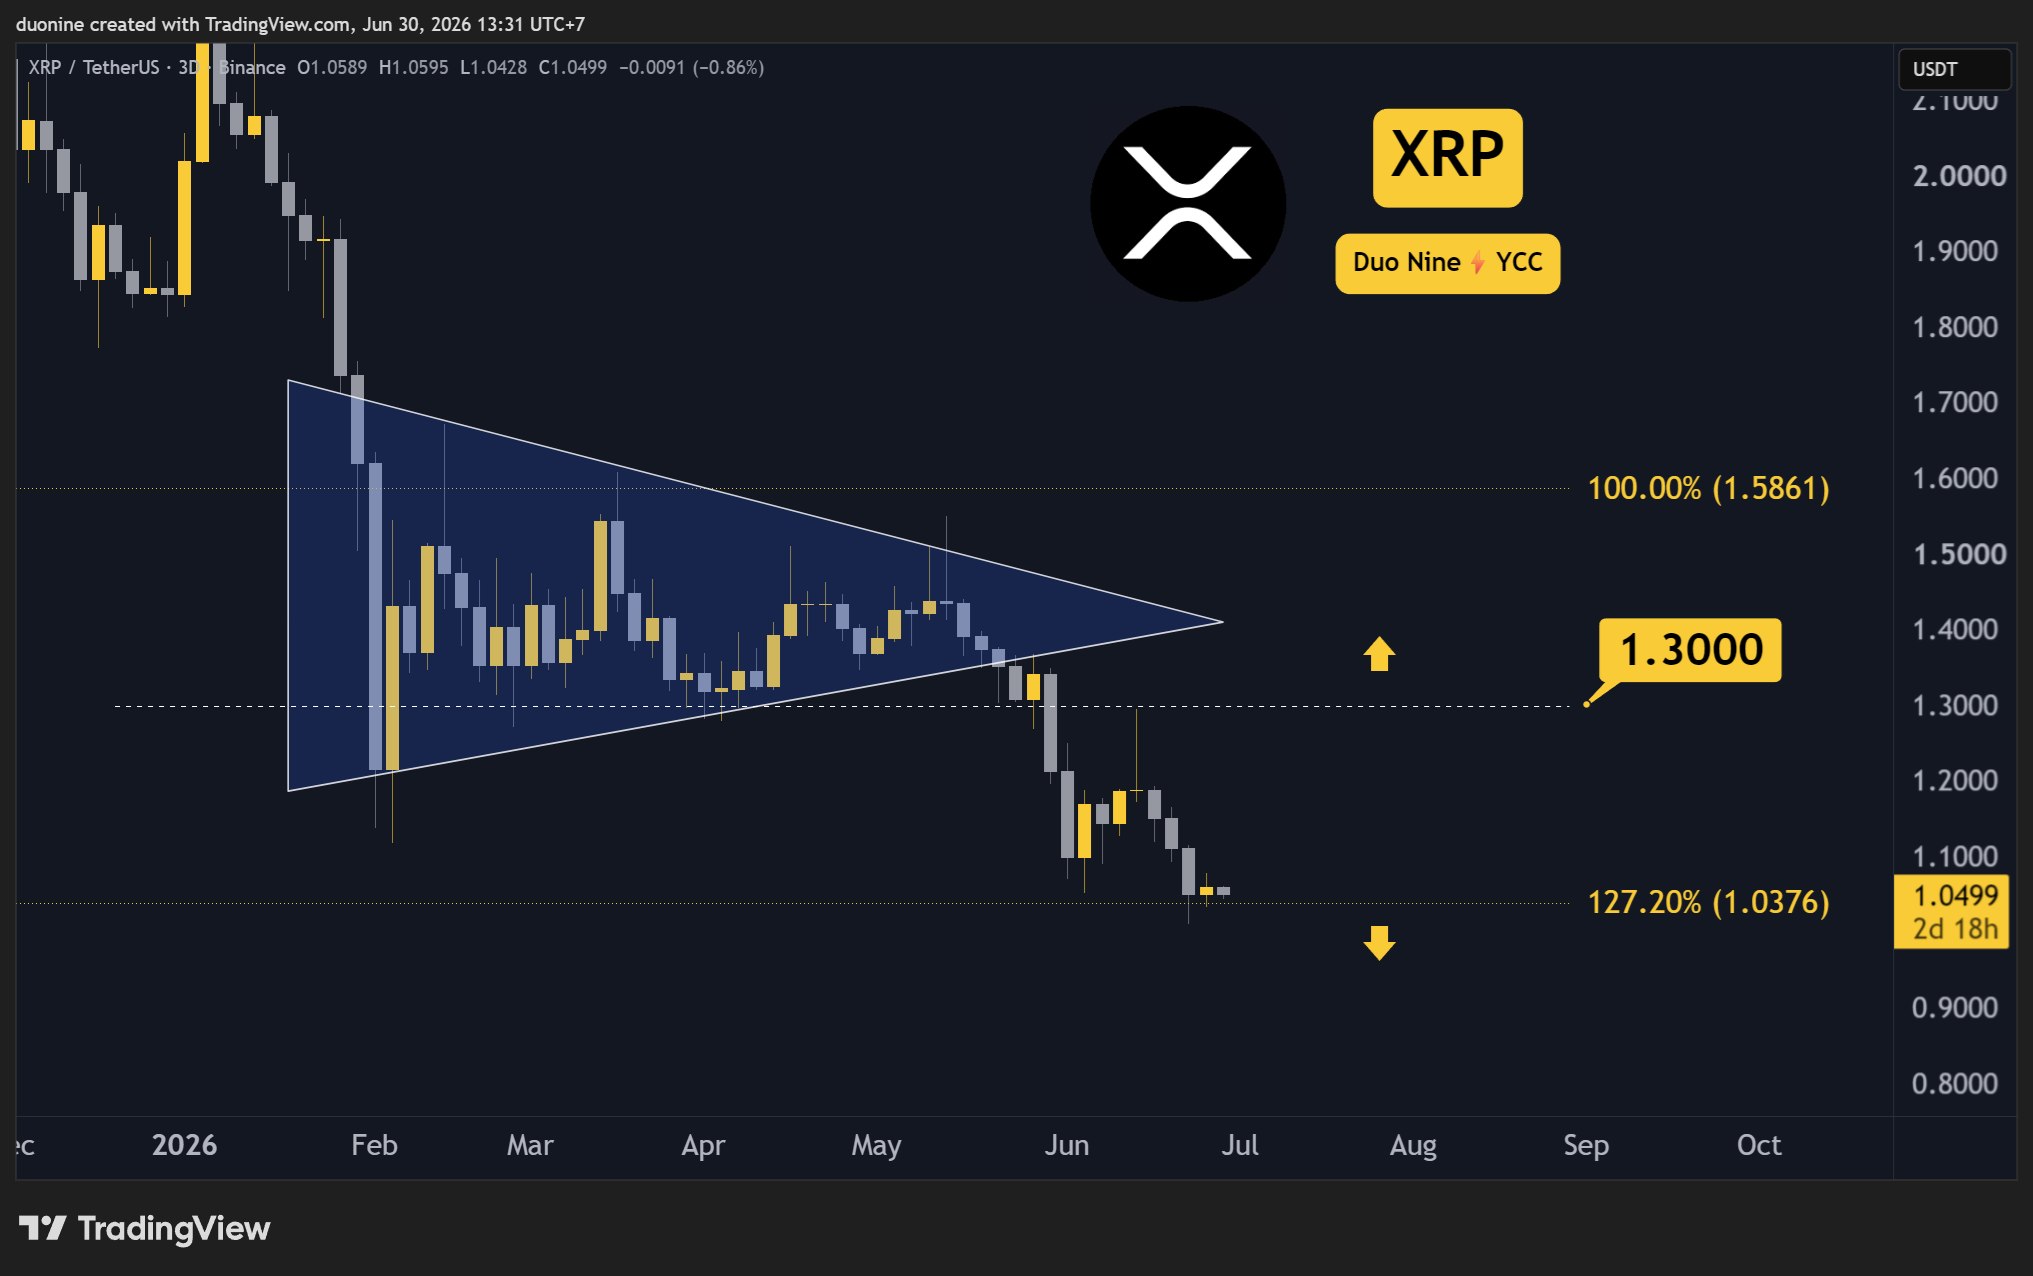
    XRP has experienced a significant downturn, shedding 6% over the past week and testing the crucial $1 support level for the third time in two weeks. This repeated failure by buyers to push the price away from this key threshold signals a potentially bearish outlook.

    Support and Resistance

    Key support levels for XRP are identified at $1, with the next significant floor at approximately 80 cents. Resistance levels to watch are $1.3, $1.6, and $2.

    Bearish Trend Intensifies

    The cryptocurrency is currently entrenched in a bearish trend, characterized by consistently lower highs and lower lows. Analysts suggest that if selling pressure continues to mount, the $1 support could break, potentially flipping into resistance. In such a scenario, buyers might be forced to retreat to the 80-cent mark for the next major support. The current price action indicates a strong possibility of further declines in the coming weeks, with $1 likely to become a resistance zone.

    Momentum Indicators Signal Caution

    Momentum indicators further reinforce the bearish sentiment. The 3-day Relative Strength Index (RSI) is hovering near the 30-point mark, a common indicator of a bearish trend. As long as the RSI remains below 50, bears are expected to maintain control of the market.

    MACD Suggests Deeper Downturn

    Adding to the concerns, the weekly Moving Average Convergence Divergence (MACD) is showing signs of a bearish cross. If confirmed, this would be the first such occurrence in 2026 and could signal a prolonged period of recovery challenges for XRP.

    Outlook for the Remainder of the Year

    The outlook for XRP in the latter half of the year appears negative, with the potential for further price drops. Investors are advised to await confirmation of a market bottom before considering new entries into XRP.