Tag: Market Trends

  • XRP Echoes March Surge: Will $1 Support Hold?

    XRP Echoes March Surge: Will $1 Support Hold?

    XRP ETFs Face Outflows, Raising Concerns Over $1 Barrier

    Ripple’s cross-border token, XRP, has recently experienced a shift in market sentiment, moving from robust institutional demand to facing potential downward pressure. This comes as spot XRP Exchange Traded Funds (ETFs), which had previously seen significant inflows, are now grappling with substantial outflows, a stark contrast to their earlier performance.

    ETF Performance Reverses Trend

    The launch of the first spot XRP ETF in the U.S. by Canary Capital in November marked a significant development, offering investors direct exposure to the asset. This was followed by similar products from Bitwise, Franklin Templeton, 21Shares, and Grayscale. Collectively, these ETFs had amassed nearly $1.5 billion in net inflows since their inception, demonstrating sustained investor interest even during a broader market downturn that affected XRP’s price.

    However, the trend appears to have reversed in recent days. For the first time since March, outflows have surpassed inflows over two consecutive days. This development suggests a potential reduction in exposure to XRP by institutional investors such as pension funds and hedge funds. Consequently, ETF issuers may be compelled to sell their holdings, adding further downward pressure on the token.

    Price Volatility and Analyst Outlook

    The asset’s price recently dipped close to the $1 mark, sparking fears among some that bears could push it below this critical psychological level for the first time since late 2024. While bulls managed to reclaim some ground, XRP is currently trading around $1.11, according to CoinGecko.

    Analyst Diana, on the X platform, expressed caution, predicting a potential fall to $0.87 if XRP breaks below $1.08 again. Conversely, she noted that maintaining this level could pave the way for an increase to $1.30.

    Factors Suggesting Potential Upswing

    Despite the recent ETF outflows, several indicators suggest a potential upcoming upswing for XRP. The amount of XRP held on the Binance exchange has recently fallen to a four-month low, indicating reduced selling pressure.

    Furthermore, popular analyst Ali Martinez highlighted that the Tom DeMark (TD) Sequential Indicator has flashed a buy signal for XRP on a monthly scale, a signal also observed for other major cryptocurrencies like Bitcoin, Ethereum, and Solana. Martinez explained that such trend-exhaustion setups on higher timeframes carry significant weight, and historically, concurrent monthly buy signals across multiple assets have indicated seller fatigue and a high probability of a long-term market bottom.

  • Binance Futures to Implement Last Price Protection on GUAUSDT Perpetual Contract

    Binance Futures to Implement Last Price Protection on GUAUSDT Perpetual Contract

    Binance Futures to Implement Last Price Protected Mechanism on GUAUSDT Perpetual Contract Amidst Spot Price Divergence

    Binance Futures announced today that it will implement a Last Price Protected (LPP) mechanism on its USDⓈ-Margined GUAUSDT Perpetual Contract, effective July 2, 2026, at 15:45 UTC. This measure is being taken in response to observed divergences in the spot price of GUA (SUPERFORTUNE) across multiple exchanges. The exchange emphasized that user funds on Binance remain secure.

    Gradual Transition and Price Stability

    The LPP mechanism will be introduced gradually through a mark price smoothing process. This approach aims to minimize sudden price fluctuations and ensure greater price stability during the transition period.

    End of LPP Period

    The LPP period for the USDⓈ-Margined GUAUSDT Perpetual Contract will conclude once the spot price of GUA converges across various exchanges, allowing for the derivation of a stable index price from spot markets, as determined by Binance. A separate announcement will be issued to notify users when the LPP period ends and the contract is ready to revert to the standard Mark Price calculation. The duration of this transition period will be contingent on price volatility and the availability of a stable index price.

    Last Price Protected Mechanism Explained

    Under the LPP mechanism, the mark price is calculated based on the average of recent transaction prices for the perpetual contract within a defined timeframe. Specifically, it is the average of trade prices over the last 10 seconds, recalculated every second. If fewer than 21 transaction prices are recorded within the 10-second interval, the system will extend its lookback to the past 100 seconds. If more than 21 transaction prices are available within that longer period, the average will be based on those; otherwise, it will use the last 100 transaction prices of the contract.

    Furthermore, a price cap of ±1% will be applied to the mark price, limiting its change to within a 1% range per second.

    Return to Standard Mark Price Calculation

    Upon the conclusion of the LPP period, the Mark Price will revert to the standard calculation: Mark Price = Median (Price 1, Price 2, Contract Price). Users can refer to the Mark Price and Price Index sections within USDⓈ-Margined Futures for the formulas governing Price 1 and Price 2.

    Funding Rate Adjustments

    The funding interval for the GUAUSDT Perpetual Contract will be adjusted from every hour to every four hours, commencing on July 2, 2026, at 18:45 UTC. Concurrently, the capped funding rate will be revised from ±2.00% to ±0.005%.

    The detailed schedule for these funding rate adjustments is as follows:

    • July 2, 2026, 16:00 (UTC): Maximum Funding Rate +2.000% / -2.000%
    • July 2, 2026, 20:00 (UTC): Maximum Funding Rate +0.005% / -0.005%
    • July 3, 2026, 00:00 (UTC): Maximum Funding Rate +0.005% / -0.005%
    • July 3, 2026, 04:00 (UTC): Maximum Funding Rate +0.005% / -0.005%

    The contract is exempt from rule 8.1 concerning the Adjustment of Funding Interval. The funding interval will not revert from four-hour to one-hour intervals if the previous funding rate settlement reaches the capped funding rate.

    Once the LPP period concludes, the funding rate will adhere to the standard rules for perpetual futures contracts, with maximum and minimum rates potentially reaching ±2.00%. The funding interval will then be adjusted back to every hour when the previous funding rate settlement reaches ±2.00%.

    Users can find further details on trading rules, funding rate history, mark price, and price index by referring to the provided links:
    Trading Rules to Trading Parameter
    Funding Rate History
    Mark Price and Price Index
    Binance Futures Contract Specification

    This information is issued as a Notice under Binance Exchange Rule 17.

    During the LPP period, Binance Futures will be the sole component of the price index. Binance also noted that a stricter maximum price will be enforced during the LPP period, and this maximum price may be adjusted by Binance based on market risk conditions. API users can access this information via GET /fapi/v1/exchangeInfo, while UI users can refer to the designated webpage.

    Binance reserves the right to adjust the specifications of the aforementioned Futures contract, including funding fees, tick size, maximum leverage, and initial and maintenance margin requirements, based on market risk conditions. Users are advised to consult the Trading Rules for the most up-to-date adjustments.

  • XRP Bullish Divergence Signals Defense of $1 Support

    XRP Bullish Divergence Signals Defense of $1 Support

    XRP Consolidates as Technical Signals Hint at Shifting Momentum

    XRP is currently trading within a tight range against both USDT and Bitcoin, with the overall trend still leaning towards sellers. However, recent technical indicators suggest that the downward momentum may be waning as the market defends key support levels and early signs of bullish divergence emerge.

    XRP/USDT Analysis

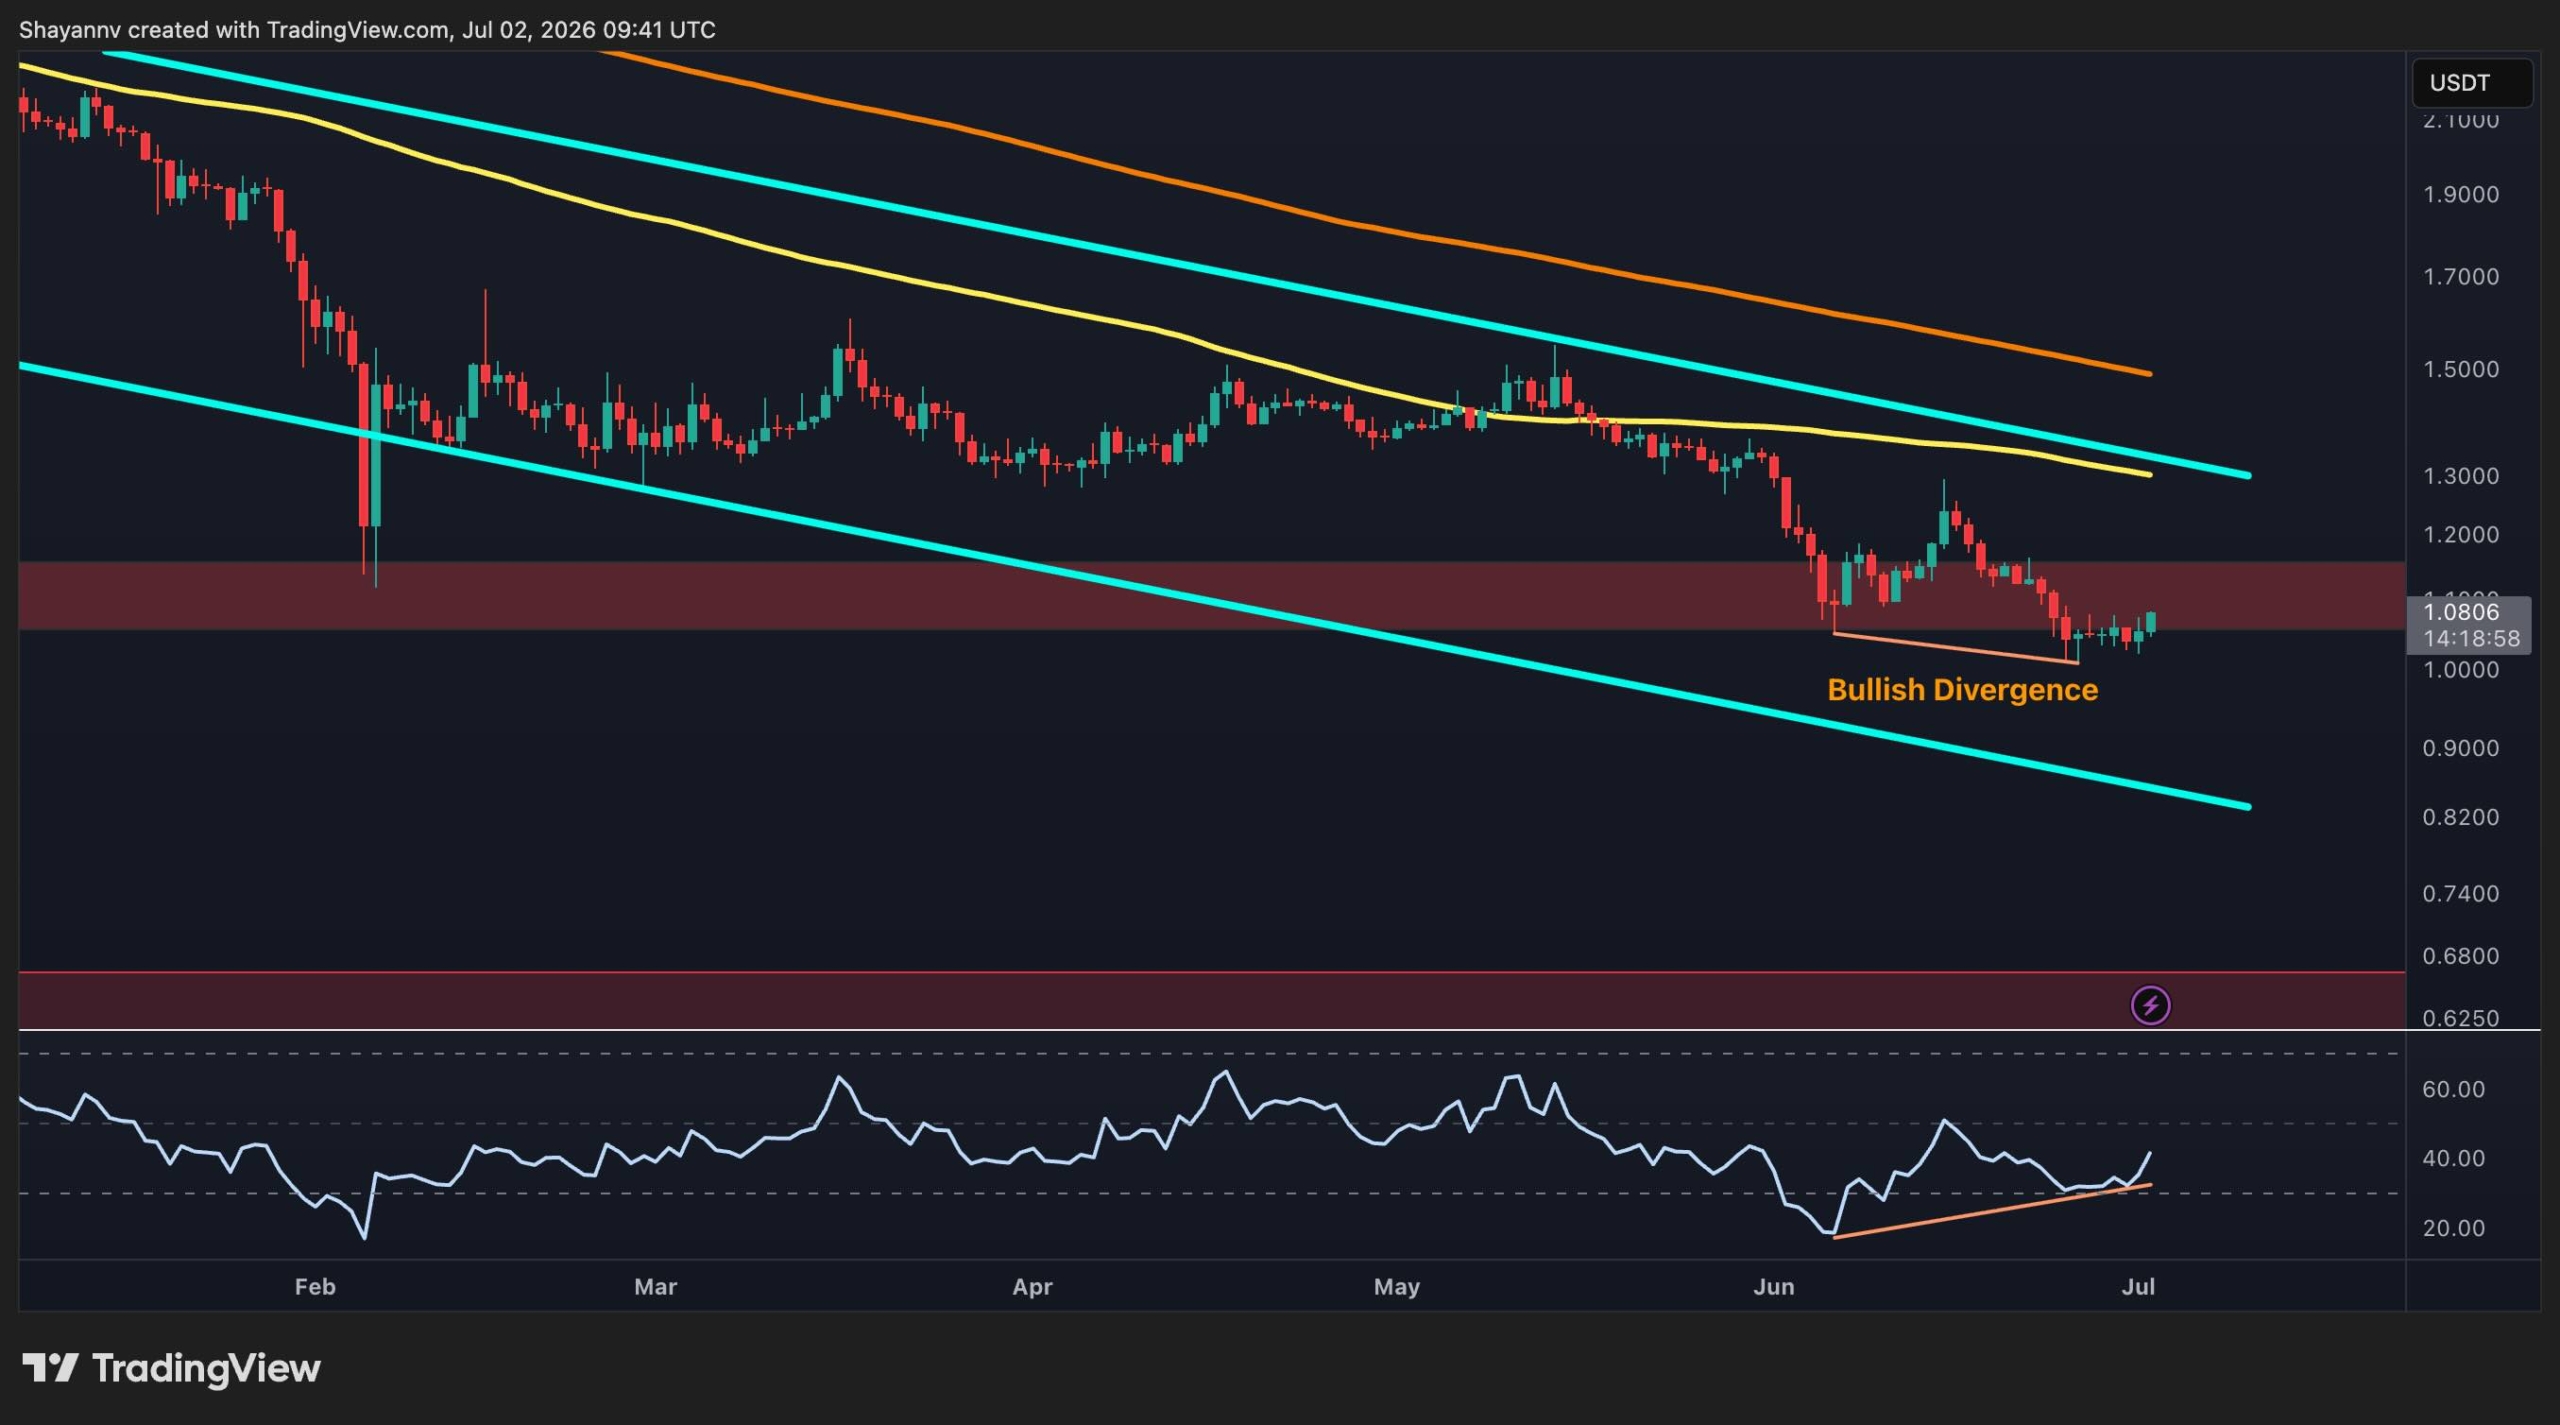
    Against USDT, XRP is confined within a descending channel, trading below its 100-day and 200-day moving averages. This positioning maintains a bearish outlook on higher time frames, despite recent price stabilization. The asset is holding firm around the $1.08 support area, which aligns with a significant horizontal demand zone. Following a sharp sell-off in June, sellers have been unable to push XRP lower, allowing it to establish a short-term base above this support.

    The Relative Strength Index (RSI) has formed a clear bullish divergence, showing higher lows while the price has registered lower lows. This pattern typically signals a weakening bearish trend and increases the likelihood of a relief rally if buyers can regain higher price levels. Immediate resistance is observed around the $1.15 supply zone, with stronger resistance located near the 100-day moving average, approximately at $1.25. A sustained move above these levels would improve the broader outlook. Conversely, a break below the $1 support could expose the lower boundary of the channel, potentially leading to a decline towards $0.80.

    XRP/BTC Analysis

    Against Bitcoin, XRP is also trading within a long-term descending channel, indicating persistent relative weakness. The pair remains below key moving averages, suggesting that the broader trend has not yet shifted in XRP’s favor.

    Recently, XRP experienced a brief dip below the critical 1,700 satoshi level before quickly recovering, suggesting a potential fake breakdown. This rejection below support implies that sellers failed to maintain control and may have triggered a liquidity sweep before the price returned to its previous range. Despite this recovery, the pair faces immediate resistance around 1,850 satoshis. A more significant supply zone is situated near 2,000 satoshis, where horizontal resistance converges with the declining 200-day moving average. A decisive move above these resistance levels would strengthen the case for a broader recovery towards the upper boundary of the channel.

    As long as XRP maintains its position above 1,700 satoshis, the fake breakout scenario remains plausible and could support further upside movement. However, a confirmed daily close below this level would invalidate the bullish setup and likely pave the way for another downward move towards the critical 1,500 satoshi support area.

  • Binance Convert Adds Smart DCA for Flexible Investing

    Binance Convert Adds Smart DCA for Flexible Investing

    Binance Introduces Smart DCA for Dynamic Recurring Investments

    Binance has launched Smart DCA, an optional advanced feature for its Convert Recurring service, allowing users to automatically adjust their investment amounts based on market sentiment. This new tool leverages the Fear & Greed Index, a market sentiment indicator developed by CoinMarketCap, to offer a more flexible automated purchasing strategy.

    Market Sentiment-Based Automation

    Smart DCA enables users to customize their recurring investment plans. When market sentiment, as indicated by the Fear & Greed Index, enters predefined “oversold” (0-40) or “overbought” (60-100) regions, the system can automatically increase or decrease the recurring purchase amount according to user-set parameters. This functionality aims to enhance the convenience of Binance Convert Recurring by introducing dynamic adjustments.

    The Fear & Greed Index is assessed at the time of each recurring transaction to determine if an adjustment is necessary.

    Optional Advanced Setting

    Smart DCA is an optional feature. Users can continue to utilize the standard Convert Recurring plans or opt to enable Smart DCA for eligible plans.

    Clear Execution Records

    The platform will provide clear records of executed transactions. The recurring history will display the actual investment amount utilized for each execution under Smart DCA. The plan details page will continue to show the original recurring amount as the baseline for reference.

    For instance, a user might set an original recurring amount of 100 USDC. If the “Market Dips” setting is configured at 150%, the plan will invest 150 USDC when the Fear & Greed Index falls between 0 and 40. Conversely, if the “Market Rallies” setting is configured at 50%, the plan will invest 50 USDC when the Fear & Greed Index is between 60 and 100. If the current Fear & Greed Index region has not been configured by the user, the plan will proceed with the original recurring amount of 100 USDC.

    In cases where the Fear & Greed Index is unavailable at the time of execution, the system will default to using the original recurring amount for that specific transaction.

    How to Enable Smart DCA

    Users can access the Smart DCA feature through both the Binance website and the Binance App. The steps to set up a plan are as follows:

    1. Navigate to the “Trade” section, then select either “Buy/Sell” or “Convert.”
    2. Choose the “Recurring” order type.
    3. Select an eligible cryptocurrency token and configure your desired recurring purchase amount and schedule.
    4. Open “Advanced Options” and enable “Smart DCA.”
    5. Set your preferred adjustment percentages for the “Market Dips” and/or “Market Rallies” market regions.
    6. Select “Create a Plan” and then “Confirm” after reviewing your setup.

    Binance emphasizes that Smart DCA operates solely based on user-selected parameters. The exchange does not recommend any specific investment strategy, threshold, multiplier, or configuration, nor does it assess the suitability of any configuration for individual users. Users are solely responsible for determining whether and how to utilize this feature.

  • XRP Surges Past Resistance Despite Billion-Token Unlock

    XRP Surges Past Resistance Despite Billion-Token Unlock

    Ripple’s latest release of 1 billion XRP from its escrow account this week has done little to dampen the cryptocurrency’s price, which is currently trading around $1.06. The digital asset has seen a modest 2% increase over the past 24 hours and, more significantly, continues to hold a crucial support level. This resilience has left traders contemplating whether buyers are quietly accumulating the asset or simply unfazed by the regular unlock.

    The monthly escrow release is a predictable event, as Ripple has adhered to the same schedule for years, making it an expected occurrence for most market participants. Nevertheless, the unlocking of 1 billion XRP always garnishes attention. This time, however, the price remained firm rather than declining, suggesting that sellers were unable to capitalize on the event.

    On-chain data confirmed the release of 1 billion XRP, valued at approximately $1.05 billion at current prices, in two distinct 500 million XRP tranches. The key question now is how much of this will be relocked versus how much will enter the market during this cycle.

    Technically, XRP maintains a constructive outlook as long as its support levels hold. Recent resistance points have now transitioned into support, preserving the short-term trend. However, derivatives data indicates a significant concentration of long positions. While this can be advantageous during periods of strong momentum, it could prove problematic if buyers lose control of the market.

    The broader market environment remains favorable for risk assets. U.S. stocks concluded a strong quarter, with technology shares continuing to lead the advance, which has contributed to an upbeat sentiment in the cryptocurrency market. Coupled with consistent institutional interest in Ripple’s ecosystem, XRP continues to be a focal point for traders.

    XRP is currently trading in the $1.05 range, with 24-hour trading volume around $1.5 billion. Liquidity remains robust, even with slight price variations across different exchanges. Buyers have demonstrated a consistent willingness to step in during pullbacks rather than chasing rallies, thereby maintaining short-term momentum.

    The $1.05-$1.06 area is now the primary support to monitor, while the $1.10-$1.13 zone represents key resistance. XRP is currently testing this ceiling again, suggesting that the upcoming trading sessions could be pivotal in determining whether buyers can break through or if the price will retreat to consolidate.

    Should XRP maintain its position above $1.05 and surpass $1.13 with substantial volume, the next target could be the $1.20-$1.22 region. Conversely, a decline to $1.03 would not necessarily signal a significant downturn, as this area has previously attracted buying interest.

    The bullish narrative would weaken if XRP closes below $1.01, shifting focus to the $0.99 support zone and prompting traders to reassess the current market setup. Even so, XRP is still trading approximately 72% below its all-time high, indicating considerable room for growth should momentum return.

    While XRP at the dollar level is attractive, it is also a cryptocurrency with a market capitalization exceeding $60 billion that is now encountering resistance after a substantial rally. The potential for asymmetric upside that initially drew traders to XRP at lower price points is now diminished. This is a mathematical observation rather than a bearish prediction. Traders seeking opportunities in early-stage infrastructure projects are evaluating a different risk-reward profile.

    Bitcoin Hyper ($HYPER) is presented as a structurally interesting presale in the current market cycle. It aims to be the first Bitcoin Layer 2 solution integrating the Solana Virtual Machine (SVM), enabling fast, low-cost smart contract execution directly within the Bitcoin ecosystem without compromising BTC’s inherent security. The project’s proposition focuses on addressing Bitcoin’s core limitations: slow transaction throughput, high fees, and a lack of native programmability. The presale has reportedly raised $32.9 million, with the current price at $0.01368, and offers staking opportunities for early participants. For those who invested in XRP at earlier stages and are now seeking their next asymmetric investment, Bitcoin Hyper is highlighted as a project worth researching before its next price adjustment.

  • Crypto Update: USDC Faces Challenges as Blackrock, Ripple Back OUSD; Bitcoin, Ethereum Rebound

    Crypto Update: USDC Faces Challenges as Blackrock, Ripple Back OUSD; Bitcoin, Ethereum Rebound

    Crypto Market Shows Resilience Amidst Institutional Sell-Offs

    The cryptocurrency market is exhibiting signs of recovery after a challenging month, with Bitcoin and Ethereum prices climbing despite some unsupportive metrics. While institutional investors continue to divest, large holders, often referred to as “whales,” and corporations appear to be capitalizing on the lower prices.

    Bitcoin has reclaimed the $60,000 mark, recovering from a recent 21-month low of $58,000. Ethereum also saw a rebound, reaching $1,600.

    Meanwhile, Blackrock is reportedly at the forefront of a new wave of exchange-traded fund (ETF) outflows, while a new stablecoin, OUSD, is emerging as a competitor to Circle’s USDC. Former President Donald Trump’s significant cryptocurrency holdings remain in the news, coinciding with ongoing regulatory shifts.

    Fed Official’s Remarks Spark Market Optimism

    A key catalyst for the recent market uptick appears to be comments from Fed Chair Kevin Warsh. His assessment that inflation risks have eased reportedly boosted cryptocurrencies and other risk assets, providing a much-needed lift to major digital currencies following a significant downturn in June. Bitcoin had briefly dipped below $59,000 amid heavy outflows before recovering, while Ethereum maintained support at $1,500, moving into positive territory alongside Solana (SOL) and Dogecoin (DOGE). Despite the “Extreme Fear” reading on the Fear & Greed Index, the market sentiment appears to be improving.

    ETF Outflows Continue Despite Price Recovery

    The recovery in Bitcoin’s price is notable given the persistent outflows from spot Bitcoin ETFs, which have been in the hundreds of millions of dollars. On a recent day, Bitcoin ETFs experienced a net outflow of $296 million. Blackrock’s IBIT led these redemptions with $219.4 million, followed by Fidelity’s FBTC ($51 million) and Grayscale’s GBTC ($62.8 million).

    June marked the worst month on record for these products, with $4.5 billion exiting. This indicates that institutions are actively reducing their exposure, even as Bitcoin’s price rises. However, on-chain data reveals that whales have accumulated approximately 270,000 BTC in the $59,000 price range, marking the largest single accumulation spike ever recorded, surpassing levels seen during the COVID-19 pandemic and the FTX collapse. Long-term holders are also demonstrating strong accumulation behavior.

    Corporate buyers are also increasing their holdings. Metaplanet, for instance, has added another 2,823 BTC, valued at $170 million, bringing its total treasury to 43,000 BTC, worth over $2.5 billion.

    Ethereum’s Development and Stablecoin Competition

    Ethereum’s price has mirrored Bitcoin’s upward trend, reclaiming the $1,600 level after touching multi-month lows of $1,505 at the start of July. Ethereum has now experienced its first three consecutive quarters of losses but is holding firm at the $1,500 support zone. While active addresses have seen a sharp decline, suggesting a potential retail exit, whale wallets holding between 1,000 and 10,000 ETH are actively accumulating. This pattern is often seen as an indicator of a market bottom.

    A significant catalyst for Ethereum remains on the horizon with the ongoing development of “Glamsterdam,” which includes active testing on Devnet-5. A public testnet is anticipated in July or August, with the mainnet launch targeted for the third quarter of 2026. Key upgrades planned for Glamsterdam include EIP-7732 for Enshrined Proposer-Builder Separation, aimed at improving MEV fairness, and EIP-7928 for Block-Level Access Lists, designed to enhance parallel processing capabilities. The project’s overarching goals are to increase Layer 1 scalability, reduce gas fees, and lay the groundwork for higher transaction throughput.

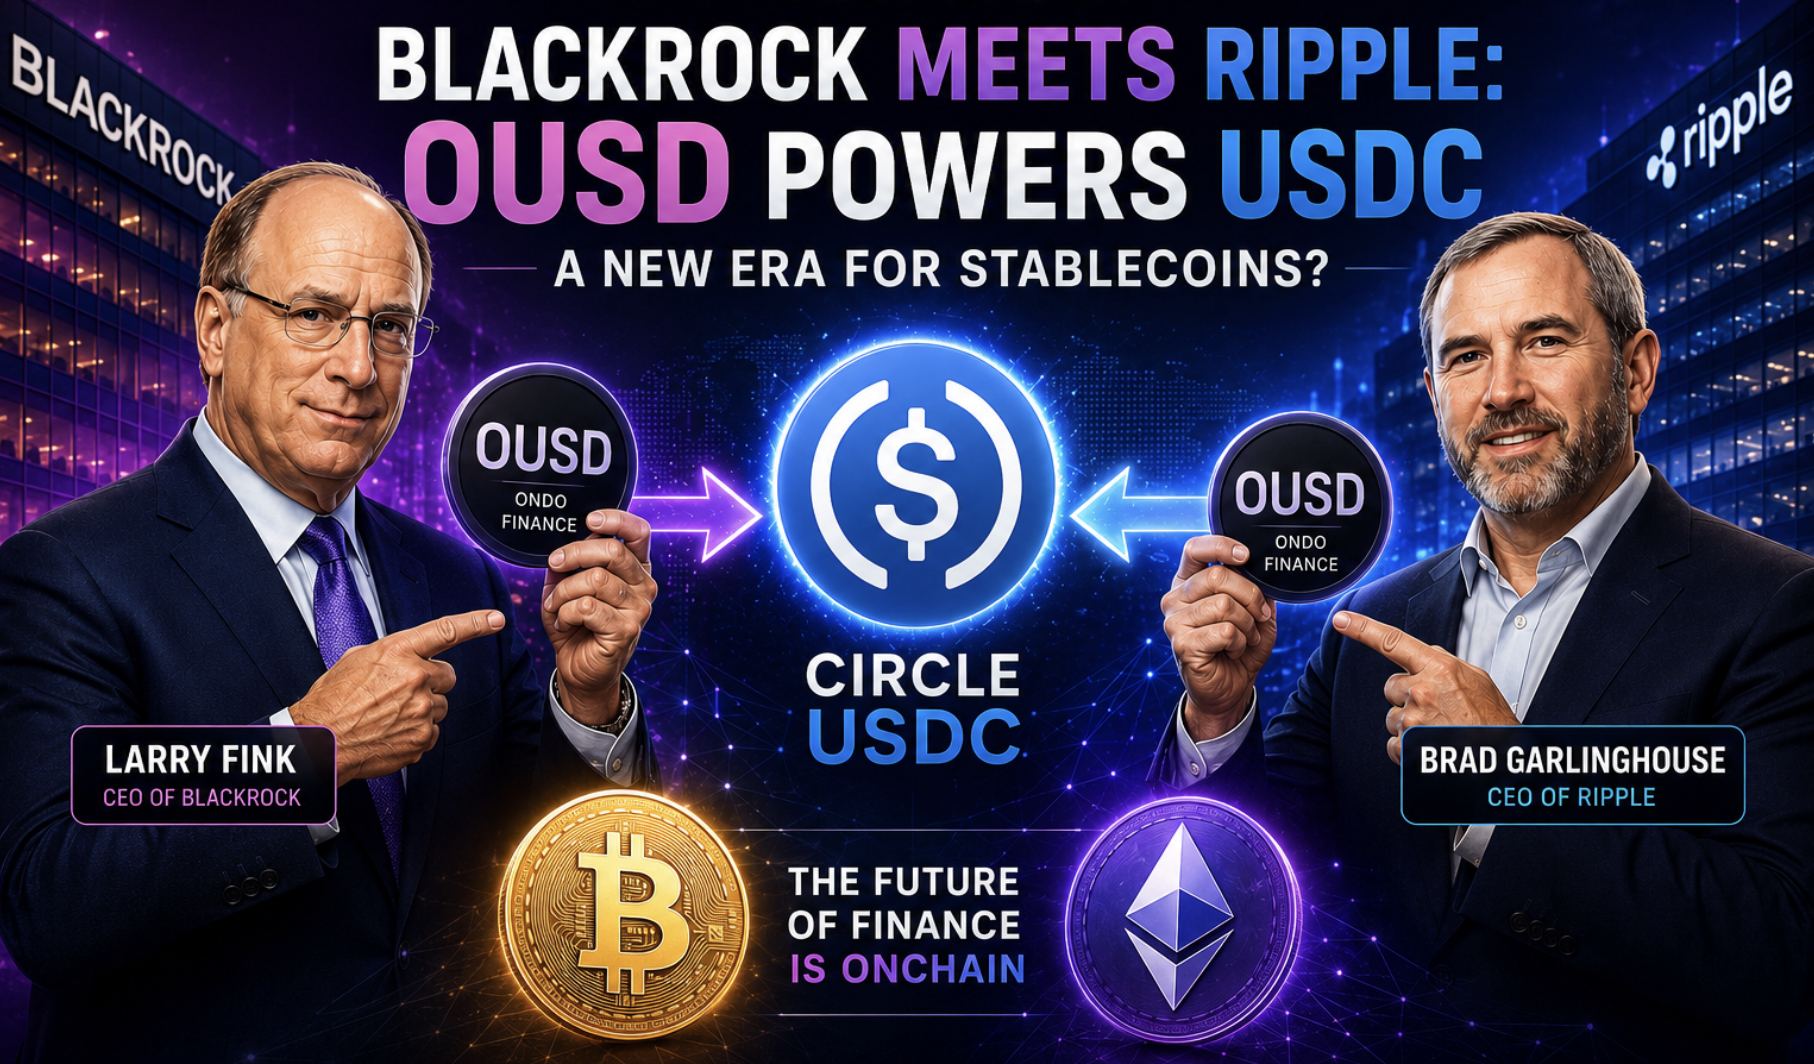
    In a notable development, Blackrock is not only reducing its Bitcoin ETF holdings but is also reportedly backing a new stablecoin consortium, Open USD (OUSD), alongside major players like Visa, Mastercard, Coinbase, and Stripe, among over 140 other firms. This move has led to a significant drop in Circle’s stock value, with its shares falling 17% as OUSD gains traction. Circle’s CEO has publicly addressed the competitive landscape, while yield-generating initiatives, such as MetaMask’s new yield-paying accounts, are also gaining momentum.

    Regulatory Landscape and Market Outlook

    The Supreme Court’s recent decision has cleared the path for former President Trump to potentially influence leadership at the SEC and CFTC, signaling potential shifts in regulatory oversight. In Europe, the grace period for the Markets in Crypto-Asset (MiCA) regulation has ended, prompting Tether to withdraw certain services from parts of the region. While Binance has secured a MiCA license, other entities like Venga are also navigating the new regulatory framework. In the U.S., the CLARITY Act’s prospects appear to be diminishing, though Trump has publicly voiced opposition to banks, and the SEC continues to solicit comments on novel ETF proposals.

    The divergence between cautious institutional investors and the aggressive accumulation by whales and corporations presents a strong bullish signal. As Blackrock and other ETF issuers continue to sell, on-chain data indicates the largest historical accumulation spike, and treasury-holding companies remain active buyers.

    The price action for both Bitcoin and Ethereum appears increasingly constructive, especially with the upcoming Glamsterdam upgrades. Regulatory clarity is progressing, despite challenges from traditional financial institutions, and whales are actively positioning themselves in the market.

  • Crypto Buy Signals Emerge: Is the Bottom In?

    Crypto Buy Signals Emerge: Is the Bottom In?

    Crypto Market Signals Potential Bottom Amidst Widespread Losses

    The cryptocurrency market has experienced significant downturns in recent weeks, with many industry participants bracing for further short-term declines. However, one prominent analyst suggests that the market may have already hit its nadir, citing simultaneous buy signals across four of the largest digital assets.

    Ali Martinez, a well-known analyst, posits that the worst of the downturn could be over, based on his analysis of the recent performance of Bitcoin (BTC), Ethereum (ETH), Ripple (XRP), and Solana (SOL). He highlighted that the Tom DeMark (TD) Sequential Indicator, on a monthly timeframe, has issued buy signals for these cryptocurrencies.

    “On high-timeframe charts like the monthly, these trend-exhaustion setups carry significant weight,” Martinez explained. “Historically, when multiple assets lock in concurrent monthly buy signals, it indicates seller fatigue and a high probability of a long-term market bottom.”

    Other market observers share the sentiment that the cycle’s floor is approaching. X users Bark and Cup are among those who believe the current period presents a prime opportunity for investors. Bark asserted that the window to “buy crypto cheap is almost gone,” while Cup argued that the prevailing bearish sentiment itself suggests the bottom has already been established.

    Despite these optimistic indicators, a significant portion of the market anticipates further pain for bulls, with some even issuing dire predictions. Notably, Dave Portnoy, founder and CEO of Barstool Sports, recently speculated that BTC could plummet to zero. This gloomy outlook has been largely dismissed by prominent industry leaders, some of whom pointed out that market cycle bottoms often coincide with peak pessimism, suggesting this could be such a juncture.

    June proved to be a challenging month for the crypto market, with BTC, ETH, XRP, and SOL all closing in negative territory. However, the current month, July, has historically been favorable for many of these assets. If past trends hold true, a decisive rebound could be on the horizon.

    Bitcoin has finished July in positive territory in 9 out of the past 13 years. Ripple’s XRP has achieved this 7 out of 12 times, while Solana’s SOL has never recorded losses during this specific interval. Furthermore, Solana’s native token typically experiences double-digit percentage gains in July.

    Ethereum stands as the sole cryptocurrency among this group that has more frequently ended July with losses than with gains.

  • VALR Unveils 200+ Hyperliquid Perps Markets

    VALR Unveils 200+ Hyperliquid Perps Markets

    VALR Unveils ‘Perps’ Product, Expanding Trading to Over 200 Global Markets

    Johannesburg, South Africa – July 2nd, 2026 – VALR, a leading digital asset exchange, today announced the upcoming launch of ‘Perps,’ a new cross-asset class perpetuals product that will introduce more than 200 markets to its platform. This significant expansion will allow users to express directional views by going long or short with leverage across a wide array of global equities, commodities, precious metals, stock indices, forex pairs, and crypto assets. The introduction of Perps builds upon VALR’s existing derivatives infrastructure, which first debuted in 2023.

    The new product is powered by an integration with Hyperliquid, a high-performance decentralized blockchain. Leveraging Hyperliquid’s permissionless infrastructure, VALR users will be able to open and manage positions directly within the VALR platform, promising a seamless user experience.

    The addition of over 200 new markets represents a substantial increase in the diversity of assets available through a single digital platform. Notably, this marks the first instance of a major regulated exchange natively integrating an on-chain Layer-1 protocol to source liquidity and execute trades for global cross-asset perpetuals. The newly accessible contracts cover multiple global asset classes, empowering traders to articulate their views on macroeconomic events and capitalize on market volatility.

    Gianluca Sacco, Chief Operating Officer at VALR, commented on the launch: “With this launch, we’re putting over 200 perpetuals markets directly inside the VALR app. This offers 24/7 access to crypto, commodities, currencies, and equities – both listed and pre-IPO – all through the regulated exchange our customers already trust. Perps are how crypto traders take a view on price, a market now exceeding hundreds of billions of dollars in daily volume. We believe they will become the standard for trading across all markets. Our integration of Hyperliquid will provide our users with the deepest on-chain liquidity available anywhere. For VALR customers in South Africa and beyond, this means access to the markets that matter, in real-time.”

    Founded in 2018 and headquartered in Johannesburg, VALR is backed by prominent investors including Pantera Capital, Coinbase Ventures, and Fidelity’s F-Prime Capital. The company stands as the leading digital asset exchange and infrastructure provider on the African continent, offering a comprehensive suite of products such as Spot Trading, Spot Margin, Perpetuals, Staking, Lending, Borrowing, OTC services, VALR Invest, Crypto Bundles, and VALR Pay. VALR holds a license from South Africa’s FSCA and a provisional license from the Cayman Islands Monetary Authority. The exchange serves over 1.9 million registered users and 1,900 corporate and institutional clients globally, with a mission to advance a just financial future that upholds human dignity and the unity of mankind.

    Hyperliquid is a decentralized Layer 1 blockchain recognized for its perpetuals and spot trading capabilities. It is currently the largest and most liquid decentralized exchange, supporting both crypto and real-world assets like oil and precious metals. The Hyperliquid ecosystem also facilitates borrowing, lending, and features a full-fledged EVM.

    Risk Disclosure
    Futures trading is provided by VALR DAM Pty Ltd, a licensed Financial Services Provider (FSP #54897) and Over-the-Counter Derivatives Provider.

    VALR Perps order management, execution, liquidation, margin requirements, position management, mark prices, and funding rates are managed and provided through certain third-party liquidity provider(s). VALR acts solely as an intermediary, enabling account holders to access services offered by these third-party liquidity providers. VALR disclaims any liability arising from or in connection with the acts, omissions, services, pricing, liquidity, order execution, system availability, or operational failures of such third-party liquidity provider(s).

    The use of VALR Perps involves inherent risks. Users are advised to refer to VALR’s Risk Disclosures and Futures Terms of Service for detailed information.

  • Grok AI Forecasts Dramatic XRP Surge by 2026

    Grok AI Forecasts Dramatic XRP Surge by 2026

    Grok AI Forecasts Significant XRP Price Surge by 2026

    Grok AI, the artificial intelligence model developed by Elon Musk, has presented a detailed bullish outlook for XRP, projecting a price range of $4 to $6 by December 2026. This forecast represents a potential four to sixfold increase from XRP’s current valuation.

    The AI’s bullish case hinges on the premise that XRP’s underlying utility is finally translating into sustained demand, a factor that the market has yet to fully reflect in its price.

    Legal Resolution and ETF Approval as Key Drivers

    Central to this optimistic scenario is the complete resolution of the Securities and Exchange Commission (SEC) lawsuit against Ripple. The model anticipates a legal clean slate by August 2025, following a settlement where Ripple pays a $125 million fine without further appeals. This resolution is expected to pave the way for the launch of multiple US spot XRP Exchange-Traded Funds (ETFs) by November 2025, which would then attract consistent institutional investment.

    RLUSD Stablecoin and Network Growth

    Further bolstering the bull case is the surging adoption of the RLUSD stablecoin on the XRP Ledger (XRPL). Grok AI notes that RLUSD has surpassed Ethereum in supply, driving billions in on-chain volume and generating significant XRP fee revenue.

    Concurrently, over 300 financial institutions are reportedly utilizing RippleNet and On-Demand Liquidity for more efficient cross-border payments. The XRPL ecosystem is also expanding with new infrastructure, including a lending protocol, tokens for real-world assets, automated market makers, and permissioned domains.

    Ripple itself is valued at $40 billion, has obtained a trust bank charter, and is forging new partnerships, such as an RLUSD launch in Japan with SBI and tokenized asset initiatives with ties to JPMorgan.

    Macroeconomic Factors and Potential Price Targets

    Grok AI suggests that if a constructive macroeconomic and cryptocurrency bull market emerges alongside these developments, institutional allocation and on-ledger activity could accelerate, driving XRP towards the projected $4 to $6 target by the end of 2026.

    Bearish Scenario and Risk-Reward Analysis

    In contrast, the AI’s bearish outlook is more constrained. Should ETF inflows falter, RLUSD adoption lag, or broader markets experience prolonged consolidation, XRP’s gains could be capped between $2 and $3.

    However, even in this less favorable scenario, Grok AI frames the risk-reward profile as heavily skewed towards the bullish case, citing the removal of regulatory uncertainty and the proven traction of XRP’s underlying infrastructure.

    Technical Analysis and Chart Patterns

    Currently, XRP is trading around $1.06010, having experienced a significant decline from highs above $3.65 in early August of the previous year. This downward trend has been largely unidirectional, with a brief recovery attempt near $2.40 in November failing to sustain momentum.

    The recent dip below $1.03 in June, followed by a modest recovery, is interpreted by the AI as a potential sign of seller exhaustion rather than a healthy pause before further declines.

    Immediate resistance levels are identified at $1.20, which has capped recent rallies, and a more substantial ceiling at $1.60. Support is currently being tested in the $1.04 to $1.06 range, where the price has been consolidating. The overall chart structure depicts a descending staircase pattern over the past year, with each rally failing to reach previous highs.

    Momentum indicators on daily charts show cautious stabilization rather than a reversal, with a slight increase in positive candle formations. The AI emphasizes that the current price action is less indicative of past performance and more a signal for the next five months, with a decisive move above $1.60 being the first significant technical indicator of Grok’s re-rating scenario.

    Market Dynamics and Investment Opportunities

    The article also touches upon broader market dynamics, noting that Bitcoin, Ethereum, and XRP have been facing similar resistance levels for weeks, awaiting a catalyst for the next upward movement. It highlights the concept of “asymmetric returns” in early-stage infrastructure projects, where the gap between intrinsic value and market perception can be substantial before a project gains wider recognition.

    The text then introduces LiquidChain, a project aiming to address cross-chain fragmentation in DeFi by eliminating fees through a unified execution layer. ChatGPT AI has flagged LiquidChain as noteworthy, with its presale at $0.01454 and over $860,000 raised. The article acknowledges that LiquidChain’s execution and adoption remain unproven, contrasting it with established assets that offer predictable, albeit capped, returns.

  • Altman’s AI Predicts Bitcoin Price Shock by 2026

    Altman’s AI Predicts Bitcoin Price Shock by 2026

    Sam Altman’s ChatGPT AI has framed Bitcoin’s current price slump not as a precursor to further decline, but as a prelude to its next significant upward movement. The model forecasts a surge to the $120,000 to $150,000 range by the close of 2026. Should progress be slower than anticipated, it projects a floor of $80,000 to $100,000.

    Bullish Outlook Hinges on Timing

    The optimistic scenario heavily relies on precise timing. With Bitcoin trading around $60,100 currently, the AI model views this as a compelling, asymmetric opportunity heading into the year’s end. The base case suggests the next major phase of the bull market will commence around November, coinciding with improving macroeconomic liquidity and a broader investor rotation back into risk assets.

    Underpinning this outlook is the accelerating institutional adoption through both exchange-traded funds (ETFs) and corporate treasury allocations. This trend, coupled with ongoing global Bitcoin accumulation and a more crypto-friendly U.S. regulatory environment, is building momentum beneath the surface.

    The CLARITY Act is identified as a key potential catalyst. A clearer market structure is expected to unlock capital currently held on the sidelines, awaiting legal certainty. Furthermore, President Trump’s repeated pledges of support for the digital asset industry and his vision for the United States as a global crypto leader are seen by the model as reinforcing long-term investor confidence, despite the uncertainty surrounding specific legislative timelines.

    If these catalysts align as the model anticipates, Bitcoin could realistically reach the $120,000 to $150,000 range by December.

    Bearish Case Centers on Delays

    The bearish scenario, however, centers on delays rather than an outright collapse. The primary risks include a stall in regulatory progress, the Federal Reserve maintaining tighter monetary policy for longer than markets expect, or institutional inflows proving weaker than anticipated.

    Should any combination of these headwinds materialize, the model suggests the rally could be capped, leaving Bitcoin trading closer to the $80,000 to $100,000 range, falling short of the more ambitious bull case target.

    Technical Analysis and Chart Patterns

    Current daily charts show Bitcoin at $59,316, following a substantial decline from its October highs near $127,000. This slide has been steep and persistent, with a notable relief rally in May peaking around $83,000 before sellers regained control.

    In recent sessions, the price has been consolidating in the high $50,000s to low $60,000s, recently dipping below $60,000. This repeated failure to hold above a key round number after an extended downtrend suggests that sellers currently maintain the upper hand.

    Immediate resistance is observed near $64,000, a level that has repeatedly rejected price advances in recent weeks. A more significant ceiling lies further up near $76,000, where the May rally ultimately lost momentum. Support is holding near $59,000, the area currently being tested, with a deeper floor near $55,000 if this level fails.

    The broader chart structure remains a clear downtrend extending back to October, characterized by lower highs and lower lows. Momentum on daily candles appears weak and bearish, with red candles dominating the recent period and limited buying follow-through on occasional bounces.

    Given the significant distance Bitcoin would need to cover to reach even the lower end of the predicted range, the chart suggests that the narrative remains focused on November and beyond. A reclaim of $76,000 would serve as the first tangible signal that the bullish case described by ChatGPT is beginning to materialize.

    Strategic Considerations in a Capped Market

    The rotation into new opportunities is already underway, though many may only recognize it in hindsight. Large-cap cryptocurrencies are not failing but rather appear capped, with Bitcoin, Ethereum, and XRP pressing against similar resistance bands for weeks as macroeconomic tailwinds are repeatedly delayed. Institutional inflows are being pushed to subsequent quarters. Holding assets whose upside is contingent on uncontrollable catalysts is characterized as waiting rather than a strategic approach.

    Capital that has weathered multiple market cycles typically moves proactively before a destination becomes obvious, rather than waiting at resistance levels. Early-stage infrastructure projects, operating with significantly smaller market capitalizations, offer a different dynamic. A modest rotation can lead to dramatic price movements due to their nascent stage. The asymmetry arises because the market has not yet priced in the full potential of these projects, creating a gap between current valuation and intrinsic worth, which drives returns.

    The fragmentation across multiple blockchain ecosystems incurs significant daily costs for decentralized finance (DeFi). Bitcoin, Ethereum, and Solana currently operate with isolated liquidity systems, lacking native interoperability. Users transferring value between these ecosystems absorb costs through fees, slippage, and failed transactions.

    LiquidChain aims to consolidate these three networks into a single execution layer, enabling one deployment and full ecosystem access without the “cross-chain tax” on every interaction. This fundamental innovation has yet to be widely recognized by the market.

    The LiquidChain presale is priced at $0.01454, with over $880,000 raised. This position is described as being at the “ground floor” of its lifecycle, not as a marketing slogan.

    The project’s execution remains unproven, and adoption is unknown, presenting real risks that are openly acknowledged. Established assets may offer a smoother path to a visible ceiling, whereas this opportunity provides an earlier entry into a nascent ecosystem.