Tag: Market Trends

  • XRP Price Surge: What’s Next After 8% Weekly Gain?

    XRP Price Surge: What’s Next After 8% Weekly Gain?

    Ripple’s XRP has staged a significant recovery from recent lows, confirming a bullish divergence that emerged near a key support level. While the broader market structure remains in a corrective phase, the latest surge has propelled XRP back toward a critical technical inflection point that could dictate its next directional move.

    Daily Chart Outlook

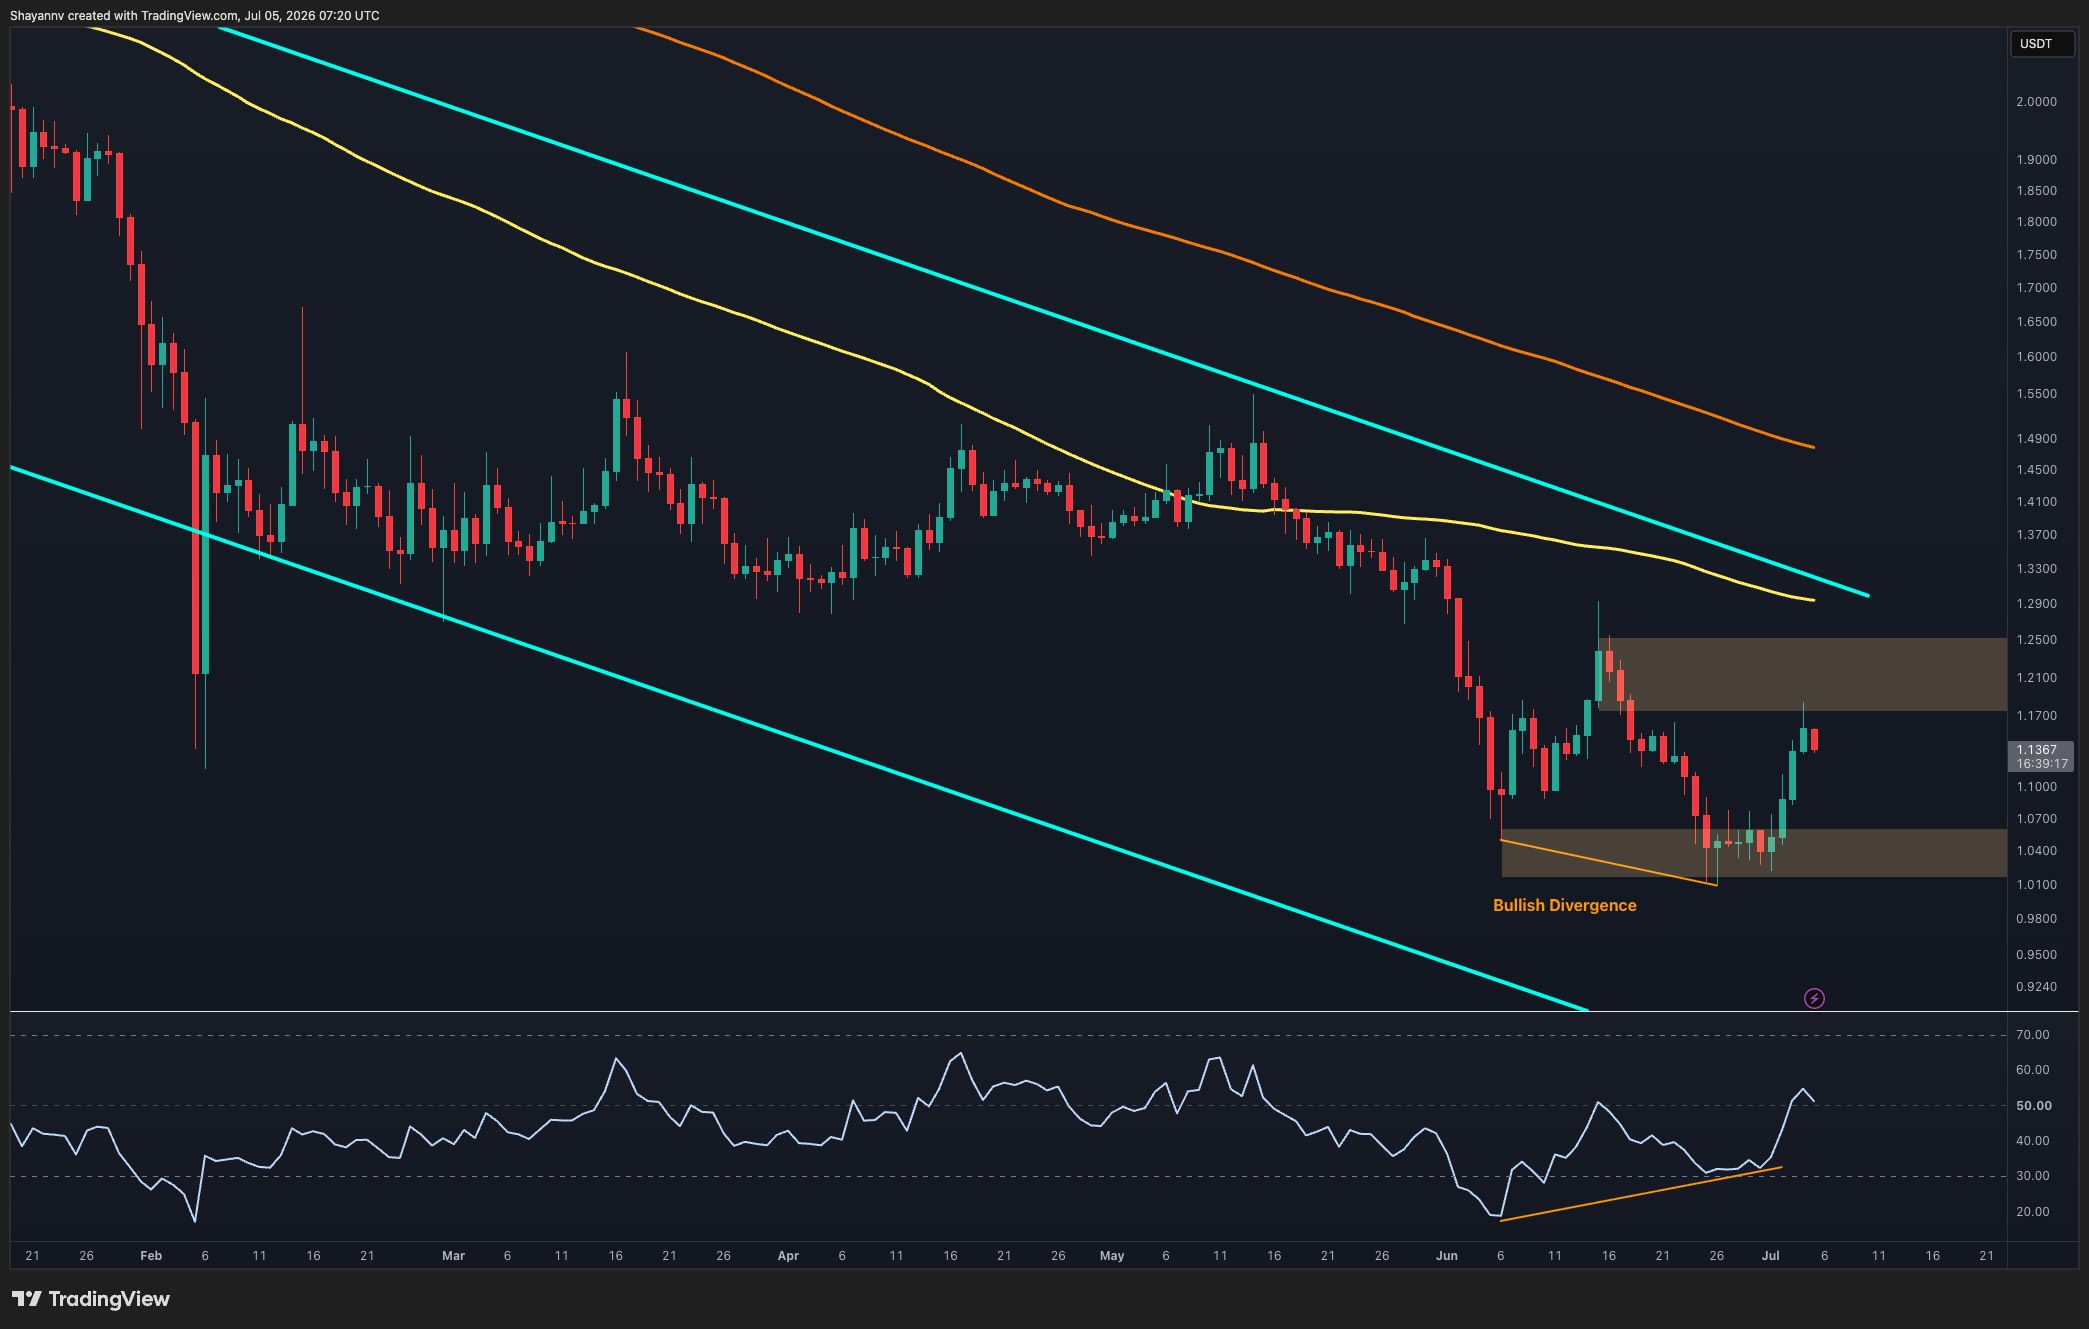
    On the daily timeframe, XRP continues to trade within a long-term descending channel. It remains below major moving averages and the upper boundary of this channel. Despite this overarching bearish structure, recent price action has shown considerable improvement.

    The bullish Relative Strength Index (RSI) divergence that formed around the $1.02-$1.05 support zone has played out as anticipated. During this period, XRP was making lower lows while momentum indicators were printing higher lows, signaling a waning selling pressure. Since then, XRP has experienced a sharp rebound, reclaiming the lower support region between $1.02 and $1.06.

    This recovery has now brought the price to the first significant resistance zone, situated between $1.17 and $1.24. This area previously served as support before the recent breakdown and is now acting as a supply zone. The RSI has also moved back above the midline, indicating improving momentum and bolstering the case for a continued recovery attempt.

    However, the broader trend remains bearish as long as XRP trades below the descending channel’s resistance and the overhead moving averages. A successful reclaim of the $1.17-$1.24 region would be the initial indication that the market is attempting to build a larger reversal structure.

    Four-Hour Chart Insights

    The 4-hour chart offers a clearer perspective on the recent breakout. XRP spent several days consolidating within the $1.02-$1.06 demand zone before buyers aggressively intervened, triggering a sharp rally toward the descending trendline resistance.

    This move has already seen XRP reclaim its local support area and push directly into the trendline that has capped higher highs since mid-June. XRP is now testing this dynamic resistance as it approaches the lower boundary of the broader $1.21-$1.29 supply zone.

    This presents a pivotal juncture. A confirmed breakout above the descending trendline would likely pave the way for a move into the upper resistance region, where sellers might attempt to reassert control. Such a breakout would also signify a short-term structural shift after weeks of lower highs and lower lows.

    Conversely, a failure to break through the trendline could lead to a temporary pullback toward the recently reclaimed support zone. As long as XRP remains above the $1.02-$1.06 area, the current recovery structure is expected to hold.

    For the moment, short-term momentum favors the bulls. However, the market is approaching a significant resistance cluster, and a decisive breakout will be necessary to confirm that this recovery is evolving into something more substantial than a mere relief rally.

  • XRP Sees 22% June Drop, Eyes Major July Rally

    XRP Sees 22% June Drop, Eyes Major July Rally

    XRP Suffered a Significant June Decline, But Historical Trends Point to a Potential July Rally

    XRP has not been immune to the broader market downturn, experiencing a sharp fall in June to a multi-year low of $1.00. However, this critical support level held firm against bearish pressure, allowing the digital asset to stage a swift recovery. All eyes are now on July, a month that has historically been one of XRP’s strongest performers, particularly in recent years, with each of the past four Julys delivering double-digit gains. The question on investors’ minds is what the outlook holds for July 2026.

    Data from Cryptorank reveals that XRP concluded June with a substantial 22.1% decrease. During the month, the asset dipped to $1.01 on most exchanges, influenced by widespread cryptocurrency apprehension, escalating geopolitical tensions in the Middle East, and other market-moving factors. This marked its lowest price point since late 2024 and saw it fall out of the top five cryptocurrencies by market capitalization.

    While XRP has since rebounded to $1.15 as of press time, it remains positioned below stablecoins like USDC and USDT, as well as major cryptocurrencies such as BNB, ETH, and BTC. Nevertheless, historical performance offers a glimmer of hope for XRP bulls in July. All six previous Julys have seen XRP trade in positive territory, with five of those months recording double-digit percentage increases.

    July 2020 and July 2023 were particularly strong, with XRP prices surging by 48.1% and 47.6%, respectively. The previous year saw a remarkable 35% increase, following a 31.2% jump in the year prior. More modest gains were observed in July 2022 (14.6%) and July 2021 (6.91%).

    However, a caveat exists for the current July. While XRP has already begun the month with a 9% increase, the five Julys preceding the aforementioned strong performances, specifically from 2015 to 2019, were all in negative territory. This raises the question of which historical pattern XRP will follow this time.

    Potential Catalysts for Growth

    One factor that could drive XRP higher is the ongoing inflows into spot Ripple Exchange-Traded Funds (ETFs). Reports over the weekend indicated that these funds have extended their positive streak to nine consecutive weeks of gains.

    Quarterly Performance and Historical Rebounds

    The 22.1% drop in June contributed to a similar 22.4% decline for XRP in the second quarter of 2026. This marked the first time in its history that XRP has experienced three consecutive quarters of losses, each accompanied by significant downturns. XRP saw a 35.4% decrease in Q4 2025, followed by a 27.1% drop in Q1 2026, and the aforementioned 22.4% decline in Q2 2026.

    The encouraging news for XRP supporters is that the token has historically demonstrated substantial gains following periods of negative streaks. The coming months will be crucial in determining whether history repeats itself or if the current downward trend is set to continue.

  • Bitcoin Suffers Worst Month in Four Years: Outlook for July

    Bitcoin Suffers Worst Month in Four Years: Outlook for July

    Bitcoin Suffers Worst Month in Four Years, Eyes July Recovery

    Bitcoin has endured a challenging start to 2026, with the cryptocurrency experiencing losses in four out of the past six months. June proved particularly brutal, marking the worst monthly performance in four years. However, historical data suggests July could offer a reprieve for Bitcoin, and the month has begun with promising signs. The key question now is whether the digital asset can sustain this momentum in the coming weeks.

    May’s Peak and June’s Plunge

    The narrative for Bitcoin in 2026 took a sharp turn in May. Mid-month, the price of Bitcoin surged past $82,000, leading many analysts to believe that the asset had recovered from its earlier losses and was poised for a new bull run.

    This optimism proved short-lived. The rejection at that price level reinforced the “sell in May and go away” sentiment. June saw the cryptocurrency plummet, falling below $70,000 and even dipping below $60,000 on several occasions – a level not seen since before the U.S. presidential elections in late 2024. After shedding approximately $25,000 in a matter of weeks, Bitcoin finally showed early signs of recovery and regained some footing by the end of the month. Despite this late-month rebound, Bitcoin concluded June with a 20.5% loss, its steepest monthly decline in four years.

    Historical Precedent for July

    Analysis of past performance indicates that July has historically been a more favorable month for Bitcoin. In the last 13 years, nine Julys have resulted in gains for the cryptocurrency. Crucially, every July that has followed a losing June has seen Bitcoin finish the month in positive territory.

    The current July has started on a positive note, with Bitcoin trading around $63,000 over the weekend. However, for the month to deliver a much-needed recovery, several factors need to improve in the coming weeks.

    Firstly, the sustained record net outflows from spot Bitcoin Exchange-Traded Funds (ETFs) must cease. These outflows have been a significant impediment to Bitcoin’s progress for months.

    Secondly, recent on-chain data, particularly the Coinbase Premium metric, suggests a lack of genuine demand from U.S. and even Korean investors.

    On a broader macroeconomic front, a de-escalation of tensions or a lasting peace agreement in the Middle East would be beneficial. Additionally, resolving the uncertainty surrounding the upcoming U.S. midterm elections could provide a positive catalyst.

    Despite these headwinds, Bitcoin has recently displayed some bullish signals, rebounding past the significant $60,000 level. Analysts are now closely watching for the next major breakout.

    Crypto analyst Rekt Capital also commented on Bitcoin’s July prospects, suggesting that the cryptocurrency may attempt to retest the 50-Month Exponential Moving Average (EMA), currently around $65,000, as resistance.

    “It’s Green July and history suggests Bitcoin will be looking to turn the 50-Month EMA (purple) into new resistance,” Rekt Capital posted on X (formerly Twitter) on July 4, 2026, alongside a chart illustrating the trend.

  • Altman’s AI Forecasts Major Meta Stock Jump by 2026

    Altman’s AI Forecasts Major Meta Stock Jump by 2026

    Sam Altman’s AI Predicts Significant Meta Stock Surge by 2026

    Sam Altman, through an AI model associated with ChatGPT, has identified Meta Platforms stock as presenting one of the most compelling entry points in years for a company that has historically traded well above its current valuation. The model forecasts a price range of $750 to $900 by December 2026, a target that the stock has previously reached within the current market cycle.

    The Bull Case: Advertising Powerhouse and Emerging AI Infrastructure

    The optimistic outlook for Meta hinges on its dual identity as a dominant advertising business that is simultaneously evolving into a significant player in AI infrastructure. Currently trading around $582, the core thesis begins with Meta’s established strength: its AI-driven ad recommendation engine, which has consistently driven revenue growth quarter after quarter.

    Meta’s Advantage+ advertising tools are reportedly capturing market share from competitors. Furthermore, the monetization of WhatsApp is still in its nascent stages, offering substantial room for expansion. The company is also layering new AI products onto its existing user base, creating additional avenues for growth.

    A potentially transformative development, which the AI model highlights as not yet fully priced in by most investors, is Meta’s reported exploration of commercializing its surplus AI computing capacity through a cloud business. Such a move would unlock an entirely new revenue stream beyond advertising, bolstering investor confidence that the company’s substantial AI infrastructure investments are yielding tangible long-term returns rather than simply consuming capital. If these various growth initiatives align, the AI model suggests a clear trajectory for Meta to reclaim and surpass its previous highs.

    The Bear Case: Execution Risks and Market Headwinds

    Conversely, the pessimistic scenario for Meta is rooted in significant execution risks that are difficult to overlook. The company’s annual AI capital expenditures have surged to over $100 billion. Meanwhile, its Reality Labs division continues to incur substantial losses without a clear path to profitability. Any deceleration in digital advertising demand or a failure to rapidly monetize new AI products could compress profit margins, potentially confining the stock to a range between $550 and $650 for an extended period, hindering its ability to break out to new highs.

    Technical Analysis: Consolidation and Key Levels

    On the daily chart, Meta is trading at $582.90, following a sharp decline from highs near $800 reached in the summer of 2025. This peak represented one of the stock’s most powerful rallies before encountering significant selling pressure in the latter half of the previous year.

    The stock found support around $525 in late 2025 before rebounding towards $750 in early 2026. It subsequently retreated and has largely traded within a broad, volatile range between $550 and $680 for most of the current year. The most recent downward movement in late June brought the price back towards $555, with today’s trading session seeing a bounce to $582.90, placing Meta squarely in the middle of its current consolidation range.

    Immediate resistance is observed near $630, the level that capped the most recent attempt at a relief rally. A more formidable resistance lies around $680, where the stock has faced multiple rejections throughout 2026. Beyond this, the $750 level serves as the lower bound of the bull case target and a prior high from earlier in the year, making it a critical technical checkpoint before any realistic push towards $800 or $900.

    Support remains firm near $550, a zone that has absorbed selling pressure on several occasions over the past few months. The overall technical pattern suggests a stock in an extended consolidation phase after an exceptional run, working through excess valuation rather than exhibiting structural weakness.

    Momentum indicators on the daily charts appear indecisive and choppy, lacking a clear directional trend in recent months. A sustained push above $630 and its subsequent defense could signal a continuation of the longer-term uptrend, paving the way for the bull case targets rather than an improbable surge into uncharted territory.

    Crypto Market Dynamics: Beyond Established Assets

    The broader market sentiment suggests a rotation is underway, though its full impact may only be apparent in hindsight. Large-cap cryptocurrencies like Bitcoin, Ethereum, and XRP are currently facing resistance, with their upside dependent on external catalysts that remain uncertain. The delay in anticipated macro tailwinds and institutional inflows is prompting a shift in strategy for capital that has navigated multiple market cycles. Instead of waiting at resistance levels, such capital is moving to capitalize on opportunities before they become obvious.

    Early-stage infrastructure projects operate on a different valuation model. Their smaller market capitalization means that even modest capital rotations can lead to significant price movements. This asymmetry arises because the market has not yet fully priced in the potential of these nascent ventures. The gap between their current valuation and their intrinsic worth is where substantial returns are generated.

    The fragmentation of multi-chain ecosystems incurs significant costs for decentralized finance (DeFi). Bitcoin, Ethereum, and Solana, for instance, operate with isolated liquidity systems, lacking native interoperability. Every transaction between these ecosystems results in users absorbing costs through fees, slippage, and failed transactions.

    LiquidChain aims to address this by unifying these three networks into a single execution layer, offering full ecosystem access with a single deployment and eliminating cross-chain taxes on every interaction. This innovative approach has yet to be widely recognized by the market.

    The LiquidChain presale is currently priced at $0.01454, having raised just over $820,000. This represents an early-stage opportunity, distinct from marketing claims. While execution and adoption remain unproven, and these risks are acknowledged, established assets offer a more predictable path to a visible ceiling. LiquidChain, conversely, provides an opportunity to enter at an earlier stage.

  • JP Morgan: Saylor’s Bitcoin Strategy Poses Risk

    JP Morgan: Saylor’s Bitcoin Strategy Poses Risk

    JPMorgan has identified a structural risk that many Bitcoin price prediction bulls may have overlooked: the very entity driving the most aggressive institutional accumulation on record could, under certain circumstances, be compelled to sell.

    This potential tension has become a tangible market factor. Bitcoin is currently consolidating near a critical technical support level, while analysts are divided on whether Michael Saylor’s ambitious $150,000 year-end target or JPMorgan’s more conservative models better represent actual market dynamics. The answer to this debate holds significant implications for anyone holding Bitcoin into the latter half of the year.

    JPMorgan’s Warning on Strategy’s Financing

    JPMorgan’s concern primarily stems from the financing structure employed by MicroStrategy, the company led by Michael Saylor. By utilizing a combination of convertible notes, preferred equity, and at-the-money offerings to fund its Bitcoin acquisitions, MicroStrategy has created a scenario where credit stress or pressure from equity dilution could force the company to shift from being a net buyer to a net seller of Bitcoin. Given MicroStrategy’s substantial holdings, this represents a non-trivial tail risk.

    Saylor’s public stance remains resolute, with projections of $150,000 by year-end, $1 million within four to eight years, and $20 million over two decades. However, JPMorgan’s apprehension is not about Saylor’s conviction itself, but rather about the potential market implications if that conviction is tested by margin mechanics.

    This divergence between the narrative of corporate accumulation and institutional risk modeling is precisely the kind of signal that often proves significant at market inflection points.

    Bitcoin’s Next Move and Key Levels

    Bitcoin’s next directional move may depend less on Saylor’s next purchase announcement and more on how the market absorbs this structural overhang. Broader macroeconomic liquidity conditions further complicate an already complex decision-making process for investors.

    Analysts closely monitoring Bitcoin’s current consolidation phase are watching the $60,000 level as primary support. Holding this level would maintain the current recovery thesis, while a breach would undermine it.

    The immediate zone for a potential reclaim sits between $62,000 and $64,000. A decisive move through this range would bring $65,000 back into play, followed by $70,000, a level that has acted as both resistance and a magnet in multiple recent trading cycles.

    Confirmation through trading volume is crucial. Consolidation without an increase in volume is considered noise rather than a clear signal.

    If Bitcoin holds $60,000 and reclaims $64,000 on increased volume, it would reassert the narrative of Saylor’s accumulation as the dominant market frame. In such a scenario, JPMorgan’s short-term target of $170,000 and its eventual gold-parity estimate of $266,000 would likely become the baseline for institutional positioning.

    Should neither side gain decisive control, a sideways trading range between $60,000 and $65,000 could persist as the market digests JPMorgan’s risk assessment alongside continued MicroStrategy purchases.

    Potential Downside Scenarios

    While the market is described as “choppy but not broken,” a confirmed close below $60,000 could trigger a slide towards $55,000. At this lower level, more bearish analyst models would begin to appear credible, and concerns about MicroStrategy’s balance sheet resilience would intensify.

    The current market setup suggests cautious consolidation rather than a confirmed breakout. A disciplined approach right now would favor patience over strong conviction.

    Scaling Challenges and Infrastructure Plays

    For spot Bitcoin holders observing JPMorgan’s risk warning, an uncomfortable reality emerges: the optimistic upside scenarios are predicated on Bitcoin’s infrastructure being capable of scaling to accommodate mass institutional and retail adoption. Currently, its throughput is insufficient for such widespread use.

    This gap between Bitcoin’s store-of-value narrative and its transactional limitations is precisely where the next generation of infrastructure solutions is being developed, with many still trading at early-stage valuations.

    Bitcoin Hyper ($HYPER) is positioning itself to address this specific gap. It aims to be the first Bitcoin Layer 2 solution to integrate the Solana Virtual Machine (SVM), promising sub-second finality and low-cost smart contract execution within the Bitcoin ecosystem without compromising Bitcoin’s core security model.

    The architecture includes a Decentralized Canonical Bridge for native Bitcoin transfers and SVM-powered programmability, which the development team claims surpasses Solana’s own latency benchmarks. However, the critical question for serious infrastructure investors remains whether this performance can be sustained at scale.

    The presale for Bitcoin Hyper has raised over $32.9 million, with the current price at $0.0136825. Staking is active for early participants. As with any early-stage infrastructure presale, execution risk is a significant factor, and timelines are often subject to change.

  • Altcoin Surges 80% Daily as Bitcoin Nears $63K

    Altcoin Surges 80% Daily as Bitcoin Nears $63K

    Bitcoin’s gradual price recovery, which commenced after a correction in early July, is continuing, with the cryptocurrency briefly surpassing $63,000 yesterday and currently trading around that level.

    Altcoin Performance Varies Amidst Bitcoin’s Rise

    Most larger-cap altcoins have shown limited movement on a daily basis. Notable exceptions include SOL, HYPE, and XLM, which have experienced declines of up to 4%, while ADA and BCH have posted significant gains.

    Bitcoin’s Mid-Year Rebound

    June proved to be a challenging month for Bitcoin, with a price drop exceeding 20%. July began similarly, as the asset dipped below $58,000, marking a new multi-year low. However, buyers intervened at this juncture, preventing further declines.

    Instead, Bitcoin began to regain ground, quickly reclaiming the $60,000 mark. Following a brief dip below this threshold, bulls reasserted control, driving the price to $62,000. This surge was partly attributed to easing net withdrawals from Bitcoin ETFs and renewed investor inflows on Thursday.

    BTC maintained a stable position above $61,000 before experiencing another upward movement on Saturday and early this morning, reaching a multi-week peak of $63,400. Although it encountered resistance at that point, the cryptocurrency is now trading close to $63,000, reflecting a nearly 5% increase over the past week.

    Bitcoin’s market capitalization has climbed to $1.260 trillion, according to CoinGecko. However, its dominance over altcoins remains below 57%.

    Ethereum and Other Major Altcoins

    Ethereum faced resistance at $1,800 yesterday and is currently trading just above $1,760. BNB has been unable to reclaim the $580 level and is trading below it. XRP is priced under $1.15, while SOL is testing the $80 support level after a 2.4% daily decrease.

    HYPE and XLM have seen steeper declines, with HYPE down 4% and XLM down 3.4%. In contrast, ADA continues its recovery, with another 9% surge pushing its price well over $0.19. BCH has gained approximately 6%, trading at $240.

    Top Performer and Market Cap

    LAB has emerged as the top gainer of the day, skyrocketing by 80%. This asset, which has experienced considerable volatility recently, is now trading above $16.

    The total cryptocurrency market capitalization has seen a slight increase from yesterday, currently standing at $2.230 trillion on CoinGecko.

  • XRP Dominates ETF Inflows Amidst Emerging Concerns

    XRP Dominates ETF Inflows Amidst Emerging Concerns

    Ripple’s XRP ETFs Outshine Market Leaders, Maintain Strong Inflows

    In a notable shift in investor behavior towards crypto-based exchange-traded funds, Ripple’s cross-border token, XRP, is emerging as a clear frontrunner, surpassing even the market’s dominant players, Bitcoin (BTC) and Ethereum (ETH).

    Financial vehicles tracking XRP’s performance have continued to defy broader market weakness, posting another week of positive returns. While HYPE ETFs also experienced a positive week, their inflows saw a significant decrease compared to the previous period.

    Following a robust end to the prior business week, during which investors injected $15.63 million into spot XRP ETFs on Friday, anticipation for a strong start to the current week was high. Data from SoSoValue confirmed these expectations, with $15.34 million flowing into the ETFs on Monday.

    However, the trend shifted on Tuesday and Wednesday, with net withdrawals dominating. Investors pulled $2.83 million and $1.86 million, respectively, on these days. This marked a rare dip into negative territory for the funds, which have largely avoided red days recently, a stark contrast to the general trend among other ETFs. The last instance of net outflows occurred on June 3.

    Furthermore, the occurrence of two consecutive days of net withdrawals is uncommon, with the last such period happening nearly three months ago, in early March. In a reversal of fortunes, the funds rebounded, recording $6.55 million in net inflows on Thursday, the final trading day of the week due to the July 4 holiday.

    Consequently, the week concluded with substantial net inflows of $17.19 million, extending a remarkable streak of positive weeks. The last time XRP ETFs experienced a net outflow for an entire week was in late April or early May.

    This positive momentum in the ETF market appears to be influencing the underlying asset, with XRP’s price rising by over 8% in the past week, now trading near $0.15.

    HYPE ETFs also saw significant activity during the last full business week of June, attracting a record-breaking net inflow of $111.36 million. Although the subsequent four-day business week also registered positive inflows, the amount was considerably more modest, totaling $4.32 million.

    Despite a net outflow of $3.01 million on Tuesday, the cumulative total net inflows for HYPE ETFs remain at an all-time high, approaching $300 million.

  • XRP: Fakeout or Prelude to Volatility?

    XRP: Fakeout or Prelude to Volatility?

    XRP Derivatives Signal Cautious Optimism Amidst Shifting Market Dynamics

    XRP is currently exhibiting a notable derivatives setup among large-cap altcoins. While its price is experiencing a gradual ascent, open interest has been declining. Typically, this scenario suggests traders are withdrawing from the market. However, when coupled with a rising net position delta, it warrants closer observation.

    Short Covering Fuels Current Uptrend

    According to analysts, the recent uptrend in XRP appears to be primarily driven by the closure of short positions rather than aggressive new buying. In simpler terms, bearish traders are exiting the market, and this short-covering pressure is contributing to XRP’s price increase. While this can support a steady upward movement, it is insufficient for a sustained rally. A genuine acceleration typically occurs when new buyers enter the market with conviction.

    Open Interest Reflects Waning Conviction

    The significance of open interest lies in its indication of leverage. A decreasing open interest suggests a reduction in leverage, not an increase, which is generally a sign of waning conviction among traders.

    Daily Outlook and Key Resistance Levels

    The daily outlook supports a cautious bullish bias. XRP closed bullishly in yesterday’s trading session, but it must maintain this position to avoid slipping back into weaker territory. Consequently, a move towards the resistance level at $1.13 is crucial. Stronger momentum could potentially drive the price even higher.

    The Real Trigger for Acceleration

    The key signal that traders should monitor is a simultaneous increase in both open interest and net position delta. This would indicate a market shift from an environment where price increases are driven by short covering to one where new long positions are being established. Such a shift could lead to a more rapid acceleration in XRP’s price.

    Intraday Volatility and Potential Breakout

    Intraday, XRP remains relatively volatile and confined within a trading range. A successful push above and sustained hold of $1.18 could present an opportunity for buyers to re-enter the market with significant force.

    For the time being, the signal is clear: bears appear to be relinquishing their hold, but bulls have yet to enter the market with decisive conviction.

  • Bitcoin Stays Above $62K Amid Altcoin Rally

    Bitcoin Stays Above $62K Amid Altcoin Rally

    Bitcoin Holds Above $62K Amid Broader Market Recovery

    The cryptocurrency market has sustained its recovery over the past 24 hours, with most large-cap altcoins trading in positive territory. Bitcoin has maintained its recent rebound, while several altcoins have posted even stronger daily gains.

    The total cryptocurrency market capitalization has also increased, as traders have returned to risk assets following a volatile start to the month. Bitcoin’s dominance has remained steady, suggesting a balanced market recovery is underway.

    Bitcoin’s price has largely traded in the green over the last 24 hours, holding above the $62,000 mark after reclaiming it earlier in the week. The digital asset was trading at approximately $62,500, representing a roughly 1.3% increase on the day and a 3.6% gain for the week.

    BTC experienced a relatively tight daily trading range, briefly dipping towards $61,500 before buyers intervened and pushed the price back up. It reached an intraday high of around $62,800, keeping its market capitalization near $1.25 trillion.

    Flows into spot Bitcoin Exchange-Traded Funds (ETFs) also showed signs of stabilization. US spot Bitcoin ETFs recorded net inflows of approximately $220 million on July 2nd. Notably, the majority of these inflows were directed towards Fidelity’s products, as BlackRock clients continued to divest, offloading over $40 million.

    The broader cryptocurrency market has also seen improvement, with total market capitalization surpassing $2.2 trillion.

    Ethereum was trading around $1,754, marking a gain of over 2% on the day and a significant 11% increase over the past week, positioning it as a standout performer. Among other large-cap altcoins, Hyperliquid’s HYPE token was among the biggest gainers in the last 24 hours, rising above $71 with an increase of more than 6%. Cardano also experienced a sharp advance, while XRP, Stellar, Dogecoin, Solana, and others posted more modest gains.

    The market’s next key test will be whether Bitcoin can break above the current resistance zone between $62,000 and $63,000, while altcoin momentum continues into the weekend.

  • XRP Price Surge Predicted by MVRV Data

    XRP Price Surge Predicted by MVRV Data

    XRP Price Hovers Near $1, Amid Deepest On-Chain Signals in History

    XRP is currently trading in the $1.00 to $1.10 range, while on-chain data is flashing some of the most significant predictive signals seen in the token’s history. Both short-term and long-term holders are experiencing substantial unrealized losses, a rare combination that typically captures the attention of traders. Nevertheless, for bulls to claim a sustained trend reversal, a decisive breakout is still required.

    On-Chain Metrics Signal Extreme Pessimism

    Santiment data reveals XRP’s 30-day MVRV (Market Value to Realized Value) at approximately -45%, with its 365-day MVRV near -47%. This represents the weakest combined reading across both timeframes on record, indicating that most holders are currently “underwater,” regardless of their purchase date. While extreme market pain is rarely permanent, accurately timing a recovery remains a challenge.

    MVRV-Z Score and Golden Cross Offer Hope

    The MVRV-Z Score has remained below zero for nearly two weeks, mirroring conditions observed before previous significant recoveries. Concurrently, analysts are observing a fresh MVRV golden cross, with the ratio climbing back above its 200-day moving average. If this signal holds, long-term momentum could begin to shift.

    Key Resistance Levels to Watch

    However, the broader cryptocurrency market remains fragile, which could potentially slow any recovery. The resistance zone between $1.15 and $1.20 is therefore a critical level to monitor. A clear break above this range would bolster the bullish case, whereas another rejection could prolong XRP’s current stagnation.

    XRP is consolidating after a bounce from recent yearly lows. Trading volume remains elevated, indicating an ongoing battle for control between buyers and sellers, with neither side yielding ground.

    The first significant resistance lies around the $1.15 to $1.20 mark. A convincing breakout above this zone would provide the initial meaningful indication of a shift in momentum. Beyond this, traders are watching the $1.35 area, with stronger resistance appearing closer to the long-term downtrend.

    Potential Scenarios for XRP

    Several paths remain open for XRP. If the token defends its support levels and breaks through resistance with strong volume, bullish momentum could accelerate rapidly. Alternatively, extended consolidation could allow on-chain metrics to recover while the market seeks a new direction. Sometimes, markets simply require patience.

    A daily close below the psychological $1.00 level would diminish the bullish outlook and increase the risk of further downside. Nevertheless, the deeply negative MVRV readings suggest that much of the prevailing pessimism has already been priced in. While this does not guarantee a rally, it keeps the possibility of a recovery alive.

    Investment Considerations for Large-Cap Assets

    While XRP’s MVRV setup is compelling, at its current market capitalization, the potential for asymmetric upside for cycle traders is structurally limited compared to opportunities in earlier-stage projects. This is an unavoidable reality when considering a recovery play in a large-cap asset versus positioning in infrastructure still in its price discovery phase. This distinction does not render XRP a poor trade, but it fundamentally alters the expected return profile.

    LiquidChain: A New Cross-Chain Liquidity Layer

    LiquidChain, an L3 infrastructure project, is positioning itself as a cross-chain liquidity layer, aiming to unify liquidity from Bitcoin, Ethereum, and Solana into a single execution environment. Its architecture features a Unified Liquidity Layer, Single-Step Execution, and a Deploy-Once model, enabling developers to access all three ecosystems without the need for chain-specific rebuilding.

    The project’s presale is currently priced at $0.01476, having raised $880,000 to date. For traders exploring a recovery thesis based on broader crypto sentiment, researching LiquidChain’s presale structure alongside larger-cap investments could prove worthwhile.