Tag: Market Trends

  • Solana FUD Surges to 2026 High: A Bullish Signal?

    Solana FUD Surges to 2026 High: A Bullish Signal?

    Solana’s recovery appears to be losing steam, having dropped more than 6% in the past week. Trading near $77, the cryptocurrency is currently experiencing its most negative market sentiment of 2026.

    According to data analytics firm Santiment, SOL’s trading volume has fallen to its lowest point this year, while negative commentary surrounding the asset has surged to its highest daily level.

    Much of the current disappointment stems from unmet expectations that strong narratives around tokenized stocks and real-world asset (RWA) activity would translate into more robust price performance. Traders have yet to witness this anticipated surge.

    Santiment noted that this combination of elevated fear, uncertainty, and doubt (FUD) alongside weak trading volume has historically created conditions conducive to a rebound. With retail participation low and sentiment deeply negative, there may be less resistance if large stakeholders decide to drive Solana’s prices higher. This scenario could potentially set the stage for a sharp move that catches traders off guard.

    The Solana network has seen significant user growth, adding 1.60 million new addresses over the past two weeks. Furthermore, the SuperTrend indicator on SOL’s three-day chart has flashed a new buy signal for the first time since October 10, 2025, when the Average True Range (ATR) trailing stop moved below the price. Analyst Ali Martinez pointed out that the previous SuperTrend sell signal was followed by a 74% price correction. He suggested that the latest signal indicates a bullish trend and could propel SOL towards the $100 mark.

    Michaël van de Poppe also observed that the crypto asset has re-entered its trading range and may experience a brief pullback before continuing its upward trajectory. He added that holding the $75-$77 range as support could pave the way for gains toward $100 and potentially $120 in the coming weeks or months.

    Another crypto analyst, Dami-Defi, highlighted a potential breakout scenario as SOL is currently testing the upper boundary of a descending channel that has been in place since September 2025. According to the analyst, a three-day close above $78 would confirm the breakout, opening the door to an initial move towards $105, followed by $125 and $155 if momentum persists.

    However, this bullish setup would be invalidated by a three-day close below $72, and stronger trading volume would be necessary to confirm any breakout.

  • Cardano (ADA) Price Outlook: AI Chatbots Offer Divergent Views Amidst Ecosystem Uncertainty

    Cardano (ADA) Price Outlook: AI Chatbots Offer Divergent Views Amidst Ecosystem Uncertainty

    Cardano’s native token (ADA) faces a spectrum of future price possibilities, with AI chatbots offering divergent outlooks for 2026 that highlight the difficulty in forecasting its trajectory amidst ecosystem challenges and founder’s cautionary remarks. While some AI models suggest potential for growth under specific market conditions, others point to persistent issues that could hinder ADA’s ascent.

    Recent market activity has seen ADA experience notable volatility. In June, the token’s price briefly fell below $0.14, a low not seen since 2020. By early July, ADA saw a recovery to approximately $0.20, and it is currently trading around $0.17. This price movement does not suggest a specific future direction.

    Three prominent AI chatbots – ChatGPT, Perplexity, and Gemini – have provided their analyses on ADA’s potential to reach the $1 mark by 2026, with each offering a distinct perspective and highlighting various conditional factors.

    According to ChatGPT, reaching $1 is a possibility, but it would require a strong bull market characterized by Bitcoin’s strength, altcoin rotation, ETF optimism, and demonstrable growth in Cardano’s decentralized finance (DeFi) and stablecoin sectors. ChatGPT suggested a more realistic recovery path would first involve reaching $0.30–$0.50, with $0.75–$1 becoming a serious target only if ADA clears that zone with significant volume. Conversely, if the broader market remains weak, ChatGPT indicated that ADA might struggle to even reclaim $0.30.

    Perplexity presented a similar view, arguing that a substantial price increase for ADA would necessitate the simultaneous occurrence of three key factors: overall market strength led by Bitcoin, a clear acceleration in the development and adoption of the Cardano ecosystem, and a general re-rating of large-cap altcoins. Perplexity’s most realistic scenario for ADA this year projects a maximum price of $0.80, with the token potentially spending parts of the year closer to the $0.30–$0.50 range, especially if catalysts such as CME futures, the Hydra scaling solution, and improved DeFi usage begin to gain traction.

    Gemini offered a more cautious outlook, stating that while an ascent to $1 for ADA in 2026 is mathematically possible, it is highly improbable. Gemini pointed to ongoing challenges within Cardano, including struggles with user growth, DeFi traction, and daily transaction volume when compared to competitors like Solana and Ethereum. The AI also referenced recent statements from Cardano’s founder, Charles Hoskinson, as posing hurdles to ADA’s price action. Gemini noted that Hoskinson’s candid communication style, while praised by supporters for its honesty, can introduce market uncertainty. The AI suggested that Cardano is navigating a difficult transitional phase, and Hoskinson’s public commentary may be amplifying these growing pains.

    These differing AI perspectives highlight the inherent uncertainty in cryptocurrency price forecasting. Charles Hoskinson himself recently contributed to this uncertainty by announcing he is taking a break and warning of an upcoming ‘wave of failures in the ecosystem.’ This statement, coupled with the observed ecosystem challenges, suggests that ADA’s future price performance is contingent on overcoming significant internal hurdles, in addition to broader market dynamics.

    Ultimately, the AI analyses underscore that ADA’s potential to reach ambitious price targets like $1 is heavily dependent on a confluence of positive market conditions and substantial internal ecosystem development. Investors and market observers are advised to critically evaluate these AI-generated predictions, considering the conditional factors and persistent challenges that influence Cardano’s outlook.

    Why This Matters

    The materials describe a narrow update: Three AI chatbots (ChatGPT, Perplexity, and Gemini) were consulted regarding the potential for Cardano’s native token (ADA) to reach $1 by 2026. Whether ADA can reclaim $1 by the end of the year (current year).

    Broader Context

    Source materials place the market analysis in this context: June was not kind to Cardano’s native token, whose price briefly crashed below $0.14, marking the lowest point since 2020.

  • XRP Tests $1 Support Amidst Declining Volume and Mixed Technical Signals

    XRP Tests $1 Support Amidst Declining Volume and Mixed Technical Signals

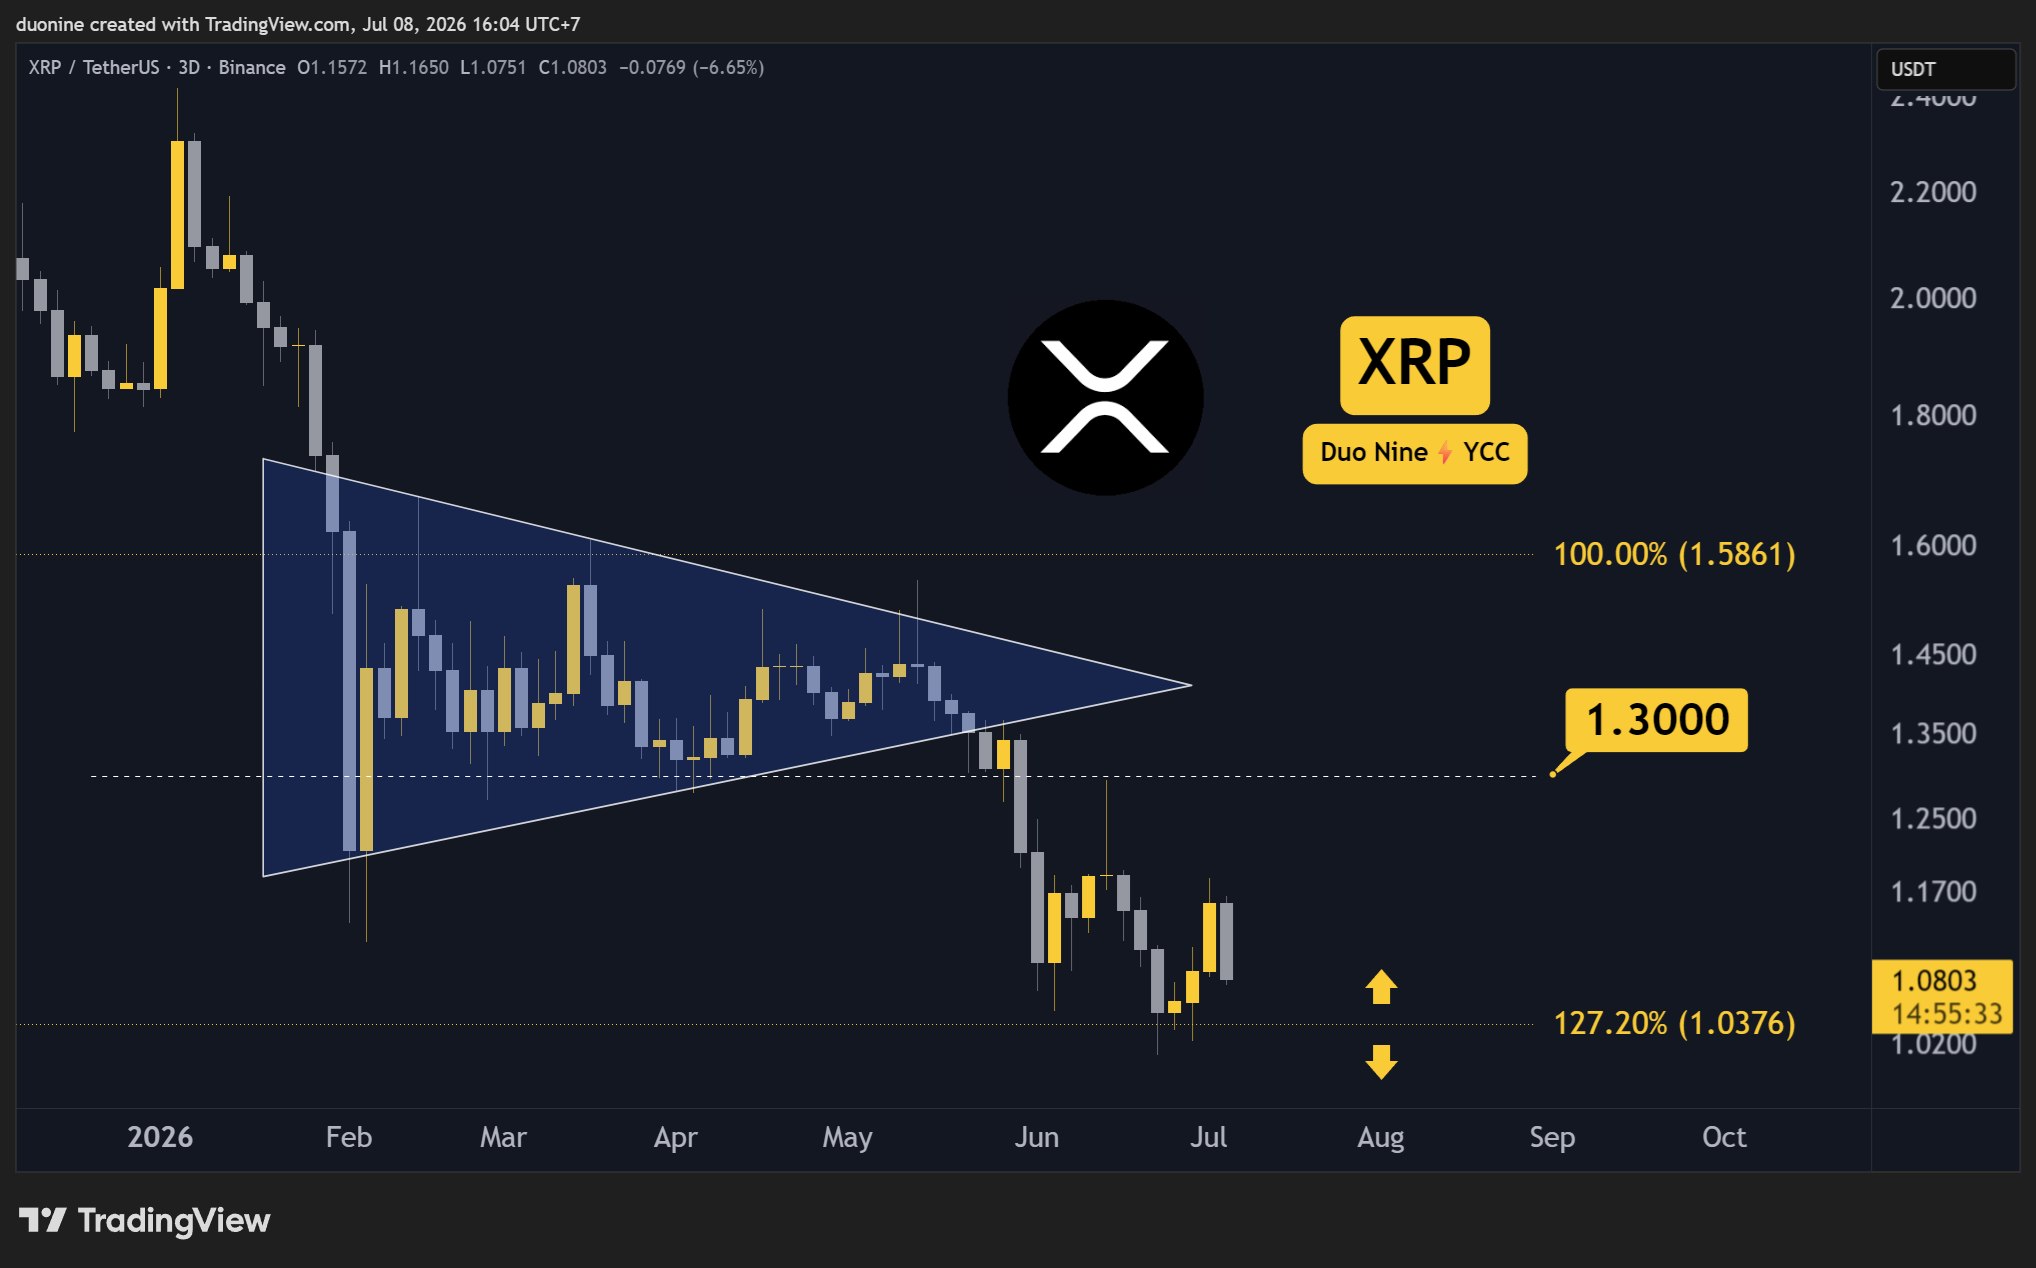
    XRP’s price is currently testing the critical $1 support level, a key psychological and technical juncture. However, the market’s conviction remains unclear, with declining trading volume and mixed technical indicators painting an ambiguous picture of XRP’s immediate future.

    Why This Matters

    The materials describe a narrow update: XRP’s price has fallen back to test the $1 support level after a brief rally. Whether the $1 support level can halt the decline.

    Broader Context

    Source materials place the market analysis in this context: XRP’s price has approached $1 in recent weeks, and now the key question is whether that level can halt the decline.

    The $1 Crossroads

    XRP’s price action this week has seen it fall back towards the $1 mark after a brief rally that reached approximately $1.18. Sellers have re-entered the market, and the asset is once again probing this significant support level. This follows a period in late June where XRP hovered above $1 for several days before buyers managed to push the price higher. The current situation raises questions about whether this level can halt the ongoing decline or if it represents a temporary pause before further losses.

    Volume and Conviction: A Fading Signal?

    A notable observation in the current market environment is the declining trading volume. Despite sellers appearing to be in control, the decrease in volume suggests a lack of strong conviction from either side. According to CryptoPotato, this could indicate that buyers are waiting for a more opportune moment to re-enter the market, rather than a definitive capitulation. This lack of conviction makes it difficult to ascertain the true strength of the selling pressure.

    Technical Indicators: Conflicting Narratives

    Technical indicators are also presenting a mixed narrative. The Relative Strength Index (RSI) on the daily timeframe has shown conflicting signals. This summer, the RSI made two attempts to move beyond the 50 level, a threshold often seen as a dividing line between bullish and recent price movement. However, on both occasions, the price experienced a full reversal, erasing any initial optimism. This pattern can be interpreted as bearish, as it suggests that attempts to gain recent price movement have been thwarted.

    Conversely, the RSI is currently exhibiting higher lows and higher highs. While this is generally considered an encouraging sign and could point to a developing bullish divergence, it remains unconfirmed. The analysis emphasizes that unless the price action mirrors these higher lows and highs, the divergence will not be validated, leaving its potential impact on the trend uncertain.

    Contextualizing the Support Level

    The overall trend for XRP remains bearish, a factor that weighs heavily on current price action. The collapse of buy pressure as soon as the price touched $1.18, paving the way for sellers to regain control, underscores this prevailing sentiment. The possibility that the current price action could be a ‘dead cat bounce’ before reaching new lows cannot be dismissed given the bearish trend.

    Key support for XRP is identified at $1, with resistance levels noted at $1.3, $1.6, and $2. The market is watching closely to see if the $1 support can hold. The absence of buyers from the order book since last Sunday further adds to the uncertainty surrounding XRP’s immediate price direction. The situation highlights a period of indecision, where the prevailing bearish trend is being challenged by subtle, unconfirmed bullish signals within technical indicators, all against a backdrop of waning trading volume.

  • Altcoins Near All-Time Lows Amidst Market Underperformance and Low Liquidity

    Altcoins Near All-Time Lows Amidst Market Underperformance and Low Liquidity

    A significant portion of altcoins are currently trading near their all-time lows (ATL), reflecting widespread market underperformance. This situation is compounded by low liquidity, a challenge that is expected to lead to a high failure rate for many projects in the cryptocurrency space.

    Current Altcoin Market Snapshot
    According to a report from market analysis platform CryptoQuant, approximately 40% of altcoins are trading around their ATL. This dynamic highlights an extreme level of underperformance among most projects. The situation has been particularly challenging when Bitcoin (BTC) has struggled to maintain its price above the $60,000 mark. For instance, when BTC fell below this threshold last month, the percentage of altcoins near their ATL climbed to 45%.

    The Liquidity Squeeze
    CryptoQuant analyst Darkfost noted that the extreme underperformance of altcoins reflects the harsh reality for projects that have launched tokens. He explained that his Percentage of Altcoins Near ATL chart, initially designed to visualize coins trading below 25% of their all-time low, now shows a substantial number of assets near their respective bottoms. Darkfost indicated that as the bear season progresses and BTC experiences further declines, altcoins’ performance is likely to worsen.

    A major contributing factor to this underperformance is the low liquidity in the market, despite a high volume of new cryptocurrencies being introduced daily. Data from CoinMarketCap indicates that there are currently 53.5 million cryptocurrencies in existence, with approximately 60,000 new ones added every day. The analyst suggested that without strong incoming liquidity, a majority of these cryptocurrencies are likely to fail.

    Analyst Insights and Market Realities
    These observations echo sentiments previously expressed by CryptoQuant founder Ki Young Ju in early December 2024. At that time, Ju commented on the good altcoin market sentiment but predicted that an altseason might not unfold as expected due to a lack of fresh liquidity entering the sector. He noted that the lack of liquidity hampered the growth of many assets. The current market conditions appear to have intensified this liquidity issue, leading to even poorer performance for most altcoins.

    Looking Ahead: Uncertainty and Selectivity
    Darkfost advised that investors should now be highly selective about the projects they choose to engage with. He believes the cryptocurrency market has evolved, and only a limited number of projects are likely to survive the current bear phase. The analyst’s comments underscore the uncertainties surrounding the future viability of many altcoin projects.

    While the exact number of altcoins trading below 25% of their all-time low remains uncertain, the current data points to a challenging environment. The precise impact of the growing lack of liquidity on the long-term survival of altcoin projects is also a subject of uncertainty. Furthermore, future performance and the possibility of a significant recovery for altcoins remain unclear. It is important to note that definitive statements about altcoins being guaranteed to recover, all new cryptocurrencies failing, or Bitcoin’s price definitively staying above or below $60,000 cannot be made based on the available information.

    Why This Matters

    The materials describe a narrow update: Approximately 40% of altcoins are trading near their all-time low (ATL), indicating extreme underperformance. The exact number of altcoins trading below 25% of their all-time low.

    Broader Context

    Source materials place the factual news in this context: The bear cycle is heavily affecting altcoins as expected.

  • Paradigm Launches $1.2 Billion Fund, Broadening Investments to AI and Robotics

    Paradigm Launches $1.2 Billion Fund, Broadening Investments to AI and Robotics

    Venture capital firm Paradigm has announced the launch of its fourth fund, a $1.2 billion vehicle that may expand its investment scope beyond cryptocurrency to include artificial intelligence, robotics, and other emerging technologies. This strategic expansion signals a shift in the firm’s approach to investing in rapidly evolving technological frontiers.

    Paradigm, founded in 2018 by Matt Huang and Coinbase co-founder Fred Ehrsam, has historically been a significant investor in the digital asset space. The firm previously raised a $2.5 billion crypto fund in 2021 and an $850 million early-stage blockchain fund in 2024. The latest $1.2 billion fund represents a diversification of its investment strategy, aiming to capture opportunities across a wider spectrum of cutting-edge fields.

    According to the firm, the expansion into AI and robotics reflects a belief in the convergence of these technologies with the crypto ecosystem. Paradigm stated that “sufficiently steep exponentials are indistinguishable from magic, and we see more global-scale exponentials at work than ever before.” The firm added that “this era favors those open-minded enough to throw out existing playbooks and recompute new views of reality frequently,” a mindset it shares with the founders it backs.

    The firm highlighted several investments that illustrate its evolving focus. In the realm of AI and autonomous hardware, Paradigm has invested in companies such as Zipline, an autonomous drone developer, and True Anomaly, a space defense startup. It also noted investments in Nous Research, the AI company behind Hermes Agent.

    On the crypto side, Paradigm pointed to its continued support for the digital asset ecosystem through investments in the decentralized exchange Hyperliquid, the prediction market platform Kalshi, and Tempo, a stablecoin-focused blockchain co-founded with Stripe. The firm also mentioned internal projects like Foundry and Reth, which are Ethereum development tools, the AI agent project Centaur, and EVMbench, a blockchain security benchmark developed in collaboration with OpenAI.

    The announcement comes as crypto companies are increasingly building infrastructure to support AI agents capable of executing financial transactions. Companies like Coinbase and Stripe have developed payment tools designed to enable AI agents to utilize wallets and stablecoins for completing tasks with minimal human intervention.

    Paradigm’s broadened investment mandate reflects a growing trend within venture capital, where firms are increasingly looking at the intersections of various advanced technologies. The firm’s approach emphasizes staying close to the technology, conducting research, and building alongside founders, a strategy it aims to continue with its new fund.

    Why This Matters

    The materials describe a narrow update: Paradigm, a crypto venture firm, has launched its fourth fund totaling $1. Paradigm is broadening its investment focus beyond digital assets to include AI, robotics, and other emerging technologies.

    Broader Context

    Source materials place the factual news in this context: Paradigm’s fourth fund will expand investments into AI, autonomous hardware, and other emerging technologies while continuing its research-driven approach.

  • Bitcoin and Ethereum Face Conflicting Signals Amidst Market Downturn

    Bitcoin and Ethereum Face Conflicting Signals Amidst Market Downturn

    The cryptocurrency market is navigating a complex period in early July, with both Bitcoin and Ethereum experiencing significant price downturns. While technical indicators are flashing bearish signals, a confluence of historical patterns, contrarian sentiment indicators, and evolving market structures introduces considerable uncertainty about the potential for a market bottom.

    Bearish Technicals Signal Continued Downturn

    The prevailing mood in the crypto market is one of caution, bordering on fear. Bitcoin has recently touched 21-month lows, briefly dipping below $58,000. As of this week, it is trading around $61,749, down approximately 2.89% for the week. The $64,000–$65,000 range has proven to be a significant resistance ceiling since early June, a level Bitcoin has struggled to overcome. Prediction markets, such as Myriad, reflect this bearish sentiment, with traders placing nearly 73% odds that Bitcoin may reach $55,000 before it hits $84,000. This sentiment flipped from bullish to bearish around June 2.

    Technically, Bitcoin’s Average Directional Index (ADX) stands at 30.7, indicating a strong existing trend with bearish directionality reported. The Relative Strength Index (RSI) is at 36.8, suggesting the asset is approaching oversold conditions, though not yet there. While Bitcoin’s 50-week exponential moving average (EMA) remains above its 200-week EMA, forming a technical golden cross, this pattern is narrowing, raising concerns about a potential future death cross, which historically precedes deeper declines.

    Ethereum is also under pressure, trading below $1,750 and down around 4% on the day, with a year-to-date decrease exceeding 30%. The most significant bearish development for Ethereum is the confirmation of a weekly death cross, where its 50-week EMA has fallen below its 200-week EMA. This pattern, which has been present on Ethereum’s daily chart since November 2025, signifies a prolonged structural deterioration and tends to define entire market phases rather than short-term moves. Traders on Myriad are pricing in a 72% chance that Ethereum may reach $1,500 before $3,000. Ethereum’s ADX is at 26.5 with bearish directionality, and its RSI is at 36.9, mirroring Bitcoin’s bearish but not yet oversold status.

    Potential Bottoming Signals and Evolving Market Dynamics

    Despite these bearish technicals, several factors introduce a degree of uncertainty and potential for a market bottom. The Fear & Greed Index currently sits at 23, indicating “extreme fear,” a level that has historically served as a contrarian signal, often preceding market reversals.

    Furthermore, Spot Bitcoin ETFs have recently seen a significant inflow of $221.7 million on July 2, snapping a 10-day, $2.7 billion outflow streak. Since then, these ETFs have attracted approximately $510 million. Similarly, ETH spot ETFs experienced positive inflows of $29.1 million on July 2.

    On-chain data from Glassnode suggests that long-term Bitcoin holders are returning to accumulation. Historically, major Bitcoin bear cycles have concluded with periods of extreme fear and flush-out events, often followed by a pre-halving compression phase before the next upward trend. With the next Bitcoin halving roughly 21 months away, some analysts suggest that accumulation phases may be becoming relevant.

    However, the current market environment differs from previous cycles due to increased institutional involvement. The presence of spot Bitcoin ETFs, formal accounting standards, and a developing legislative framework for digital assets indicate a fundamentally altered landscape. While this doesn’t eliminate volatility, it suggests that the players and dynamics within this bear market may be distinct.

    Analysts at Citi have offered cautious forecasts, downgrading their 12-month Bitcoin forecast to $82,000 with a bear case at $53,000. For Ethereum, Citi’s bear case is set at $1,094. The technical Fibonacci target for Bitcoin below current prices is $57,735, while for Ethereum, it is $1,500.

    Navigating Uncertainty

    Ultimately, the market presents a dichotomy: strong bearish technical signals for both Bitcoin and Ethereum are countered by historical contrarian indicators and the evolving institutional landscape. The confirmation of Ethereum’s weekly death cross and Bitcoin’s struggle at resistance levels point towards potential further declines. Yet, the extreme fear readings, recent ETF inflows, and the fundamental shifts in market structure introduce significant uncertainty. Whether these factors will accelerate or delay a market bottom remains an open question, with evidence suggesting that definitive conclusions cannot yet be drawn.

    Why This Matters

    The materials describe a narrow update: Bitcoin has fallen to 21-month lows and is struggling to break resistance zones, while Ethereum has reported a weekly death cross, indicating a significant bearish trend. Whether the current market players and institutional involvement will speed up or delay the market bottom.

    Broader Context

    Source materials place the market analysis in this context: The crypto market enters the second week of July in rough shape.


  • Bitcoin ETFs See Inflows After Record Outflows, Uncertainty Remains

    Bitcoin ETFs See Inflows After Record Outflows, Uncertainty Remains

    Bitcoin exchange-traded funds (ETFs) have experienced three consecutive days of net inflows, following an eight-week period of record outflows totaling $8 billion. These recent inflows, amounting to approximately $510 million since Friday, may reflect changing conditions in investor sentiment, though the sustainability of this trend remains uncertain.

    The preceding eight-week slump saw Bitcoin ETFs shed $8 billion, representing 8% of their assets under management. This outflow level is comparable to activity observed during cycle lows in 2018. Year-to-date outflows for these funds have now reached $2.8 billion. While the duration of the recent outflows set a record, their intensity has not matched the peak daily net outflows seen last year, which reached $733 million, according to CoinGlass.

    Adding to the complexity, data indicates that many investors who allocated to Bitcoin ETFs during the recent surge are currently underwater. The average cost basis for these investors is around $83,800, meaning most acquired Bitcoin at a price significantly higher than its current trading value. On Wednesday, Bitcoin was trading around $62,000, a 4% increase over the past week according to CoinGecko, but down from a high of $126,000 in October. Earlier this month, Bitcoin fell as low as $58,000.

    Further downward price pressure has come from large holders, or whales, who have sold over $40 billion worth of Bitcoin since its price peaked last year. This outflow trend from ETFs is also being compared to a similar drawdown last February, which saw investors withdraw $5.2 billion.

    The sustainability of the recent inflows remains a key uncertainty. Market observers suggest that expectations of tighter monetary policy in the U.S., as the Federal Reserve continues to combat inflation, could limit Bitcoin’s ability to break out of its current trading range. Geopolitical tensions in the Middle East also add a layer of complexity, as Bitcoin’s price remains sensitive to inflation outlooks influenced by such events.

    While the recent inflows may indicate a notable activity, the prevailing macroeconomic conditions and the current underwater position of many ETF investors introduce significant uncertainty about the future trajectory of Bitcoin ETF flows and the broader digital asset market. Whether these inflows represent a sustained trend reversal or a temporary pause in outflows is yet to be determined.

    Why This Matters

    The materials describe a narrow update: Bitcoin ETFs experienced an $8 billion outflow over an eight-week period, marking a record slump. Whether the current inflows represent a sustained trend or a temporary rebound.

    Broader Context

    Source materials place the factual news in this context: Despite their overwhelming popularity in recent years, Bitcoin ETFs have shed $8 billion over the past eight weeks, with investors seeking shelter as the digital asset plunged to a 21-month low.

  • XRP Price: Critical Level to Defend Against Breakdown

    XRP Price: Critical Level to Defend Against Breakdown

    XRP Faces Persistent Selling Pressure, Key Support Level Under Scrutiny

    XRP is currently experiencing sustained downward pressure against both Tether (USDT) and Bitcoin (BTC). Despite intermittent attempts at recovery, sellers continue to dictate the prevailing trend. While the USDT chart indicates buyers are actively defending a crucial support zone, the XRP/BTC pair is trading near multi-month lows, underscoring XRP’s ongoing relative weakness compared to the market leader.

    Technical Outlook for XRP/USDT

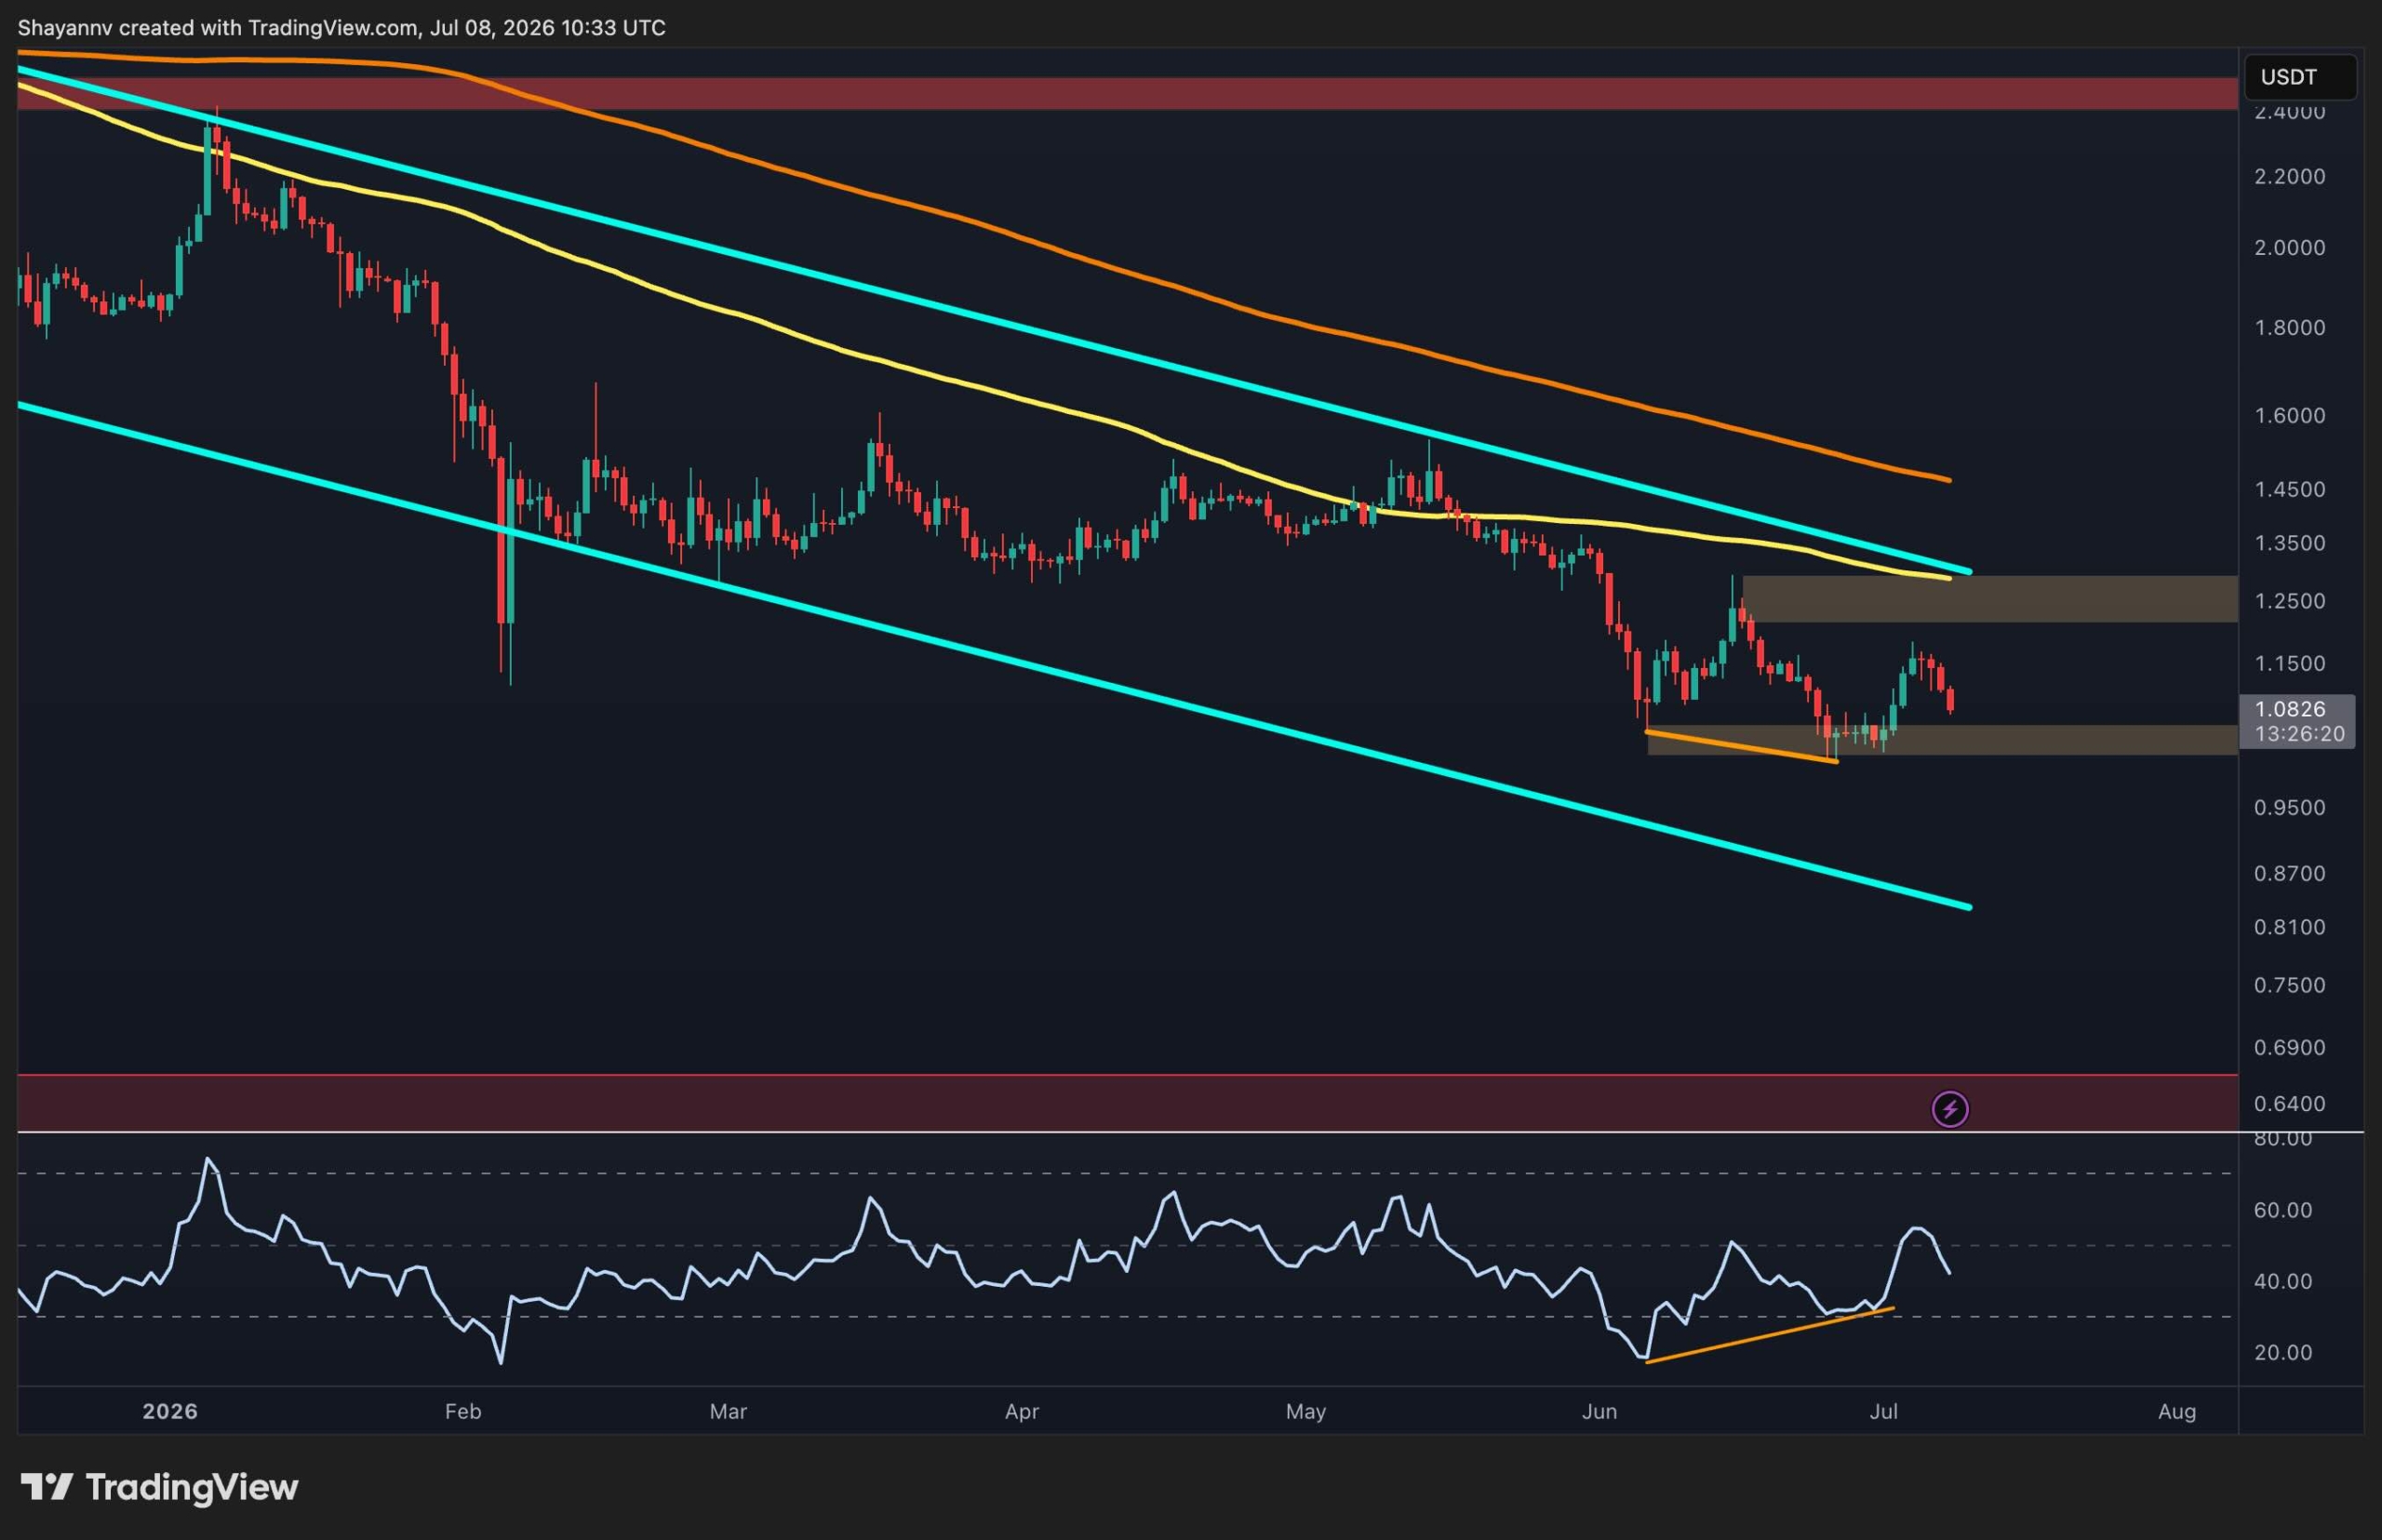
    On the daily chart, XRP remains confined within a clearly defined descending channel, signaling a firmly bearish market structure. The cryptocurrency is trading below both its 100-day and 200-day moving averages, which are both trending downwards and acting as dynamic resistance points above $1.25. This technical alignment suggests that seller momentum is still dominant, and a significant trend reversal would be required to shift the balance.

    Following the loss of the $1.25 level in early June, XRP found demand around the critical $1 mark. This region has repeatedly seen buyers step in to halt further declines and has now emerged as the most important support level to monitor. As long as this $1 support holds, the market may continue to establish a short-term base.

    On the upside, the immediate significant resistance is located around $1.25. This area coincides with the descending 100-day moving average and the upper boundary of the channel, presenting a substantial obstacle for any sustained recovery. A successful breach above this level would then target the 200-day moving average near $1.45. Conversely, a failure to hold the $1 support could trigger another downward move, potentially testing the channel’s lower trendline around $0.80.

    Meanwhile, the Relative Strength Index (RSI) has been printing higher lows, even as the price has made lower lows near $1. This developing bullish divergence suggests that bearish momentum may be waning, and buyers could initiate another recovery attempt if resistance levels begin to falter.

    XRP/BTC Pair Shows Continued Weakness

    Against Bitcoin, XRP’s technical picture remains weaker. The pair is trading below both major moving averages, which are continuing their downward trajectory and reinforcing the long-term bearish structure.

    After several weeks of range-bound trading, XRP/BTC is once again testing key horizontal support at approximately 1,700 satoshis. This level has served as the floor for recent consolidation, and another breakdown attempt is currently underway. A confirmed daily close below 1,700 satoshis would likely invalidate the current trading range and increase the likelihood of a decline toward the next significant demand zone, situated between 1,450 and 1,500 satoshis.

    To regain bullish momentum, buyers must first reclaim the 1,850 satoshis resistance area, which also aligns closely with the declining 100-day moving average. Until this resistance is overcome, rallies are likely to be viewed as corrective within the broader downtrend, potentially leading to further depreciation of XRP against Bitcoin.

  • Hedge Funds Bet Heavily Against Yen; XRP Eyes $2.00 Amid Japan Shift

    Hedge Funds Bet Heavily Against Yen; XRP Eyes $2.00 Amid Japan Shift

    XRP Trades Near $1.07 Amid Yen Weakness and Japanese Investor Interest

    XRP is currently trading around $1.07, marking a roughly 3% decline over the past 24 hours. Despite this dip, the digital asset maintains a weekly gain of 6-7%, suggesting its broader upward trend remains intact.

    The key question for traders is whether sustained demand from Japan, driven by the weakening yen, will fuel further gains, or if the current consolidation signals a pause before a more significant correction. Hedge funds have adopted their most bearish stance on the yen since 2007, with short positions reaching nearly 138,000 contracts as of June 30, according to Commodity Futures Trading Commission (CFTC) data.

    This significant shift in currency markets represents a structural foreign exchange dislocation that historically prompts Japanese retail investors to seek refuge in hard assets and cryptocurrencies. In contrast, Bitcoin is consolidating in the mid-$60,000 range, down approximately 0.6% on the day but up over 6% for the week. Bitcoin has shown resilience against macroeconomic pressures that have significantly impacted Korean equities, with the Kospi index shedding about 20% from its recent peak.

    The current volatility across foreign exchange and equity markets is palpable. XRP, with its established positioning in cross-border payments, stands to benefit directly should the yen’s slide accelerate and Japanese exchange volumes surge in response.

    XRP’s Technical Landscape

    At $1.07, XRP occupies a technically challenging position. It hovers above the psychologically significant $1.00 level, which short-term traders view as strong support, but remains well below the previous resistance band near $2.00 that capped its last major rally.

    The 3% single-day drop is noteworthy, indicating active selling pressure at current price levels rather than a mere absence of buyers. Volume data suggests strategic positioning rather than panic-driven liquidations.

    The Bull Case: Japanese Retail Re-engagement

    The optimistic outlook for XRP hinges on renewed engagement from Japanese retail investors. XRP has historically enjoyed substantial popularity on Japanese exchanges. The current multi-decade lows for the yen provide domestic holders with a compelling incentive to reallocate funds into crypto-denominated assets.

    This catalyst could accelerate if the Bank of Japan signals further tolerance for yen weakness or delays intervention. On-chain data already indicates growing institutional interest. The base scenario anticipates a period of range-bound trading between $1.00 and $1.50 as macroeconomic conditions evolve.

    The Bear Case: Potential Breakdown

    The bearish argument is more straightforward. A decisive break below $2.03 could trigger a move towards $1.91 on any subsequent recovery attempt, marking a point where the near-term bullish thesis would be invalidated.

    Analysis based on the Market Value to Realized Value (MVRV) ratio suggests XRP is not yet in overheated territory. While this limits the potential for panic selling, it does not guarantee that current support levels will hold. Should the $1.00 floor falter, the next significant support level lies considerably lower.

    Market participants are advised to monitor the Bank of Japan’s policy decisions and the flow of partnerships from Ripple. While the underlying conditions for a potential rally are present, definitive confirmation is still pending.

    Infrastructure Plays: LiquidChain

    While XRP’s appeal is linked to foreign exchange dynamics, its current price point positions it as a recovery trade rather than an early-entry opportunity for those seeking asymmetric exposure to cross-border liquidity trends. Investors looking for such opportunities at a different risk profile are exploring infrastructure projects.

    LiquidChain is one such project gaining traction among analysts tracking Layer 3 development. The project aims to create an execution environment that unifies liquidity from Bitcoin, Ethereum, and Solana into a single layer. It promises unified liquidity, single-step execution, and a deploy-once architecture designed to address the fragmentation issues that developers find problematic.

    The LiquidChain presale has reportedly raised $889,886.53, with the current token price at $0.01477. This represents significant traction for a pre-launch infrastructure token.

    Key differentiators for LiquidChain include its Unified Liquidity Layer and Verifiable Settlement features. If the cross-chain thesis proves successful, the project’s value accrual potential is substantial.

    However, presale tokens inherently carry execution risk, and the absence of a live mainnet means proof of concept is yet to be demonstrated. Investors interested in the infrastructure angle are encouraged to research LiquidChain before its next price tier concludes.

  • Cardano Whale Selling Activity Creates Market Uncertainty, Technicals Point to Bearish Outlook

    Cardano Whale Selling Activity Creates Market Uncertainty, Technicals Point to Bearish Outlook

    Cardano’s recent on-chain data, revealing significant selling activity from whale wallets, presents an ambiguous picture of market direction rather than a clear indicator of future price movements. While substantial token outflows have been observed, the interpretation of these actions and their potential impact on ADA’s price remains subject to considerable uncertainty.

    Whale Distribution Continues Amidst Price Decline

    Per Santiment Supply Distribution data, whale wallets holding between 100,000 and 100 million ADA have sold approximately 190 million tokens since July 1. This selling pressure has coincided with a price decrease, with Cardano’s ADA reaching $0.172 on July 8 and experiencing a four-day losing streak. This pattern echoes a similar offloading event in early June, when approximately 260 million ADA were sold by comparable whale cohorts. The current setup is directionally consistent with that of the prior cycle, but it is not yet at peak pessimism by that metric alone, per FXStreet’s technical analysis.

    Bearish Sentiment on Derivatives Markets

    Derivatives data from CoinGlass corroborates the bearish sentiment. The funding rate for ADA has flipped negative, printing at -0.0060% on an OI-weighted basis. This indicates that short-sellers are paying long-position holders, reflecting a market consensus that the price is likely to move lower. Furthermore, the long-to-short ratio stands at 0.79, suggesting more traders are positioned short than long. Crucially, these shorts are not being squeezed out; they are being paid to hold, which removes a common catalyst for a short-term bounce.

    Technical Indicators Signal selling pressure

    Technically, ADA’s structure is uniformly bearish. The 50-day Exponential Moving Average (EMA) is at $0.185, the 100-day EMA at $0.216, and the 200-day EMA at $0.289. All these key moving averages sit above the current ADA price and are acting as overhead supply. The most recent price recovery attempt was capped by the 32.82% Fibonacci retracement at $0.195, confirming that sellers are active at each recovery attempt. Immediate resistance clusters at $0.173, which corresponds to the 23.6% Fibonacci retracement. ADA is currently testing this level from below. Above $0.173, the 50-day EMA at $0.185 and the 38.2% retracement at $0.195 form the next meaningful supply zone, followed by a wider band between $0.213–$0.217 where the 50% retracement, the 100-day EMA, and a broken descending trendline converge.

    On the downside, initial support sits at the psychological floor of $0.150. A clean break below this level could open the path to the Fibonacci cycle low at $0.138, which is identified as the primary price forecast target for the bearish scenario. However, the question remains whether the current distribution cycle is approaching exhaustion or still has room to run toward this target.

    While momentum indicators like the MACD have turned positive and the Relative Strength Index (RSI) is hovering near 50, their significance is diminished by the broader bearish trend structure. The negative funding rate and the fact that shorts are not being squeezed out further suggest that the bearish path is the more technically supported of the two at present. If whale offloading continues and the $0.173 resistance holds, ADA could test $0.150 within the current weekly range. A failure at this support level, particularly if accompanied by further deterioration in the funding rate or long-to-short ratio, would set up a move toward the $0.138 Fibonacci cycle low.

    Potential Bullish Pivot and Broader Market Context

    The bull case requires a specific sequence: whale distribution must exhaust, the cohorts tracked by Santiment must flip from selling to accumulation, and ADA must reclaim $0.173 on meaningful volume. While this scenario is not impossible, as prior cycles have seen similar whale cohorts pivot from offloading to accumulation at depressed levels, the current derivatives data does not yet signal that rotation is underway. The structural setup for Cardano mirrors the broader dynamic affecting much of the altcoin market, where technically complex assets are being weighed down by macro-driven risk-off positioning, a dynamic also observed in the Bitcoin technical outlook for 2026.

    Until on-chain data shows whale behavior shifting decisively, the $0.138 target remains the more credible near-term outcome, though significant uncertainty persists regarding the exact trajectory and timing of any potential price movements.