Tag: Market Trends

  • XRP Dips to 10-Day Low Amid Fading Whale Demand and ETF Outflows

    XRP Dips to 10-Day Low Amid Fading Whale Demand and ETF Outflows

    Crypto Market Dips Amid Middle East Tensions, XRP Faces Headwinds

    The cryptocurrency market has experienced another downturn, a move largely anticipated in the wake of escalating tensions in the Middle East. Ripple’s cross-border token, XRP, has not been immune to this broader market correction.

    While the immediate outlook for XRP appears challenging, on-chain data offers glimmers of optimism on a larger, macroeconomic scale.

    Price Volatility and Recent Slump

    At the beginning of the month, XRP’s price fell to $1.01, a level not seen in nearly two years, amidst a widespread market crash. The token saw a swift rebound in the subsequent days, even testing the $1.20 resistance. However, it was pushed back down, dipping below $1.10 within days.

    The past week has been relatively subdued, with XRP trading sideways between $1.09 and $1.12. This stability was disrupted on Monday morning as the market reacted to renewed attacks between the United States and Iran. XRP subsequently slipped to just under $1.07, its lowest point since the earlier monthly low.

    Factors Contributing to XRP’s Retreat

    Beyond the general market weakness, a potential contributor to XRP’s recent decline is activity surrounding Exchange-Traded Funds (ETFs). After nine consecutive weeks of net inflows, this trend was broken last week, with over $7 million exiting these funds.

    Further analysis from on-chain data providers Santiment and Ali Martinez indicates a significant cooling in whale activity on the XRP Ledger. The number of large transactions, exceeding $1 million, has plummeted from 70 to a mere 2 within approximately a week.

    Santiment had previously observed that XRP Ledger activity had become “unusually quiet,” with the creation of new wallets reaching its lowest point in nearly two years.

    Analyst Perspectives on XRP’s Future

    CRYPTOWZRD commented on XRP’s recent price movements, noting that the token closed “indecisively.” The analyst anticipates potential “further upside” if XRP can regain traction against Bitcoin, a scenario that has not materialized for an extended period.

    In contrast, EGRAG CRYPTO maintains a strongly bullish long-term outlook for XRP. In a recent post on X, EGRAG suggested that historical patterns may be repeating for XRP, citing several indicators that point to a potential macro bottom.

    “The macro bottom may already be behind us,” EGRAG stated. “Now we need a bounce toward the 50-MA (about $1.60), a healthy rejection, a retest of the 618 (0.5 Fibonacci zone), and that retest will become the make-or-break accumulation zone before the next impulsive move higher. In my view, this would complete a double-bottom lower low and set the foundation for the next macro rally for XRP.”

    EGRAG outlined ambitious targets for this potential long-term rally, with some extreme projections reaching as high as $31. More conservative estimates include targets of $15, $9, and a range of $5-$6.50.

  • GhostSwap’s Non-Custodial Swap Service: Privacy Focus Meets Third-Party Compliance

    GhostSwap’s Non-Custodial Swap Service: Privacy Focus Meets Third-Party Compliance

    GhostSwap operates a non-custodial instant swap platform supporting over 1,600 cryptocurrencies, prioritizing user privacy and simplicity by foregoing account creation and Know Your Customer (KYC) verification. This approach positions GhostSwap as an alternative to traditional cryptocurrency exchanges, which often require extensive onboarding processes.

    According to GhostSwap, the swap process is designed for ease of use. Users select their desired cryptocurrency pair, provide a destination address for the swapped assets, and then send their source cryptocurrency to a temporary deposit address provided by the platform. GhostSwap states that the swapped coins are typically received at the destination address within 5 to 30 minutes, with completion times influenced by network congestion. The platform aggregates liquidity from multiple sources to secure competitive rates and facilitates cross-chain swaps, enabling exchanges between assets on different blockchains.

    GhostSwap’s extensive token support includes major cryptocurrencies like Bitcoin, Ethereum, Solana, and Polygon, alongside privacy-focused coins such as Monero (XMR) and Zcash (ZEC). The company highlights this support for privacy coins as a key differentiator, particularly as many other platforms have delisted such assets due to regulatory pressures. GhostSwap claims to have facilitated over $750 million in swaps for approximately 1.5 million users.

    The platform charges a flat 2.0% baseline fee on each swap, which is incorporated into the quoted exchange rate. Standard blockchain network fees, commonly known as gas fees, are additional and borne by the user. While GhostSwap’s 2% fee is higher than some competitors—such as Changelly (around 0.25%), Godex (approximately 0.5%), and FixedFloat (1% for fixed-rate, 0.5% for floating-rate swaps)—the company emphasizes the simplicity of its fee structure. GhostSwap offers a single, transparent rate without tiers or hidden charges, appealing to users who value upfront cost clarity.

    Despite its “no KYC” policy, GhostSwap states that it collaborates with licensed crypto processing partners to perform Anti-Money Laundering (AML) and sanctions screening. GhostSwap warns that each transaction may be shared with these partners for automated checks, and that transactions could be flagged, blocked, rejected, or refunded if they do not meet compliance requirements. The platform’s terms of use indicate that transactions may be subject to AML/KYC compliance by these licensed third parties, and in some instances, additional information might be requested.

    Users bear the responsibility for ensuring they send the correct cryptocurrency to the correct address and on the correct network. GhostSwap warns that sending a coin to an address on the wrong network or mistyping an address can lead to the permanent loss of funds. The company advises users to meticulously double-check all transaction details before confirmation and suggests conducting small test swaps for larger amounts to verify the process.

    GhostSwap also provides a Telegram bot, launched in 2025, which enables users to execute swaps directly within the messaging application. Furthermore, a server-to-server API is available for business integrations, featuring rate limits of up to 120 requests per second per IP and 30 requests per second per API key.

    Emphasizing its non-custodial nature, GhostSwap asserts that it never takes long-term control of user assets. Funds are routed directly from the user’s wallet to the intended destination wallet, and the platform never requests private keys. Uncertainties persist regarding the platform’s exact operational start date prior to the Telegram bot’s launch, specific details about the third-party compliance partners, and the precise criteria used for flagging transactions.

    Why This Matters

    GhostSwap provides a platform for users to swap cryptocurrencies without creating an account or undergoing KYC verification. The exact operational start date of GhostSwap prior to the Telegram bot launch in 2025.

    Broader Context

    Traditional crypto exchanges require extensive onboarding processes (account creation, email verification, KYC, 2FA) that can take days. GhostSwap’s model offers an alternative for users prioritizing privacy and simplicity.

  • Gemini AI Forecasts Solana Price for Next 90 Days

    Gemini AI Forecasts Solana Price for Next 90 Days

    Gemini AI Projects $100-$115 Solana Price Target in 90 Days

    Google’s Gemini AI has presented a contrarian outlook for Solana (SOL), suggesting a significant price surge within the next 90 days. The model posits that the current market sentiment, characterized by widespread reluctance to invest in Solana, represents a classic contrarian buying opportunity. Gemini forecasts a price range of $100 to $115, driven by a shift from retail capitulation to institutional accumulation and a potential short squeeze.

    Network Activity Diverges from Price

    The bullish case for Solana, according to Gemini, is rooted in a divergence between its network activity and current price. Despite trading around $79, the prediction highlights that June 2026 marked the busiest month in Solana’s history, processing a record 4 billion transactions. This robust network activity, coupled with stablecoin supply remaining above $16 billion and annualized application revenue pacing at $1.8 billion, suggests a growing underlying economy that the AI deems unsustainable in the face of current price stagnation. Gemini characterizes this decoupling as a “coiled spring,” anticipating a swift and forceful resolution once market sentiment shifts.

    Factors Driving the Bullish Forecast

    The projected 90-day target of $100 to $115 is attributed to several factors: the conclusion of retail capitulation, increased institutional investment filling the void, and the forced closure of crowded short positions in a thinly traded market.

    Bearish Scenario and Support Levels

    While predominantly bullish, Gemini acknowledges a narrower bearish scenario. If liquidity remains scarce and prolonged trader frustration leads to a final market washout, the model anticipates a temporary floor test around $70 to $73. However, even this downside is framed as a floor test rather than a sustained downturn, implying an eventual upward resolution.

    Technical Analysis and Recent Performance

    Solana is currently trading at approximately $79.32, having recovered sharply from a mid-June low of around $62. Over the past three weeks, SOL has gained over 28% from this bottom. This recovery is noted as the most sustained and directional since October highs, characterized by consistent upward price action. Today’s trading saw SOL up 1.71%, reaching intraday highs of $79.60, placing it above the $70-$73 bearish support zone and approaching the $80 level.

    Resistance and Support Zones

    Immediate resistance is identified at $90, a level that previously capped rallies in February and March. A more significant ceiling is observed near $100, which served as the upper boundary of the consolidation range for several months earlier this year. This $100 level aligns with the lower end of Gemini’s 90-day bullish target. Support is firm at $70, the recent cycle low and the upper limit of the bearish floor zone, with $62 representing the absolute recent low should this level falter.

    Technical Reversal Potential

    While the broader chart pattern still indicates lower highs since September, suggesting no confirmed technical reversal yet, the current recovery’s character is described as qualitatively different from previous attempts. Increased volume, consistency, and momentum support the bounce. A sustained push and hold above $90 in the coming weeks would strengthen the short squeeze scenario outlined by Gemini.

    Contrasting with Large-Cap Cryptocurrencies

    The analysis contrasts Solana’s potential with the stagnation observed in major cryptocurrencies like Bitcoin, Ethereum, and XRP, which are reportedly testing similar resistance levels without significant breakthroughs. The article suggests that waiting for macro catalysts or institutional waves in these large-cap assets may not be a viable trading strategy.

    Opportunity in Infrastructure Plays

    The piece highlights that smaller market cap infrastructure projects operate under different dynamics, with the potential for significant repricing once discovered. The opportunity is framed as existing in the gap between a project’s intrinsic value and its current market valuation, a gap that closes upon discovery.

    Multi-Chain Fragmentation and LiquidChain

    The fragmentation of multi-chain ecosystems, where Bitcoin, Ethereum, and Solana operate as isolated systems, is identified as a costly problem in decentralized finance (DeFi) due to fees, slippage, and failed transactions when value crosses boundaries. LiquidChain is presented as a solution that aims to make these crossings free by integrating all three networks into a single execution environment, offering complete ecosystem access without transaction taxes.

    LiquidChain Presale

    The article mentions that LiquidChain’s presale is currently priced at $0.01454, having raised over $890,000, positioning it as an early and undiscovered opportunity.

  • Bitcoin Sees Early July Price Recovery Amidst Seasonality, but Market Uncertainty Remains

    Bitcoin Sees Early July Price Recovery Amidst Seasonality, but Market Uncertainty Remains

    Bitcoin (BTC) has experienced a price recovery in early July, moving from a recent low of $57,700 to approximately $64,000. This represents an 11% increase from its lows. Analysts attribute this movement to historical July seasonality and indications of recovering demand. However, broader market conditions remain predominantly bearish, as highlighted by key on-chain metrics.

    Historically, July has often been a favorable month for Bitcoin. Analysts noted that during previous bear cycles, such as in 2018 and 2022, Bitcoin concluded the month with significant surges of 20% and 17%, respectively. This historical pattern suggests that July’s positive seasonality could be contributing to the current recovery, potentially providing a tailwind even within a generally bearish market.

    Further supporting the recovery narrative are indications of improving demand. According to CryptoQuant, total Bitcoin demand has been recovering and is climbing back towards neutral levels after a sharp contraction in early June, when 30-day total demand metrics fell to -650,000 BTC. Speculative futures demand has turned slightly positive, while spot apparent demand is contracting at its slowest pace since mid-May. Analysts explained that a move back into positive territory for these metrics would suggest that the demand engine is re-igniting, though it has not yet reported a sustained shift.

    Investor demand in the United States also appears to be stabilizing. The Coinbase Premium Index, a measure of U.S. investor demand, has recovered from deeply negative readings to -0.062. This recovery is seen as a signal that selling pressure on U.S. trading platforms is easing and institutional appetite is stabilizing, aiding Bitcoin’s rebound from the $57,700 level.

    Despite these developments, the overall market sentiment remains bearish. The CryptoQuant Bull Score Index is currently hovering at 20, which is considered within the bearish zone. Analysts noted that for a sustainable rally to occur, this index needs to rise above 60. Until then, any price rebounds are likely to be treated as bear-market recoveries rather than definitive trend reversals.

    The current situation presents a mixed picture for Bitcoin. While seasonal trends and recovering demand metrics offer some optimism for the short term, the persistent bearish sentiment indicated by on-chain data suggests that caution is warranted. Whether the current demand engine will re-ignite into positive territory and if this recovery represents a trend reversal remains uncertain, contingent on sustained demand and a shift in broader market sentiment.

    Why This Matters

    The materials describe a narrow update: Bitcoin (BTC) has risen from a low of $57,700 to $64,000 in early July. Whether the current demand engine will re-ignite into positive territory.

    Broader Context

    Source materials place the factual news in this context: Analysts have predicted for July based on historical data.

  • Ethereum’s Path Uncertain as It Tests Key Resistance Zone

    Ethereum’s Path Uncertain as It Tests Key Resistance Zone

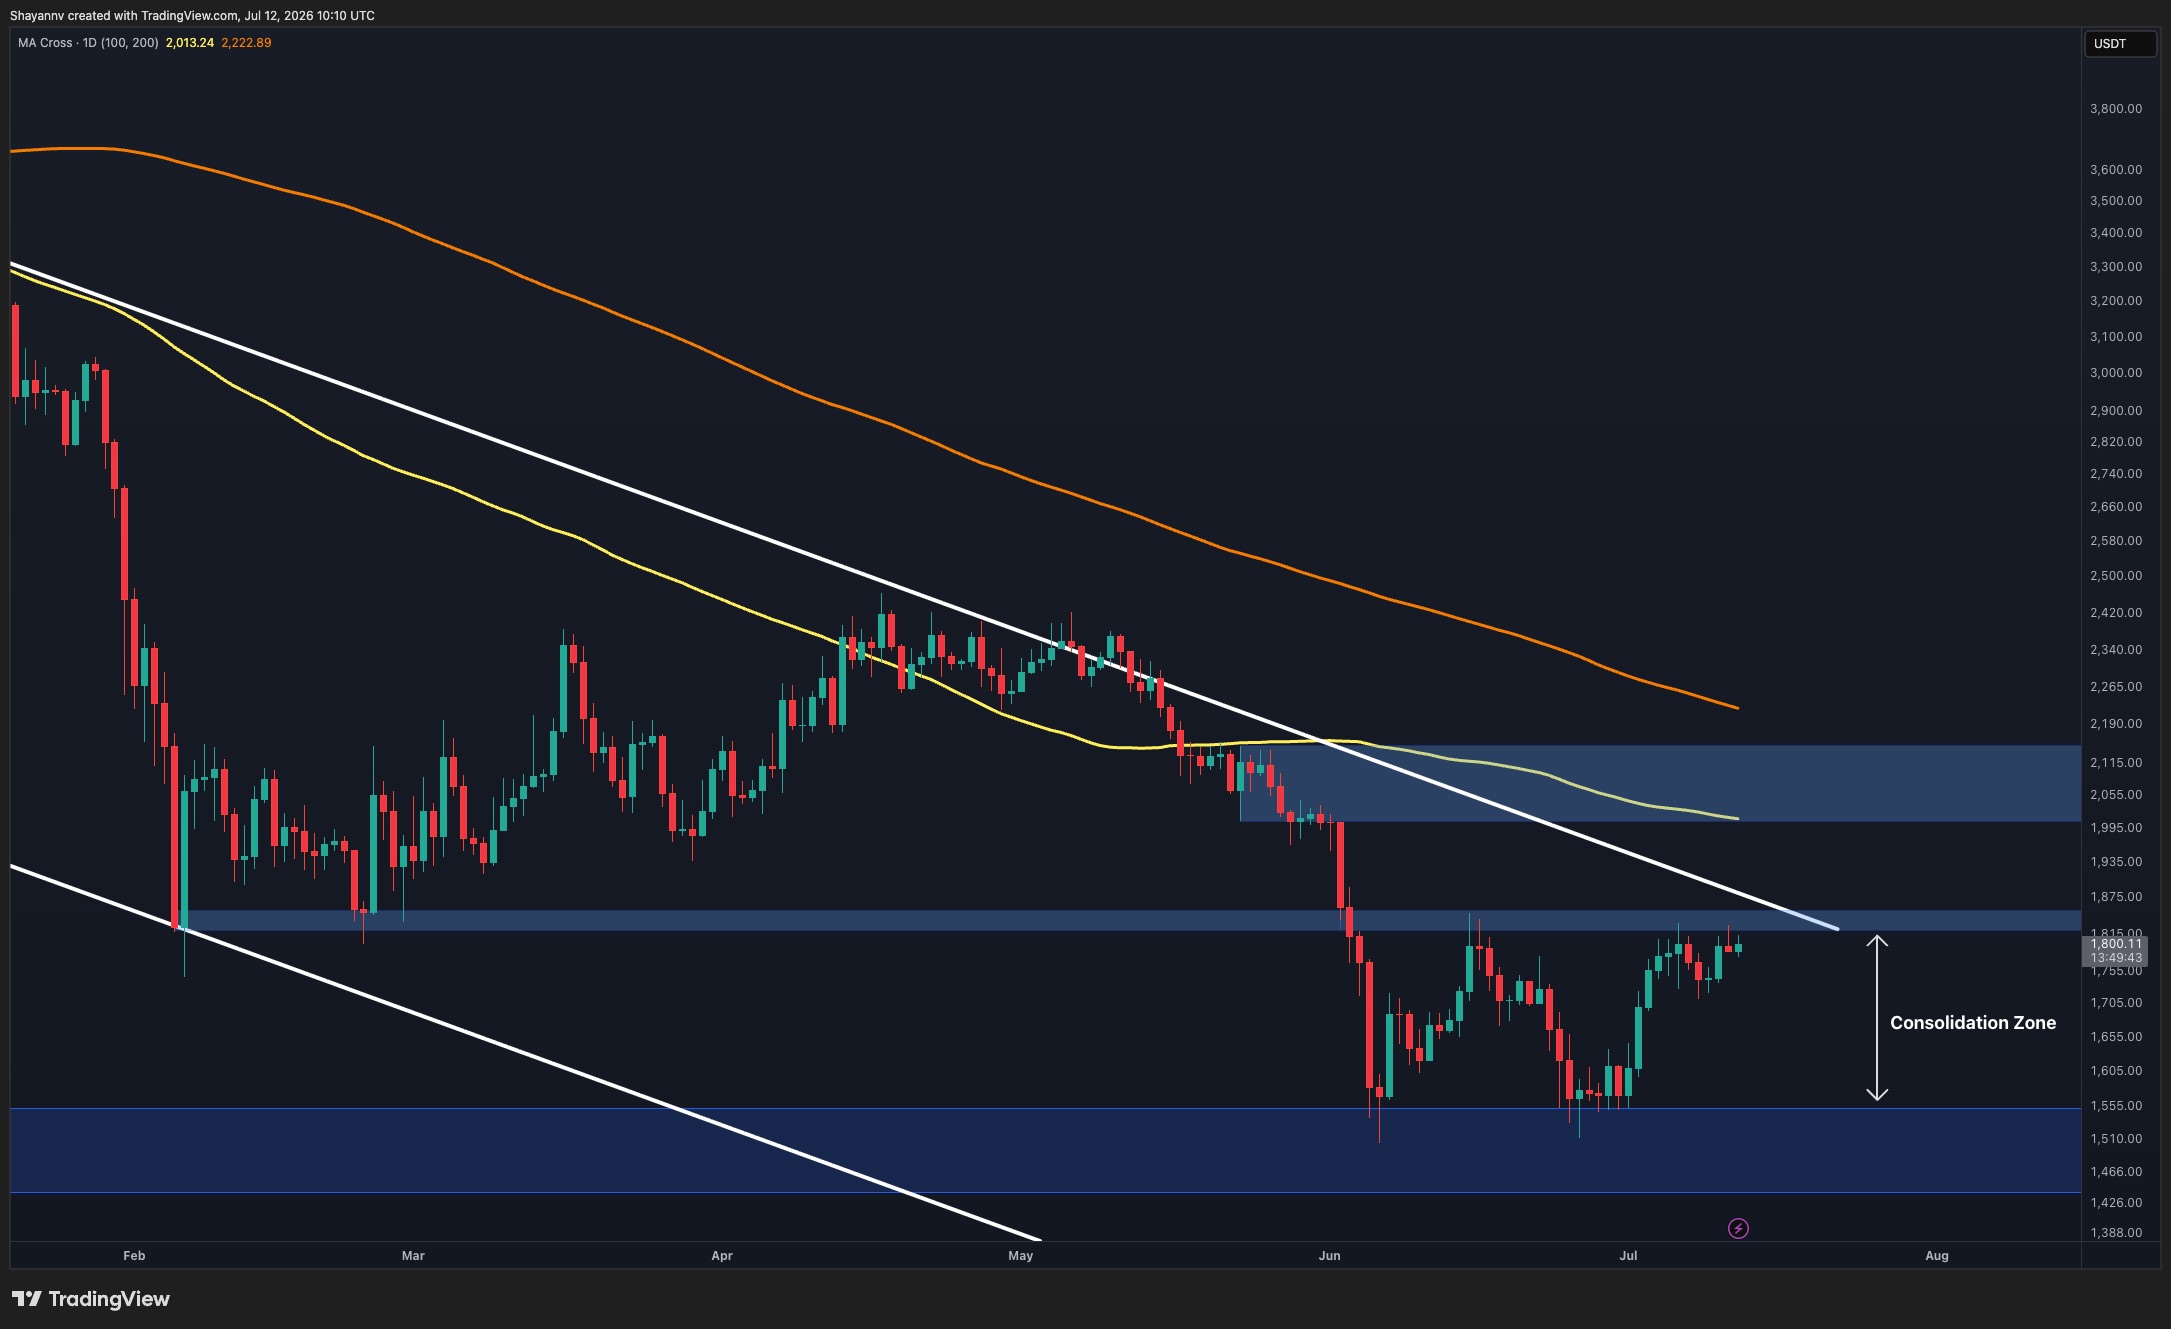
    Ethereum is currently testing a critical technical resistance zone between $1.80K and $1.85K. This area is significant as it aligns with a descending trendline that has capped price action since May, and also represents a former horizontal support level that has now turned into resistance. The current price action is occurring below both the 100-day and 200-day moving averages, which are both trending downwards, indicating a broader bearish market structure.

    The 4-hour chart, however, shows an ascending structure that has been developing since the late-June low. Within this structure, Ethereum has respected the rising channel boundaries, forming higher highs and higher lows, which suggests improving short-term momentum. Key demand zones around $1.62K-$1.64K and $1.72K-$1.74K have been reclaimed and established, respectively, providing support during recent pullbacks.

    Despite this short-term constructive price action, the rally is now approaching the upper boundary of this ascending channel and the major resistance band around $1.80K-$1.85K. This confluence of factors creates a natural area where profit-taking and seller activity could emerge. As long as Ethereum remains below this descending trendline and the $1.80K-$1.85K resistance zone, the current upward movement can still be interpreted as a recovery rally within a larger downtrend.

    Further complicating the outlook is the alignment of technical resistance with liquidity levels. A liquidation heatmap indicates a significant concentration of short-side liquidity situated above the current market price, particularly within the $1.95K-$2.1K region. This area also coincides with the 100-day moving average, which is positioned around $2K-$2.1K, and a broader supply area visible on higher timeframes. Conversely, substantial liquidity pools are noted below the market, around the $1.45K-$1.55K region, which aligns with a major daily demand zone.

    The interplay between the liquidation map and the technical structure suggests that the market may first be drawn towards the overhead liquidity cluster in the $1.95K-$2.1K range. A move into this area would effectively sweep a large concentration of short liquidations while simultaneously testing a significant resistance zone.

    The reaction at the $2K-$2.1K region is expected to be pivotal in determining the next major directional move for Ethereum. If buyers manage to break through and establish acceptance above this resistance area, the recovery could potentially evolve into a broader bullish trend reversal. However, if this liquidity sweep is followed by strong selling pressure and rejection from resistance, Ethereum could enter another notable decline. In such a scenario, the price might target the large liquidity pools resting beneath the market around the $1.45K-$1.55K support zone.

    Ultimately, the path forward for Ethereum remains uncertain. While short-term momentum has shown improvement, the asset is still contending with significant long-term resistance and the potential for liquidity-driven price discovery. A decisive move above the $1.80K-$1.85K zone would shift focus toward the $2K-$2.1K resistance, but rejection could signal a continuation of the broader downtrend.

    Why This Matters

    The current situation presents an uncertain outlook for Ethereum. Whether a larger trend reversal is underway or another corrective leg lower remains ahead, with the market’s next major directional move likely to be determined by the reaction at the $2K-$2.1K region.

    Broader Context

    Ethereum has continued its recovery from the June lows and is now approaching a major technical inflection point. The asset is testing a key resistance region around $1.80K-$1.85K, which coincides with a descending trendline and previous horizontal support turned resistance. The outcome of this test remains uncertain.

  • MicroStrategy Sells Bitcoin Amidst Potential Strategic Shift

    MicroStrategy Sells Bitcoin Amidst Potential Strategic Shift

    MicroStrategy has sold 3,588 Bitcoin for approximately $216 million, reducing its total holdings to 843,775 BTC. This transaction marks a notable deviation from the company’s long-standing strategy of consistent Bitcoin accumulation.

    The sale followed a social media post by Michael Saylor on X, where he shared the message “Bitcoin Is Digital Energy” alongside a graphic of MicroStrategy’s Bitcoin holdings. Historically, such posts often preceded significant Bitcoin acquisitions. However, this instance resulted in a sale, prompting analysts to consider a potential shift in MicroStrategy’s treasury management approach.

    Market Reaction and Analyst Perspectives

    According to Bitget Wallet analysts and commentary from Bitfinex, the market’s reaction to the sale has been relatively muted, with Bitcoin’s price remaining above $60,000. This resilience, despite a substantial sale from a major corporate holder, suggests potential supply absorption. However, market observers consider the precedent set by this sale to be significant.

    Analysts suggest MicroStrategy may be transitioning from a purely accumulative strategy to one incorporating more dynamic liquidity management. This implies a willingness to sell Bitcoin when liquidity needs arise, a departure from its previous one-way accumulation approach. This shift could influence how the market prices MicroStrategy’s stock (MSTR) and the demand profile for Bitcoin going forward.

    Broader Market Context

    The context of the broader Bitcoin market provides a backdrop to this event. On July 1, long-term holder loss realization had climbed to 43% of realized value, and daily Bitcoin losses had peaked at $280 million, the highest since December 2022. While these figures indicate market stress, MicroStrategy’s sale was disclosed in advance and was relatively small compared to its total holdings, with ETF demand reportedly absorbing the supply on the same day.

    Strategic Implications and Uncertainty

    Despite the sale, the case for optimism in the near term holds, particularly as MicroStrategy’s shares saw an increase following the news disclosure. However, uncertainty remains regarding the exact nature and timing of future MicroStrategy Bitcoin transactions. It is not certain whether the company has permanently ceased buying Bitcoin or will exclusively sell in the future. The company had previously announced a new framework in recent weeks, which analysts believe may address a liquidity gap related to its preferred stock dividends.

    This strategic pivot, from a consistent accumulator to a company willing to sell Bitcoin for liquidity, represents a significant development. While the immediate dollar figure of the sale may be considered trivial in the broader market context, the precedent it establishes warrants close observation for its potential impact on corporate treasury strategies and Bitcoin demand dynamics.

    Why This Matters

    The materials describe a narrow update: MicroStrategy sold 3,588 BTC for $216 million, reducing their holdings to 843,775 BTC. Whether the community’s current hope for reaccumulation by MicroStrategy is a misleading conclusion.

  • AI Models Project Divergent Bitcoin Price Forecasts for H2 2026, Dependent on Market Conditions

    AI Models Project Divergent Bitcoin Price Forecasts for H2 2026, Dependent on Market Conditions

    Multiple artificial intelligence models have issued price predictions for Bitcoin in the second half of 2026, presenting a range of potential outcomes from conservative estimates to highly optimistic scenarios. These forecasts, generated by AI such as ChatGPT, Gemini, Grok, and Perplexity, highlight the inherent uncertainty in predicting future market movements and underscore the numerous factors that must align for higher price targets to be realized.

    Current Market Context
    Bitcoin is currently trading around the $64,000 mark. The AI predictions for the latter half of 2026 vary significantly.

    AI Price Predictions for H2 2026
    On the more realistic end, Perplexity forecasts Bitcoin to be between $95,000 and $125,000. Grok’s realistic outlook places it between $90,000 and $120,000, while Gemini suggests a range of $75,000 to $100,000. ChatGPT provided a specific realistic target of $95,000.

    However, the AI models also outlined more bullish scenarios. ChatGPT’s bull case prediction is above $135,000. Gemini’s optimistic outlook ranges from $150,000 to $180,000. Grok’s bull case prediction hovers around $200,000, and Perplexity’s bull case forecast reaches $210,000. Notably, Perplexity’s realistic prediction does not envision Bitcoin surpassing its previous all-time highs, a sentiment echoed by Gemini’s more conservative realistic target.

    Conditions for Optimistic Scenarios
    The realization of these more optimistic price targets is contingent upon a complex interplay of macroeconomic and market conditions. According to Perplexity, factors such as a return of institutional ETF demand, more favorable Federal Reserve policy, and a renewed risk-on appetite from investors are crucial. Grok outlined the need for moderate macro improvement, the absence of major recessions, and Bitcoin’s increasing dominance as a store-of-value asset.

    ChatGPT suggested that a bull case scenario would not necessarily require a new speculative mania but would depend on stabilized ETF demand, a halt in corporate exposure reduction, and moderately more supportive macroeconomic conditions. All the AI models agreed that achieving these higher price levels would require a confluence of many factors. This includes an accelerating global economy, potential peace deals among warring parties, a sweeping cross-asset bull run, and expanding institutional digital-asset treasuries.

    Inherent Uncertainty
    The predictions from these AI models serve as signals of potential future scenarios rather than definitive forecasts. The uncertainty surrounding Bitcoin’s price in H2 2026 remains high, influenced by variables such as institutional ETF demand, future Fed policy, global economic health, and geopolitical stability. While AI offers insights into potential market trajectories, these are heavily dependent on a multitude of aligning factors, underscoring the speculative nature of long-term price predictions.

    Why This Matters

    The materials describe a narrow update: Several AI models, including ChatGPT, Gemini, Grok, and Perplexity, have issued price predictions for Bitcoin for the second half of 2026. Whether Bitcoin may reach new all-time highs in 2026.

  • AI Models Project Wide Range of XRP Price Predictions for 2026, Emphasizing Conditional Factors

    AI Models Project Wide Range of XRP Price Predictions for 2026, Emphasizing Conditional Factors

    Artificial intelligence models have generated a wide spectrum of price predictions for XRP in 2026, with forecasts ranging from a pragmatic low of $1.40 to an ambitious high of $6.00. These predictions, provided by AI platforms including ChatGPT, Grok, Perplexity, and Gemini, are heavily contingent on a complex interplay of market conditions, regulatory developments, and broader cryptocurrency trends.

    Divergent Forecasts Emerge

    According to ChatGPT, a realistic peak for XRP in 2026 is around $2.50. This scenario, the AI suggests, would require XRP to recover in line with the broader market, maintain institutional interest, and benefit from Ripple’s expanding regulatory footprint. Grok and Perplexity offered similar outlooks, with their upper price boundaries also set at $2.50. Perplexity’s lower target for XRP was $1.50, while Grok indicated a floor of approximately $1.80.

    Gemini presented a more conservative view, noting that a pragmatic outlook places XRP between $1.40 and $1.65 for 2026. Despite these lower figures, Gemini acknowledged XRP’s resilience in the first half of 2026, even amidst inflation fears, a hawkish Federal Reserve, and general market uncertainty. Historically, XRP has dipped toward $1.00 on a couple of occasions in 2026, and its all-time high in 2025 was $3.65.

    Conditions for Higher Targets

    More optimistic forecasts emerged from Grok and Perplexity, which indicated that XRP could potentially surpass its 2025 all-time high of $3.65 and reach approximately $5.00. This higher target is conditional on the passage of the CLARITY Act in the US, a significant reduction in global uncertainty, and a substantial rebound in the broader crypto market. Gemini’s bull case scenario was even more expansive, suggesting XRP could peak between $2.75 and $6.00. However, Gemini cautioned that such ambitious targets are currently far-fetched and depend on factors such as decisions in Washington, ETF inflows, and investor risk tolerance.

    ChatGPT, while also offering a higher target, remained more skeptical, suggesting $4.50 as the highest possible price for XRP even in its most bullish scenario. This outcome, according to ChatGPT, would necessitate a genuine altcoin season, strong and sustained ETF demand, continued recent price movement for Bitcoin, and available evidence that XRPL activity and Ripple’s payment infrastructure are driving demand for XRP itself.

    Understanding AI Prediction Limitations

    The range of these AI-generated predictions underscores the inherent uncertainties in forecasting cryptocurrency prices. Factors such as the passage of specific legislation like the CLARITY Act, shifts in global economic conditions, investor sentiment, and the performance of major cryptocurrencies like Bitcoin all play a significant role. The AI models themselves acknowledge these dependencies, framing their higher price targets as contingent on a confluence of positive developments.

    It is important to note that AI predictions are not guarantees of future performance. History has often shown that market outcomes can differ significantly from initial projections. The AI models’ outputs should be viewed as analytical insights into potential future scenarios, rather than definitive forecasts. The actual price of XRP in 2026 will be shaped by a multitude of evolving factors, many of which remain uncertain.

    Why This Matters

    The materials describe a narrow update: The article presents price predictions for XRP in 2026 from four AI models: ChatGPT, Grok, Perplexity, and Gemini. The actual future price of XRP in 2026.

    Broader Context

    Source materials place the market analysis in this context: The article is a speculative piece asking AI models for XRP price predictions in 2026.

  • LAB Token Plummets 97% Amid Team Wallet Sales Allegations

    LAB Token Plummets 97% Amid Team Wallet Sales Allegations

    LAB Token Plummets 97% Amid Allegations of Team-Funded Wallet Dumping

    The LAB token has experienced a dramatic collapse, shedding 97% of its value in a matter of days, following accusations from prominent blockchain investigator ZachXBT that wallets funded by the project’s creators have dumped millions of coins onto the market.

    This development has further exacerbated the already precarious state of LAB, which had previously defied the broader market downturn. The token had enjoyed a period of significant growth, briefly entering the top 20 cryptocurrencies by market capitalization due to consistent double- and triple-digit gains.

    According to CoinGecko data, LAB reached an all-time high of over $27 just over a month ago. However, it now trades below $0.55, marking a 97% decline from its peak, with the majority of these losses occurring in recent days.

    ZachXBT attributed the latest sharp decline, which saw LAB fall from $1.20 to $0.54, to substantial sales executed by the founding team. The on-chain analyst stated that a wallet initially funded by the LAB team deposited 18.4 million tokens, valued at approximately $18.3 million at the time, to the decentralized exchange Aster before liquidating the holdings on the open market.

    This revelation follows an earlier warning from ZachXBT, issued a few months prior, in which he accused the LAB team of maintaining excessive control over the token’s supply and engaging in opaque over-the-counter transactions.

    In a recent Telegram post, ZachXBT detailed that the entity responsible for the sales received over 196 million tokens directly from the team in April 2026. Further analysis indicates that 100 million coins were initially sent to Bitget deposit addresses on April 8, with an additional 97 million tokens transferred to other wallets later that month.

    In May, 100 million LAB tokens were withdrawn from Bitget and distributed across ten separate addresses. ZachXBT argued that there was no market evidence to suggest an independent buyer had acquired such a significant position, leading him to conclude that these wallets likely remained under the control of the same entity.

    After remaining inactive for nearly two months, the entity transferred and sold millions of tokens to Aster on July 10 and 11. The on-chain investigator also noted that these wallets still hold over 80 million coins, despite the recent sales.

  • Grok AI’s XRP Price Prediction: A Look at Potential Upside and Key Uncertainties

    Grok AI’s XRP Price Prediction: A Look at Potential Upside and Key Uncertainties

    Grok AI has presented a speculative price forecast for XRP, projecting a range of $4.50 to $6.00 by the end of 2026. This projection is based on an analysis of institutional developments within the XRP ecosystem, including the potential resolution of the SEC lawsuit, increased ETF inflows, stablecoin scaling, and the growth of tokenized real-world assets on the XRP Ledger. However, the AI model also outlines a less optimistic scenario, suggesting a potential consolidation or pullback to $1.50 to $2.50 if macroeconomic headwinds intensify or regulatory progress encounters delays.

    The AI’s outlook is significantly influenced by the anticipated resolution of the ongoing lawsuit between the U.S. Securities and Exchange Commission (SEC) and Ripple. Grok AI suggests that a formal confirmation in 2025 that XRP is not a security on secondary markets would remove a major institutional barrier. This, combined with sustained inflows into U.S. spot XRP ETFs, which have already attracted between $1.4 and $1.5 billion in cumulative net inflows, is seen as creating potential supply scarcity for the token. These ETFs have locked up hundreds of millions of tokens, which could impact market availability.

    Further contributing to the AI’s view are developments surrounding Ripple’s RLUSD stablecoin and the XRP Ledger’s capabilities. The RLUSD stablecoin is reportedly scaling, with planned launches in Japan via SBI and full MiCA CASP licensing in Europe expected by July 2026. This is anticipated to facilitate seamless XRP bridging for cross-border payments. Additionally, tokenized real-world assets on the XRP Ledger have surpassed $4 billion across more than 500 products. Institutional pilots, such as those involving JPMorgan for settlements, are cited as adding credibility to the on-chain activity.

    Grok AI posits that these factors could lead to increased ETF inflows, boost on-ledger demand driven by RLUSD and XRP Ledger synergies, and encourage a broader institutional rotation into utility tokens. This confluence of events, according to the AI, supports its $4.50 to $6.00 price target.

    Conversely, the AI acknowledges a more contained downside scenario. If macroeconomic conditions worsen, ETF flows decelerate, or legislative efforts like the CLARITY Act face significant delays, XRP could consolidate or pull back to the $1.50 to $2.50 range. Despite this possibility, the AI argues that XRP’s core utility and the clarity following the SEC lawsuit resolution would provide a firm downside support, suggesting a more robust floor than in previous market cycles.

    From a technical perspective, XRP is currently trading around $1.11. The asset recently showed a recovery after testing the $1.00 psychological floor in June. The daily chart indicates a move into the $1.11 to $1.12 zone, representing the highest close in approximately three weeks. Resistance levels are noted near $1.20 and $1.60, with support holding at $1.00. A sustained close above $1.20, followed by $1.40, would be required to provide the first technical evidence of the institutional accumulation that Grok AI describes.

    While Grok AI’s analysis highlights potential growth drivers, significant uncertainties remain. The full resolution of the SEC lawsuit and its specific outcomes are not guaranteed. The extent of future ETF inflows, the adoption rate of RLUSD, and the impact of broader economic factors are all subject to market dynamics and external events. The AI’s mention of LiquidChain, a project focused on addressing cross-chain fragmentation, is also presented with caution, as its execution and adoption remain unproven.

    Ultimately, Grok AI’s projection serves as a speculative signal based on identified trends and potential developments. Investors are advised to consider this forecast within the context of current market conditions, ongoing regulatory processes, and the inherent uncertainties associated with cryptocurrency price predictions.

    Why This Matters

    The materials describe a narrow update: Grok AI analyzed institutional developments in the XRP ecosystem and predicted a significant price increase for XRP by the end of 2026, citing factors like the resolution of the SEC lawsuit, increased ETF inflows, stablecoin scaling, and tokenized real-world assets on the XRP Ledger. Whether the SEC lawsuit will be fully resolved in 2025.

    Broader Context

    Source materials place the factual news in this context: Elon Musk Grok AI.