Tag: Market Trends

  • XRP Tests Demand Zone Between $1.02 and $1.08; Price Direction Remains Uncertain

    XRP Tests Demand Zone Between $1.02 and $1.08; Price Direction Remains Uncertain

    XRP is currently testing a demand zone between $1.02 and $1.08, a level that technical analysis suggests could influence whether the asset stabilizes or faces further downward pressure. It remains uncertain whether XRP will stabilize or extend its decline from this point.

    Technical Landscape: Descending Channel and Resistance

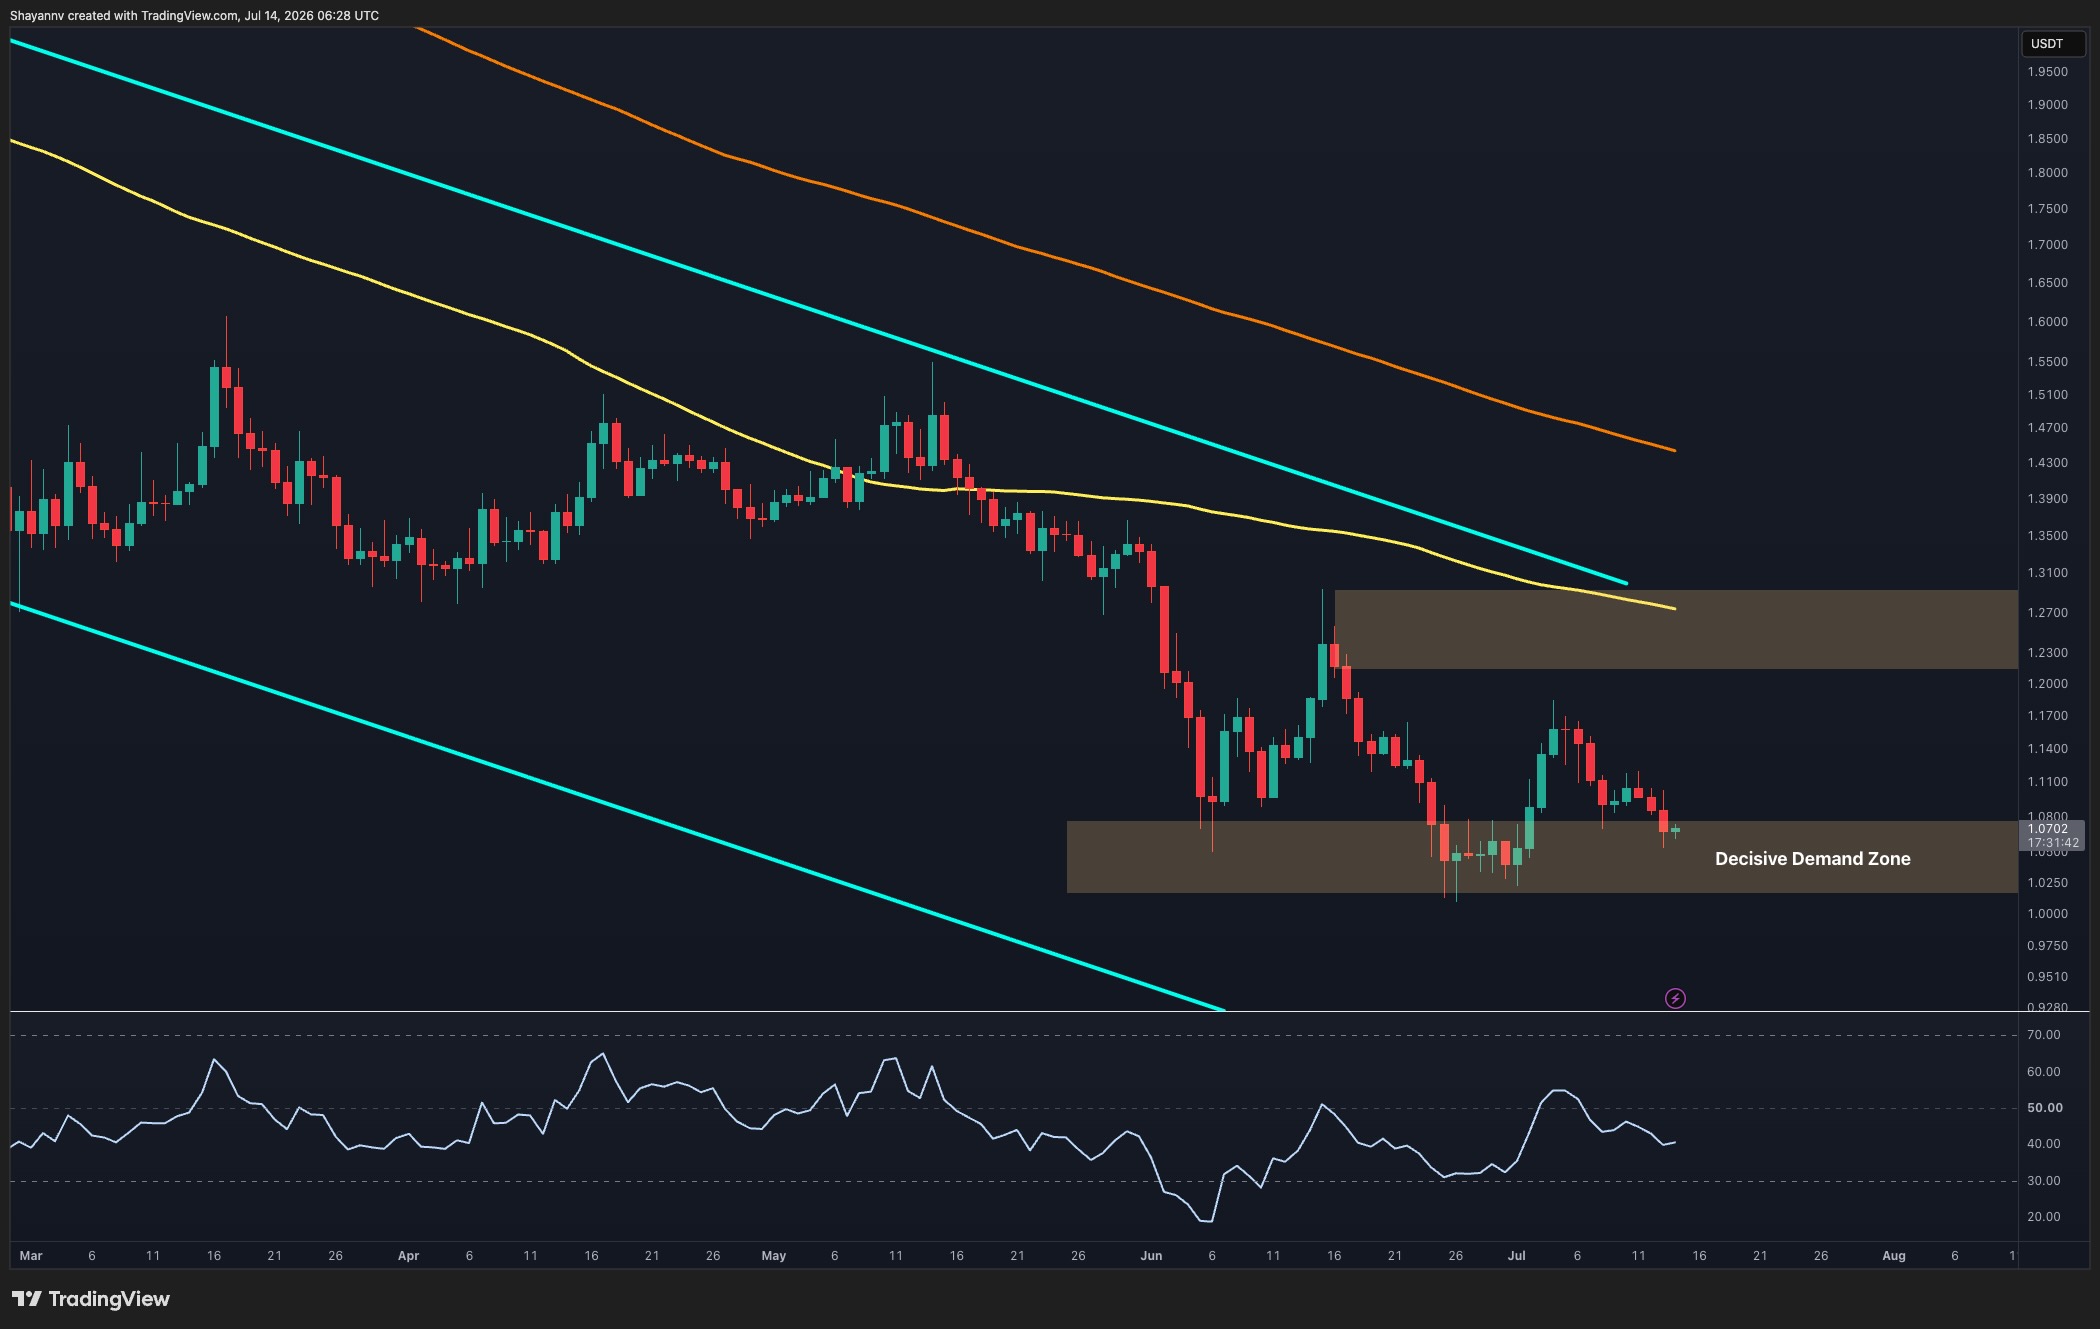
    On the daily timeframe, XRP has been trading within a large descending channel that has contained its price action since the beginning of the year. The asset recently experienced a rejection from the upper resistance region, specifically around the $1.22 to $1.29 area. According to the analysis, this supply zone has repeatedly capped bullish advances throughout the downtrend. The rejection occurred near the confluence of the descending channel’s upper boundary and the 100-day moving average, reinforcing the significance of this resistance area.

    The Demand Zone: Support and Potential Outcomes

    Following this rejection, XRP has retraced towards the key demand zone located between $1.02 and $1.08. As per the source, this area has attracted buyers and represents a support level on the daily chart. As long as the price remains above this zone, the market could continue consolidating within the lower portion of the channel.

    Short-Term Signals and Uncertainty

    The 4-hour chart offers a closer look at recent price weakness. XRP experienced a rally from the lower demand zone but failed to sustain momentum after reaching resistance at the descending trendline and the overhead supply region around $1.22-$1.29. Since then, the asset has produced a series of lower highs and lower lows, reflecting short-term bearish pressure, the article states.

    The market has now returned to the demand zone around $1.03-$1.08 on the 4-hour chart. This area has acted as the foundation for rebounds since late June, according to the analysis. This zone remains a level to monitor.

    Potential Scenarios

    Two primary signals emerge from this price action. Firstly, a move below the $1.02-$1.08 demand zone could lead to a decline for XRP. This scenario would likely invalidate the current stabilization attempt and expose the lower boundary of the descending channel, potentially opening the door for further downside.

    Secondly, a defense of the $1.02-$1.08 demand zone could trigger a relief rally. Such a move might see XRP test the descending trendline and the $1.22-$1.29 resistance zone again. This outcome would keep XRP within its broader consolidation structure, preserving the possibility of a larger move later, though it is uncertain if such a move will occur.

    Conversely, a loss of the demand zone would represent a structural deterioration and likely shift momentum in favor of sellers. For now, the token remains positioned at a support area. While the broader trend continues to favor caution below the major moving averages and descending channel resistance, the $1.02-$1.08 demand zone remains a key level to defend to prevent another leg lower, according to the article.

    Broader Context

    Source materials place the market analysis in this context: Ripple’s XRP remains trapped within a broader bearish market structure despite several recovery attempts over the past few weeks.

  • XRP Market Analysis: Divergent Price and Sentiment Signals

    XRP Market Analysis: Divergent Price and Sentiment Signals

    XRP is currently trading around $1.07, having experienced a decline of over 7% in the past week. This price action occurs against a backdrop of significantly elevated social sentiment, with Santiment data indicating a ratio of 3.02 bullish comments for every bearish one over the last five weeks. This divergence between price and sentiment is often interpreted as a contrarian signal, suggesting that current optimism may not align with underlying price trends, a situation that introduces uncertainty regarding XRP’s immediate future.

    The broader cryptocurrency market has seen some recovery, with the total market value rising to approximately $2.13 trillion. Centralized exchange spot trading volumes also increased in June by 15.3% to $1.11 trillion, suggesting improving market participation. However, XRP’s recovery momentum has not matched that of other major cryptocurrencies like Ethereum, which has reclaimed the $1,800 mark. This suggests that buyers may be exercising selectivity in the current market, contributing to the ambiguity surrounding XRP’s independent trajectory.

    Analysts point to persistent seller pressure near key resistance levels for XRP, particularly around the $1.35 mark. Each attempt to breach this level has attracted fewer buyers, reinforcing it as a significant ceiling rather than a launchpad for further gains. The market has also experienced substantial liquidations, with over $160 million in leveraged positions being cleared, including approximately $108 million in short positions, underscoring ongoing volatility and trader activity.

    Analyzing Potential Market Scenarios

    Looking ahead, market observers suggest the most likely scenario involves XRP trading within a range of $1.00 to $1.20 as sentiment gradually cools. This period of consolidation could potentially build a more stable foundation for future price movements. However, uncertainties persist. A bearish scenario could emerge if support just above the $1.00 level fails, especially during a wider market selloff, potentially leading XRP to revisit the high $0.90s. This area is considered by some analysts as the next meaningful support level.

    For XRP to shift its trend convincingly, it would need to reclaim the $1.30 to $1.35 zone with expanding trading volume. While a bounce driven by Bitcoin’s strength would be encouraging, analysts suggest XRP needs to demonstrate independent momentum to solidify any recovery. The current setup for XRP, and many mid-to-large-cap altcoins, presents asymmetric downside risk with capped upside, particularly with a crowd that appears to be already positioned for gains.

    Alternative Investment Landscape

    In this environment, a rotation into earlier-stage infrastructure projects where price discovery is ongoing has been noted. For instance, LiquidChain, a Layer 3 infrastructure project focused on cross-chain liquidity, is currently in its presale phase, priced at $0.01479, having raised $900,000 to date. This project aims to fuse liquidity from Bitcoin, Ethereum, and Solana into a single execution environment.

    Ultimately, XRP’s current market position is characterized by ambiguity. While social sentiment is high, price action and technical resistance suggest caution. Investors should monitor buying pressure, resistance levels, and broader market conditions to navigate the potential outcomes for XRP, acknowledging that the extent of future buying pressure and the possibility of a wider market selloff remain key uncertainties.

    Why This Matters

    The materials describe a narrow update: XRP is trading around $1. Whether XRP can overcome seller pressure and resistance levels.

    Broader Context

    Source materials place the market analysis in this context: XRP prediction chatter is heating up even as the price slips, which is usually when markets like to play tricks.

  • XRP Nears End of Year-Long Correction: What’s Next?

    XRP Nears End of Year-Long Correction: What’s Next?

    XRP Nears End of Year-Long Correction, Analysts Predict Potential Bottom

    It was a year ago this month that the cross-border token XRP captured significant attention, surging to an all-time high after seven years of stagnation, a feat many deemed improbable.

    However, the subsequent period has seen a severe correction. In the months following its peak, XRP shed the $3.00 and $2.00 support levels, ultimately plummeting to $1.01 during a market downturn in late June and early July. Despite a minor rebound to $1.07 as of press time, the token’s price remains significantly depressed, trading over 70% below its previous all-time high.

    Amidst this downturn, analyst CasiTrades has offered a positive outlook for XRP bulls, suggesting that the token’s year-long correction may be nearing its conclusion.

    In her latest analysis of XRP’s price performance, CasiTrades identified a potential final five-wave impulse down on lower timeframes, which could lead the token to a major macro support level at $0.87. This sentiment is echoed by several other analysts, who anticipate XRP could bottom out somewhere between $0.80 and $0.90.

    CasiTrades’ projection for the anticipated downward movement outlines a sharp initial decline towards $0.93. This would be followed by a bounce to $1.00, which is expected to act as significant resistance. A rejection at this level, she posits, is likely to result in the aforementioned bottoming out at $0.87.

    “That final move would complete the macro Wave 2 correction and finish off the correction we’ve spent the last year building! The odds still favor one final low into support before the next major trend begins!” CasiTrades stated.

    Interestingly, analyst ChartNerd has presented a similar prediction for XRP, indicating that a series of lower highs could signal further trouble and push the token well below $1.00.

    CasiTrades, along with other analysts, believes this final downward leg is crucial for XRP to cleanse its current market structure and shake out “weak hands” before entering its next expansion phase. MikybullCrypto has also joined the optimistic chorus, suggesting that the token is forming a “massive” pattern.

    While MikybullCrypto has not provided a specific short-term target, he has a history of making bullish XRP forecasts, including a potential run to a new all-time high of $4.00 and beyond.

    $XRP
    What is coming for XRP will be massive
    I love the pattern formation pic.twitter.com/T7ZIHRmtzJ
    — MikybullCrypto (@MikybullCrypto) July 14, 2026

  • Grok AI’s XRP Price Prediction: Analyzing Potential Amidst Significant Uncertainty

    Grok AI’s XRP Price Prediction: Analyzing Potential Amidst Significant Uncertainty

    Interpreting AI-generated price targets for digital assets like XRP involves navigating significant uncertainty, as predictions often outpace verifiable market indicators and technological adoption. Grok AI has issued a forecast suggesting XRP could reach three-digit prices by the end of 2026, a projection that warrants a closer look at its underlying assumptions and the broader market context.

    Currently trading around $1.06, XRP has experienced substantial corrections from previous highs, which reached approximately $3.65. According to Grok AI, its prediction is based on several factors, including XRP’s utility in facilitating fast and low-cost global payments, the growth of tokenized real-world assets on the XRP Ledger (XRPL) surpassing $4 billion, increasing institutional interest in cross-border settlements, and the potential for favorable regulatory developments. These elements, Grok AI suggests, could collectively drive XRP’s value significantly higher.

    The AI’s forecast posits that in a robust bull market, coupled with widespread adoption for remittances and tokenized assets, XRP could realistically achieve three-digit prices by the close of 2026. Some analysts, such as Pumpius, have even posited a future XRP valuation of $1,000 by 2027, contingent on optimal conditions including bank integration, regulatory support, and a rotation into altcoins. However, these projections are subject to considerable uncertainty.

    XRP’s foundational strengths lie in its role as a bridge asset for cross-border transactions, notably within Ripple’s On-Demand Liquidity network. The XRPL has demonstrated its capability in handling tokenized assets, with a current valuation exceeding $4 billion. The potential for improved regulatory clarity and the passage of pro-crypto legislation are also cited as factors that could encourage greater institutional adoption of XRP.

    Beyond the XRP prediction, the source material also mentions Bitcoin Hyper, a Bitcoin Layer 2 chain. It is described as a solution for real-time Bitcoin activity and ecosystem growth, with a presale price of approximately $0.0137 for its HYPER token. Over $32.9 million has reportedly been raised for the Bitcoin Hyper presale, which is noted to be in its final stages, offering potential staking rewards of 36%.

    However, the path to achieving ambitious price targets for XRP is fraught with challenges. The exact timing and magnitude of any potential price surge remain speculative. Future regulatory landscapes and the extent of institutional embrace are not guaranteed. Furthermore, the ambitious price points of $15,000 or $1,000 for XRP, linked to scenarios like replacing the SWIFT system, are highly speculative and lack concrete evidence for their realization.

    Similarly, the projected growth of Bitcoin Hyper in 2026 and beyond is an outlook rather than a certainty. The cryptocurrency market is inherently volatile, and predictions, whether from AI or human analysts, should be approached with a critical perspective. The resolution of past legal matters concerning XRP has removed some obstacles, but the broader market dynamics and adoption rates will ultimately shape its trajectory.

    In conclusion, while Grok AI’s prediction highlights potential upside for XRP based on its technological utility and evolving market conditions, significant uncertainties persist. Investors and market observers are advised to consider the inherent risks and speculative nature of such forecasts, focusing on fundamental factors and verifiable developments rather than solely on AI-generated price targets.

    This analysis is particularly relevant given the current crypto market’s volatility. XRP’s utility in global payments and the growth in tokenized assets on the XRPL, which has surpassed $4 billion, are key factual underpinnings. However, the speculative nature of price predictions, even from AI, underscores the need for caution.

    Why This Matters

    The materials describe a narrow update: Grok AI has issued a price prediction for XRP, forecasting it could reach three-digit figures by the end of 2026, citing factors like its utility in global payments, growth in tokenized assets, institutional interest, and potential regulatory tailwinds. The exact timing and magnitude of XRP’s potential price increase.

  • Google Gemini AI’s Bitcoin Price Prediction: Analysis of Potential Scenarios and Market Factors

    Google Gemini AI’s Bitcoin Price Prediction: Analysis of Potential Scenarios and Market Factors

    Google Gemini AI has presented an analysis of Bitcoin’s future price trajectory, forecasting a potential range of $120,000 to $150,000 by the end of 2026. The AI’s outlook is underpinned by several key market dynamics, while also acknowledging significant potential risks.

    According to the AI’s assessment, Bitcoin’s current price around $64,135 is viewed as a foundational point for potential upward movement. The AI’s bullish case is predicated on three converging factors: ongoing inflows into Bitcoin spot Exchange Traded Funds (ETFs) that consistently reduce market supply; increasing adoption of Bitcoin as a corporate treasury reserve asset; and a projected macroeconomic shift towards global interest rate cuts, which could stimulate investment in higher-yielding assets.

    These elements, the AI suggests, are contributing to Bitcoin’s institutionalization as a core macroeconomic asset, potentially paving the way for a rally within the next 18 months. The prediction of $120,000 to $150,000 by year-end 2026 is based on these evolving structural forces.

    Conversely, Google Gemini AI also outlines a more severe bear case scenario. The AI indicates that persistent regulatory challenges or a widespread global recession could trigger significant risk-off liquidation, potentially driving Bitcoin’s price down to the $40,000 to $45,000 range. This downside projection is noted as being more pronounced than other forecasts, reflecting the AI’s consideration of substantial macroeconomic shock risks.

    From a technical standpoint, Bitcoin has demonstrated recent recovery signs. The cryptocurrency has moved back above $64,000, achieving its highest close since late May. This follows a rebound from June lows near $58,000, with chart patterns suggesting a series of higher lows. While daily momentum appears constructive, the broader downtrend originating from Bitcoin’s October highs near $127,000 has not yet seen a definitive technical reversal. A sustained break and hold above the $68,000 resistance level is identified as a key indicator for the potential initiation of the predicted upward trend.

    The analysis also touches upon early-stage infrastructure projects, such as LiquidChain. The article notes that projects with smaller market capitalizations can present opportunities for significant price movements if they effectively address market inefficiencies. LiquidChain is presented as a project aiming to mitigate multi-chain fragmentation in decentralized finance (DeFi) by establishing a unified execution layer for networks like Bitcoin, Ethereum, and Solana, with the objective of reducing cross-chain transaction costs. The presale for LiquidChain is currently priced at $0.01454, having raised just over $890,000, indicating it remains in an early, less-discovered phase.

    It is crucial to recognize that AI-driven financial forecasts, including those from Google Gemini AI, are inherently subject to uncertainty. The precise timing of macroeconomic shifts, the evolution of regulatory landscapes, and the ultimate success of emerging projects like LiquidChain remain unknown variables. The AI’s analysis offers a framework for potential future scenarios but should be considered one element among many for investors and observers.

    Why This Matters

    Google Gemini AI has predicted Bitcoin could reach between $120,000 and $150,000 by the end of 2026, citing compounding spot ETF inflows, expanding corporate treasury adoption, and a favorable macroeconomic shift toward global rate cuts as key drivers. The exact timing of the predicted Bitcoin price surge remains uncertain.

    Broader Context

    The article is part of a series covering Bitcoin predictions.

  • Cardano Faces Geopolitical Headwinds Amidst Strong Developer Activity and Institutional Staking

    Cardano Faces Geopolitical Headwinds Amidst Strong Developer Activity and Institutional Staking

    Cardano’s price experienced volatility on July 13, dipping to an intraday low of $0.1572, influenced by broader market conditions and geopolitical events, including coordinated strikes by Iran across five regional countries. Despite this short-term price pressure, the Cardano network continues to demonstrate robust underlying strength through consistent developer activity and significant institutional commitment, exemplified by Kraken’s substantial investment in Cardano stake pools.

    On July 13, Cardano (ADA) was trading near $0.1616. The cryptocurrency saw a 3.60% decrease over the preceding 24 hours and a 13.10% decline over the past seven days. The intraday low of $0.1572 reflected the market’s reaction to geopolitical tensions. The 7-day trading range for ADA has been between approximately $0.1623 and $0.1922, placing the current price near the lower end of this band.

    Network Health and Institutional Commitment

    Simultaneously, Kraken registered 12 Cardano stake pools in June, with approximately $1 billion in ADA delegated to these pools. This infrastructure commitment suggests a deliberate operational strategy by Kraken. In parallel, Cardano’s developer activity remains strong, with 233 GitHub commits recorded over the past seven days. This places Cardano fifth among all Layer-1 networks in development activity, accounting for roughly 6.2% of the total development activity across approximately 3,700 commits in the same period.

    This combination of institutional staking posture and developer momentum is a quiet accumulation signal that tends to be ignored amid geopolitical noise, according to the source. However, broader altcoin flows remain tilted toward Bitcoin and Ethereum, keeping ADA rangebound despite the underlying activity.

    Technical Analysis and Market Scenarios

    Technically, the 20-day Exponential Moving Average (EMA) near $0.1667 is identified as a critical level. The Relative Strength Index (RSI) stands at 43.04, with a bullish divergence structure technically active from June lows, although momentum has decreased from a peak of 60. Higher moving averages, including the 50-day EMA at $0.1811 and the 100-day EMA at $0.2111, represent significant upside resistance. The former resistance band between $0.20 and $0.22 is now considered supply rather than support.

    Market analysis suggests three potential near-term scenarios for ADA’s price. The bull case posits that ADA holds the 20-day EMA zone, geopolitical fears subside, and the price moves towards $0.19 over three to five sessions. The base case anticipates consolidation between $0.16 and $0.1811, with macro uncertainty suppressing risk appetite, leading to neither a breakdown nor a breakout. The bear case suggests that a daily close below $0.155 could lead to a retest of the $0.14 region, potentially invalidating the existing bullish divergence structure.

    Broader market conditions are noted as the dominant variable influencing ADA’s trajectory, with the asset not cleanly diverging from the macro direction at this stage of the cycle. While Kraken’s staking news is constructive, institutional staking yield generation is not considered a direct price catalyst. The probability distribution of ADA’s price movement is seen as skewing toward the base case of consolidation.

    Broader Market Dynamics and Alternatives

    Cardano’s range compression highlights a common challenge for established Layer-1 networks: their large market capitalization requires substantial capital inflows to drive price movement, while narrative momentum may stall below key moving averages without immediate catalysts for institutional re-rating. This dynamic is reportedly pushing some traders toward earlier-stage infrastructure projects.

    In related developments, LiquidChain (LIQUID), a Layer-3 infrastructure project, is positioning itself as a cross-chain liquidity layer. Its core thesis addresses the perceived siloed nature of liquidity pools across Bitcoin, Ethereum, and Solana, aiming for unified execution. The project’s Unified Liquidity Layer and Deploy-Once Architecture are highlighted as key differentiators. LiquidChain’s presale is currently priced at $0.01479, with $903,121.14 raised to date. However, it is important to note that early-stage presales carry inherent risks of project non-delivery and illiquidity, and potential investors are advised to research the presale terms thoroughly.

    Uncertainty remains regarding the immediate direction of ADA’s price, with geopolitical events and broader market sentiment playing significant roles. The long-term health of the network, however, appears supported by consistent developer contributions and institutional backing.

    Why This Matters

    The materials describe a narrow update: Cardano’s price fell to $0. Whether the current price move for ADA is a controlled pullback or the start of another leg lower.

    Broader Context

    Source materials place the factual news in this context: Cardano (ADA) is trading near $0.1616 on July 13, retesting the 20-day EMA as an overnight geopolitical shock, Iran launching coordinated strikes across five regional countries, rattled crypto markets broadly, and pushed ADA to an intraday low of $0.1572 before a partial recovery.

  • Binance Futures Soar 80% in June Amid Spot Market Slump

    Binance Futures Soar 80% in June Amid Spot Market Slump

    Binance reportedly experienced a substantial surge in futures trading volume last month, with figures indicating an 80% jump from May’s activity and reaching a yearly high. This increase occurred as cryptocurrency spot markets languished at their weakest pace in two years.

    According to commentary from CryptoQuant analysts, the surge in futures trading comes at a time when Bitcoin’s price has remained relatively stable, and a significant portion of the market holds a bearish outlook. The sharp monthly increase in futures volume, contrasted with a stagnant spot market, suggests a deliberate shift in trader positioning.

    The June futures figures propelled Binance ahead of its closest derivatives competitors. While OKX and Bybit also reported increases in futures volume from May to June, neither matched Binance’s growth or overall scale. Data indicates that Binance’s futures volume significantly surpassed those of OKX and Bybit.

    The last time these exchanges approached similar volume levels was in early 2026. June marked a return to, and in Binance’s case, an surpassing of that benchmark. However, the centralized exchange (CEX) futures market remained under pressure throughout the second quarter.

    Binance’s June futures volume increase occurred against a deteriorating quarterly backdrop. Total CEX futures volume across the market declined in Q2 2026 compared to Q1, continuing a downward trend. While the pace of decline slowed relative to earlier quarters, the downward direction persisted.

    Spot markets faced even deeper challenges. CEX spot volume dropped to a two-year low in Q2, with Binance remaining the largest spot venue but experiencing a slight decrease in market share. Binance, however, maintained a steady share of the futures market for the quarter.

    The widening gap between futures and spot markets underscores a structural shift in trading behavior. Derivatives-driven price action has characterized much of the 2026 market, with leverage washouts, basis trades, and hedging activity remaining robust while directional spot buying stalls. The June Binance data aligns with and amplifies this pattern.

    It remains unclear whether the futures surge reflects genuine directional conviction or primarily hedging and arbitrage flows—strategies that generate volume without necessarily indicating bullish or bearish bets. This distinction is crucial for interpreting the implications of the volume spike.

    Binance’s futures volume surge occurred just before Europe’s Markets in Crypto-Assets (MiCA) regulatory framework entered a new enforcement phase on July 1. Binance withdrew its application for a Greek license in late June, raising questions about European market access and potential impacts on derivatives volumes.

    Early data from July suggests the regulatory transition has not materially disrupted Binance’s futures activity. Binance recorded substantial futures volume in the first 10 days of July, indicating continued trading momentum. However, the limited data period means future regulatory actions could still affect volumes.

    The MiCA transition is significant as Europe is considered an important market for derivatives volumes on major centralized exchanges. Market patterns in July will clarify the extent to which June’s volume reflected front-running of regulatory deadlines versus durable shifts in demand.

    In summary, Binance’s June volume increase is a notable data point signaling a concentration of trading activity in derivatives on dominant venues amidst weaker spot volumes. Whether this concentration persists into the third quarter and how MiCA affects European-sourced volume will become clearer with forthcoming data.

  • Crypto Market Sees Capital Rotation Amid Regulatory Anticipation and Ethereum’s AI Narrative

    Crypto Market Sees Capital Rotation Amid Regulatory Anticipation and Ethereum’s AI Narrative

    The cryptocurrency market is currently characterized by a notable rotation of capital away from stablecoins, with over $10 billion reportedly withdrawn since May. This shift is accompanied by a growing interest in memecoins, as investors reportedly chase higher returns. Simultaneously, the market is closely watching regulatory developments, particularly the anticipated unveiling of an updated version of the CLARITY Act next week, which could significantly shape the industry’s future.

    Bitcoin and Ethereum, the two largest cryptocurrencies by market capitalization, have maintained relative price stability despite these market dynamics. Bitcoin experienced a temporary dip below $63,000 over the weekend, attributed to geopolitical tensions, which triggered over $14 million in long liquidations. However, buyer interest emerged, and by Sunday, Bitcoin had settled back into the $63,000 to $64,000 range. Spot Bitcoin ETFs have also recorded net inflows after nine consecutive weeks of withdrawals, signaling renewed institutional confidence.

    Ethereum has been trading in a tight range around $1,800. Despite this price consolidation, institutional interest remains robust. Analysts like Tom Lee, through his firm Bitmine, which holds 5.74 million ETH (approximately 4.8% of the total supply), continue to highlight Ethereum’s potential as the settlement layer for the burgeoning AI economy. This narrative is gaining traction, with Ethereum whales reportedly purchasing an additional $20.6 million worth of ETH, even following several days of exchange outflows.

    The CLARITY Act is a focal point for the industry, with lawmakers expected to present an updated version next week and the bill potentially reaching Congress as early as July 17. Supporters believe the legislation will provide much-needed definition for digital assets, distinguishing between securities and commodities, which could remove significant obstacles for the crypto sector. The market appears to be largely focused on this regulatory development, with less concern shown regarding other proposals like BIP 110, which aims to limit arbitrary data in Bitcoin transactions.

    Further bolstering Ethereum’s case among institutions, particularly those focused on sustainability, a Cambridge study indicated that the network’s shift to Proof of Stake has reduced its electricity consumption by over 99.9%. Additionally, the Ethereum Foundation reported that one of its AI agents successfully detected a validator crashing bug, showcasing advancements in network security and development.

    However, uncertainties remain regarding the precise impact of the CLARITY Act if passed. Analysts like Fidelity’s Jurrien Timmer suggest the possibility of one more market shakeout before a sustained rally, with $60,000 acting as a potential bottom for Bitcoin. Speculation also persists around potential further Bitcoin purchases by figures like Michael Saylor. The sustainability of the rotation from stablecoins into assets with higher upside potential, such as memecoins, is also a key point of observation.

    In summary, the current crypto landscape is a complex interplay of capital rotation, regulatory anticipation, and evolving technological narratives. The CLARITY Act’s progress and the growing narrative around Ethereum’s role in AI are key drivers influencing market sentiment and investor behavior, while major assets like Bitcoin and Ethereum demonstrate resilience.

    Why This Matters

    The materials describe a narrow update: The stablecoin market has seen a decline of over $10 billion since May, with funds reportedly rotating into memecoins. The exact impact of the CLARITY Act if passed.

    Broader Context

    Source materials place the factual news in this context: The stablecoin market has lost more than $10 billion since May, but it might not be a warning sign. Instead, money is flowing into memecoins as investors chase higher returns on Robinhood chain. Bitcoin, Ethereum, and the CLARITY Act are now driving price sentiment, with lawmakers expected to unveil an updated version of the bill next week.

  • Stablecoin Market Cap Drops Amidst Memecoin Rotation; CLARITY Act Advances

    Stablecoin Market Cap Drops Amidst Memecoin Rotation; CLARITY Act Advances

    The cryptocurrency market is experiencing a significant rotation, with the stablecoin market capitalization decreasing by over $10 billion since May, according to reports. This outflow is reportedly fueling a rotation into memecoins as investors seek higher returns. Concurrently, regulatory developments are progressing, with the CLARITY Act expected to advance, potentially clarifying digital asset classifications.

    Bitcoin and Ethereum have demonstrated resilience amidst these market dynamics. Bitcoin’s price, which dipped below $63,000 over the weekend and triggered over $14 million in long liquidations, has since settled back into the $63,000 to $64,000 range. Verified facts indicate that spot Bitcoin ETFs have recorded net inflows after nine weeks of withdrawals, and the Coinbase Premium Index has climbed back toward neutral after 55 consecutive days in negative territory, suggesting increased activity from U.S. buyers.

    Ethereum’s price has been trading around $1,800. Institutional interest in Ethereum as a potential settlement layer for the AI economy is growing, a narrative supported by analysts like Tom Lee. His firm, Bitmine, holds 5.74 million ETH, representing approximately 4.8% of the total supply, and plans to increase this stake. In recent days, Ethereum whales have purchased an additional $20.6 million worth of ETH.

    Regulatory progress is a key focus, with lawmakers expected to unveil an updated version of the CLARITY Act next week. The bill could reach Congress as early as July 17, marking a significant moment for the crypto industry. Supporters believe the act will define which digital assets fall under securities laws and which are commodities, potentially removing a major obstacle for the sector.

    Further supporting the ecosystem, Japan has pledged increased support for Web3 startups through funding and friendlier policies, as stated by Prime Minister Sanae Takaichi at WebX 2026. Meanwhile, on the development front, the Ethereum Foundation reported that one of its AI agents detected a validator crashing bug, highlighting advancements in network security. A separate Cambridge study found that Ethereum’s transition to Proof of Stake reduced its electricity consumption by over 99.9%, strengthening its appeal for sustainability-focused institutions.

    Despite these developments, uncertainties remain. The precise impact of the CLARITY Act on digital asset classification is yet to be determined. Analysts like Jurrien Timmer anticipate a potential market shakeout before a rally, with $60,000 seen as a possible bottom for Bitcoin. The long-term implications of proposals like BIP 110, which aims to limit arbitrary data in Bitcoin transactions, are also a point of discussion, with some critics arguing it could divide the community.

    The current market sentiment, characterized by a rotation out of stablecoins into assets with higher upside potential, suggests a cautious but engaged investor base. The upcoming days will be crucial for observing regulatory progress on the CLARITY Act and tracking institutional buying trends in Bitcoin and Ethereum, which could influence future market resilience.

    Why This Matters

    The materials describe a narrow update: The stablecoin market cap has decreased by over $10 billion since May, with funds reportedly rotating into memecoins. The exact impact of the CLARITY Act on digital asset classification.

    Broader Context

    Source materials place the factual news in this context: The article is dated July 12 and discusses recent events and potential future developments in the cryptocurrency market.

  • Binance Adjusts KORUUSDT Perpetual Contract Size

    Binance Adjusts KORUUSDT Perpetual Contract Size

    Binance Futures to Adjust KORUUSDT Contract Size Following Stock Dividend

    Binance Futures is set to adjust the contract size for its USDⓈ-Margined KORUUSDT Perpetual Contract on July 15, 2026, commencing at 00:15 UTC. This adjustment is necessitated by forward share splits of the underlying asset issuer’s issued and outstanding shares, structured as a stock dividend. The adjustment process is anticipated to conclude by 13:30 UTC on the same day, with a subsequent “cancel-only” phase that could last up to five minutes.

    Underlying Asset and Split Details

    The underlying asset for the KORUUSDT Perpetual Contract is the Direxion Daily South Korea Bull 3X ETF (NYSE Arca: KORU). The issuer has announced a 20-for-1 forward share split, implemented as a stock dividend. This means the adjustment scale factor will be 20.

    Impact on Open Positions and Trading

    During the adjustment period, all strategy bots, including Grid, DCA, and Snowball, linked to the KORUUSDT perpetual contract will be terminated and their positions automatically closed at 00:05 UTC on July 15, 2026. These positions will not be reinstated after the adjustment.

    Users with open positions will see their positions closed first, with unrealized profits and losses settled and credited to their Cross Margin Futures Account. For users in isolated margin mode, realized profits and all margin balances will be transferred to their Cross Margin Futures Account. Following the adjustment, new positions can be opened, with margin balances transferred to the Isolated Margin Futures Account based on the leverage level selected prior to the adjustment.

    The “cancel-only” phase will permit users to submit, modify, or cancel Post-Only orders. The duration of this phase will be determined by Binance, depending on market liquidity, and may extend up to five minutes.

    Chart and Data Continuity

    The continuous candlestick chart for the KORUUSDT perpetual contract will be retained and updated with the newly adjusted price. For time intervals of 12 hours and below, price charts prior to 00:00 UTC on July 15, 2026, will be corrected within the first week post-adjustment. For daily and longer time intervals, price chart corrections will be completed before the seventh day of the following calendar month.

    Trading Status and Timeline

    Binance Futures will provide real-time updates on the trading status of the contract. Users can check the latest information via API or the designated webpage.

    • Before July 15, 2026, 00:15 UTC: Continuous Trading Session State (TRADING)
    • July 15, 2026, 00:15 UTC to July 15, 2026, 13:30 UTC: Contract Size Adjustment process begins, with a Halt Session State (TRADING_HALT).
    • July 15, 2026, 13:30 UTC to July 15, 2026, 13:35 UTC: Cancel-only phase after adjustment completion, with a Cancel Only Session State (TRADINGCANCELONLY).
    • After July 15, 2026, 13:35 UTC: Trading functions resume under Continuous Trading Session State (TRADING).

    This announcement is made in accordance with relevant exchange and clearing rules. It is important to note that TradFi Perps are not affiliated with, sponsored, endorsed, or approved by the issuer of the underlying shares or the exchange where they are listed.