Tag: Market Trends

  • Cardano Price Surge: Bulls Poised for Dominance?

    Cardano Price Surge: Bulls Poised for Dominance?

    Cardano’s native token, ADA, has recently navigated a period of heightened volatility, ultimately seeing bulls regain control and push its price decisively above June’s lows. Analysts are now suggesting that ADA is positioned for a significant short-term rally, a scenario bolstered by recent activity from large token holders.

    The cryptocurrency market, including ADA, received a welcome boost from the latest US Consumer Price Index (CPI) data, which indicated that inflation in America has cooled more than anticipated. In the past 24 hours, ADA’s price has climbed by 3.5%, currently trading around $0.17.

    Adding to the positive momentum, a recent chart pattern has emerged, noted by X user CryptoJack. The formation of an inverse head-and-shoulders pattern, characterized by three distinct lows—a left shoulder, a deeper head, and a right shoulder—typically signals a weakening of selling pressure and an increasing dominance of buyers.

    Price Explosion Potential

    Analyst Celal Kucuker has put forth a bullish prediction, suggesting ADA could be on the cusp of a price surge towards a new all-time high of $5. Kucuker believes the market has found its bottom and anticipates the commencement of a “parabolic” rally.

    Whale Accumulation and Retail Exodus

    The optimistic outlook is further supported by the recent behavior of large ADA investors. As reported by CryptoPotato, whales holding between 100,000 and 100 million ADA have collectively increased their holdings to over 25.6 billion coins. Concurrently, smaller investors, those with fewer than 100 ADA, have reduced their exposure. While this combination of factors presents a healthy dynamic for the token, it does not guarantee an immediate price surge.

    Exchange Outflows and Reduced Selling Pressure

    Another factor contributing to the bullish sentiment is ADA’s exchange netflow. In recent weeks, consistent outflows from exchanges have surpassed inflows, suggesting a trend of investors moving their holdings from centralized platforms to self-custody solutions. This shift can lead to reduced immediate selling pressure on the market.

    Overbought Conditions on RSI

    However, ADA’s Relative Strength Index (RSI) presents a cautionary note within the current market setup. The technical indicator has risen above 70, signaling that the asset has entered overbought territory. This condition often precedes a potential pullback in the near future. The RSI ranges from 0 to 100, with readings below 30 typically considered a buying opportunity.

  • Binance XRP Holdings Dip to February Lows Amidst Ripple Price Support Defense

    Binance XRP Holdings Dip to February Lows Amidst Ripple Price Support Defense

    Binance XRP Reserves Hit Lowest Level Since February Amid Price Rebound

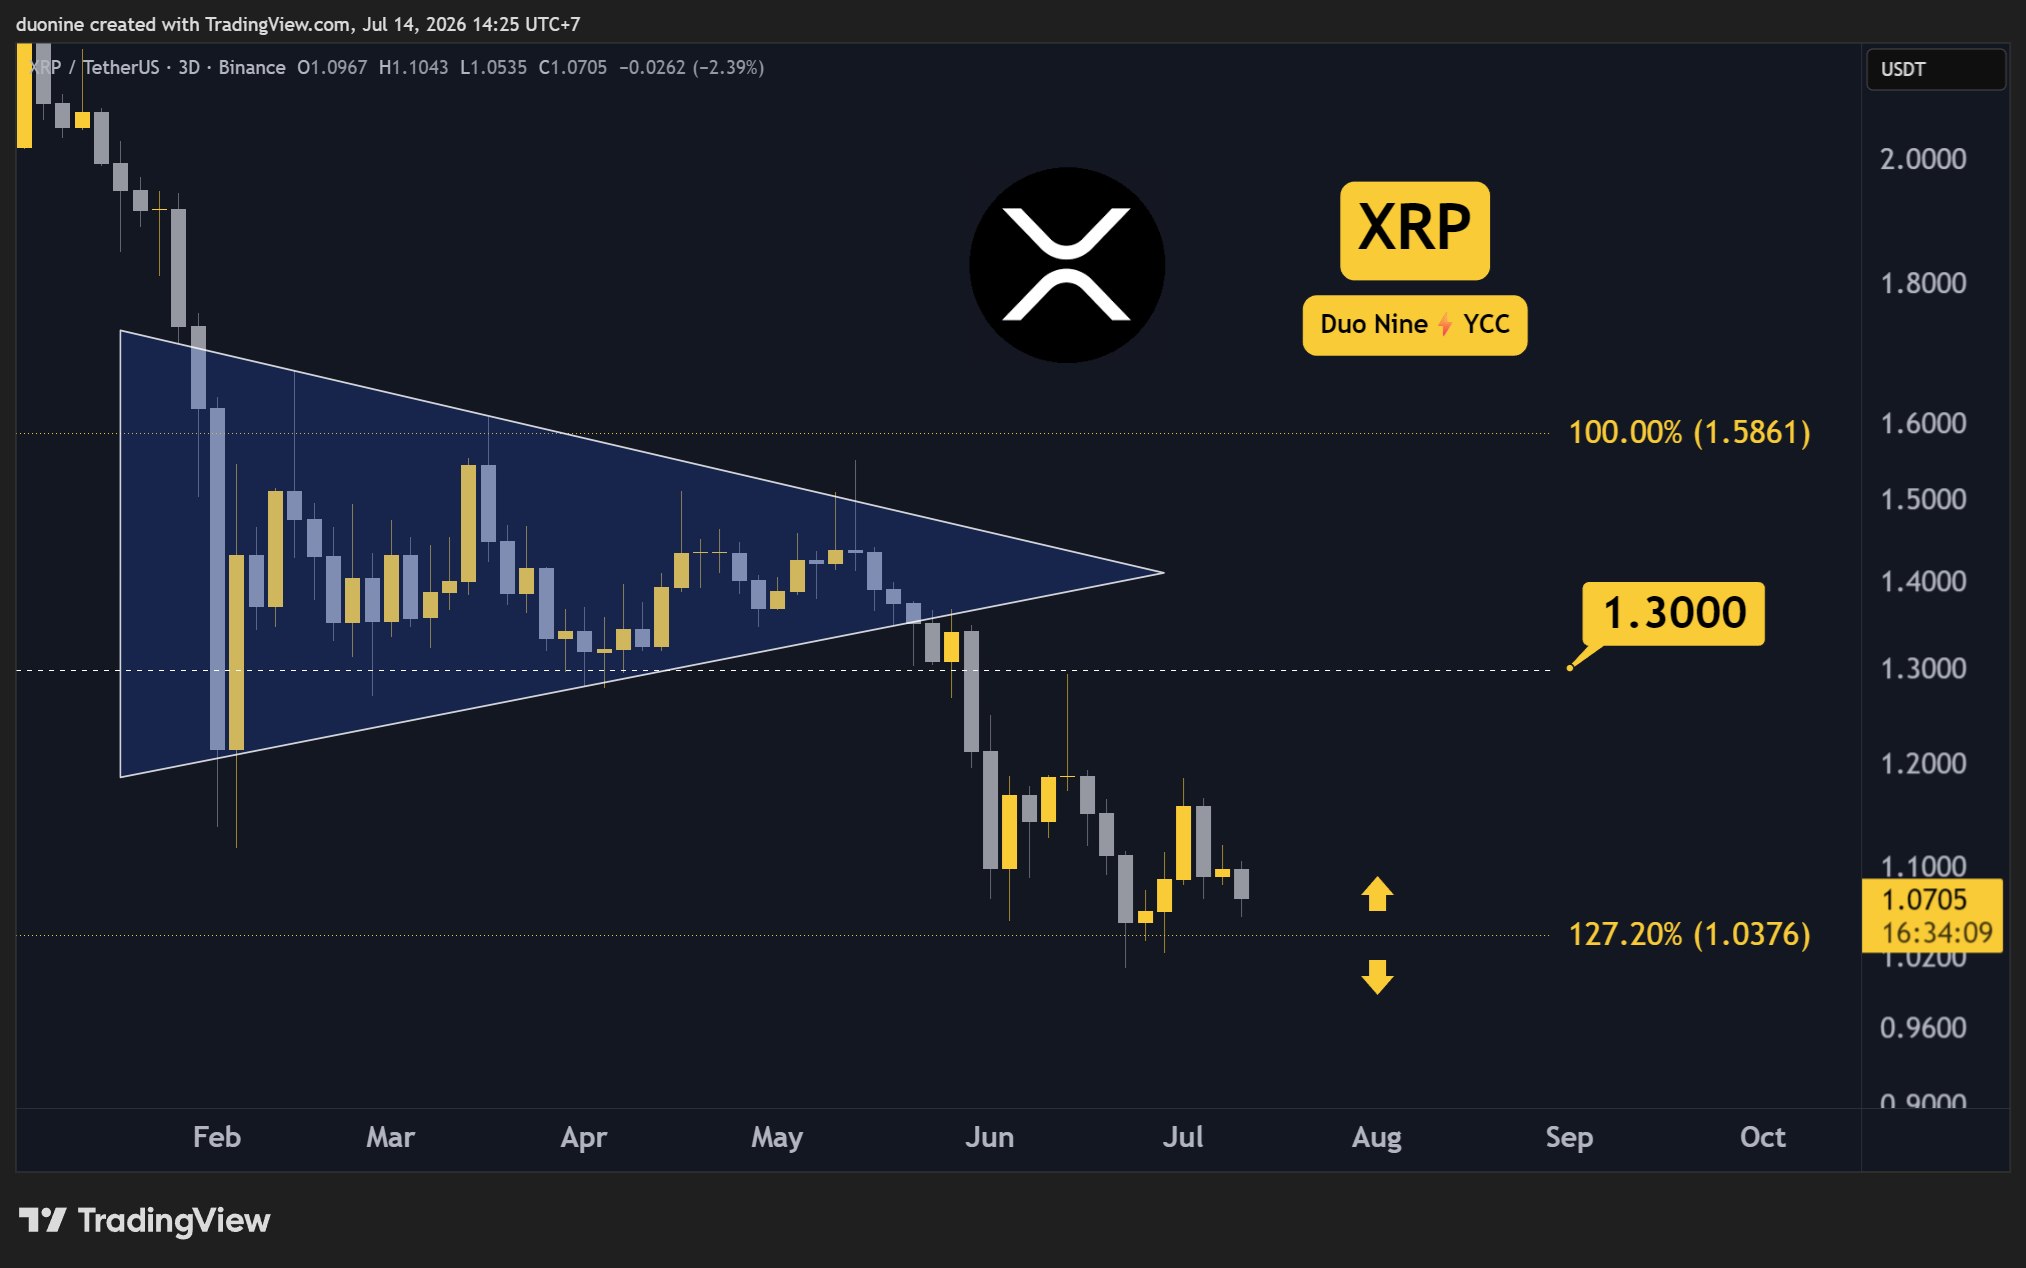
    Binance’s holdings of XRP have dwindled to approximately 2.61 billion tokens, marking their lowest point since February and remaining at this level since the beginning of July. This decline in exchange reserves has coincided with a recent uptick in XRP’s price, which has gained over 3% in the past 24 hours, reversing a downward trend that had seen the token approach $1.06.

    Exchange Balance Drains Amid Limited Inflows

    According to Arab Chain, a contributor to CryptoQuant, there have been no significant inflows to replenish Binance’s XRP reserves in recent months. This lack of replenishment is the primary reason the reserve figure has stabilized near its February low, rather than increasing.

    A decrease in exchange balances is often interpreted as a bullish signal, suggesting that investors are moving their holdings into private wallets rather than preparing to sell. However, this signal has taken time to manifest in price action. Arab Chain noted that XRP had been declining towards $1.06 while reserves were depleting, indicating that factors such as liquidity, trading activity, and investor sentiment were overriding the impact of reduced exchange supply.

    Cumulative Volume Delta Signals Selling Pressure

    In a separate market analysis, the same analysts examined the Binance CVD Confirmation Score, which combines price data with Cumulative Volume Delta (CVD) to gauge the dominance of buy or sell orders in the spot market. The current CVD reading stands at -6.93 million, indicating that sell orders have outweighed buy orders as XRP has fallen from above $2.00 earlier this year towards the $1.07 level.

    Short-Term Outlook Remains Cautious

    The 30-day Price-CVD Confirmation Score is currently hovering near 0.84. While Arab Chain describes this figure as “reasonably healthy,” they believe it falls short of confirming a genuine shift in buying demand. According to their analysis, a sustained move into positive CVD territory, coupled with a stronger confirmation score, would be necessary to signal a true reversal in buying interest.

    Despite these cautious indicators, XRP’s price has seen a modest improvement. Data from CoinGecko shows the asset trading around $1.11 at the time of writing, having gained approximately 3.7% in the last 24 hours and fluctuating between $1.07 and $1.12 during that period. However, the world’s sixth-largest cryptocurrency by market capitalization remains down 7% over the past month and over 61% year-over-year. Daily trading volume has surged by 31% compared to the previous day, reaching $1.26 billion.

    Divergent Market Predictions

    The current state of XRP has led to divided opinions among market observers regarding its future trajectory. Popular trader Diana has identified $1.08 as a critical level, warning that a breach of this support could lead to XRP falling to the $0.90-$0.93 zone before potentially reaching the macro support at $0.87. Analyst CasiTrades shares a similar technical outlook, viewing a potential drop to $0.87 as the conclusion of a year-long correction.

    Conversely, other analysts are looking beyond short-term price fluctuations. Crypto Patel suggests that XRP is forming a pattern that has historically preceded rallies exceeding 1,000%. Crypto investor Celal Kucuker pointed to a 500% monthly gain two years ago as a reason to remain optimistic about XRP reaching $7 by the end of the year.

  • Pi Network Price Surge: PI Jumps 10%

    Pi Network Price Surge: PI Jumps 10%

    PI Plummets 40% Amidst Sell-Off, Recovers 10% From Lows

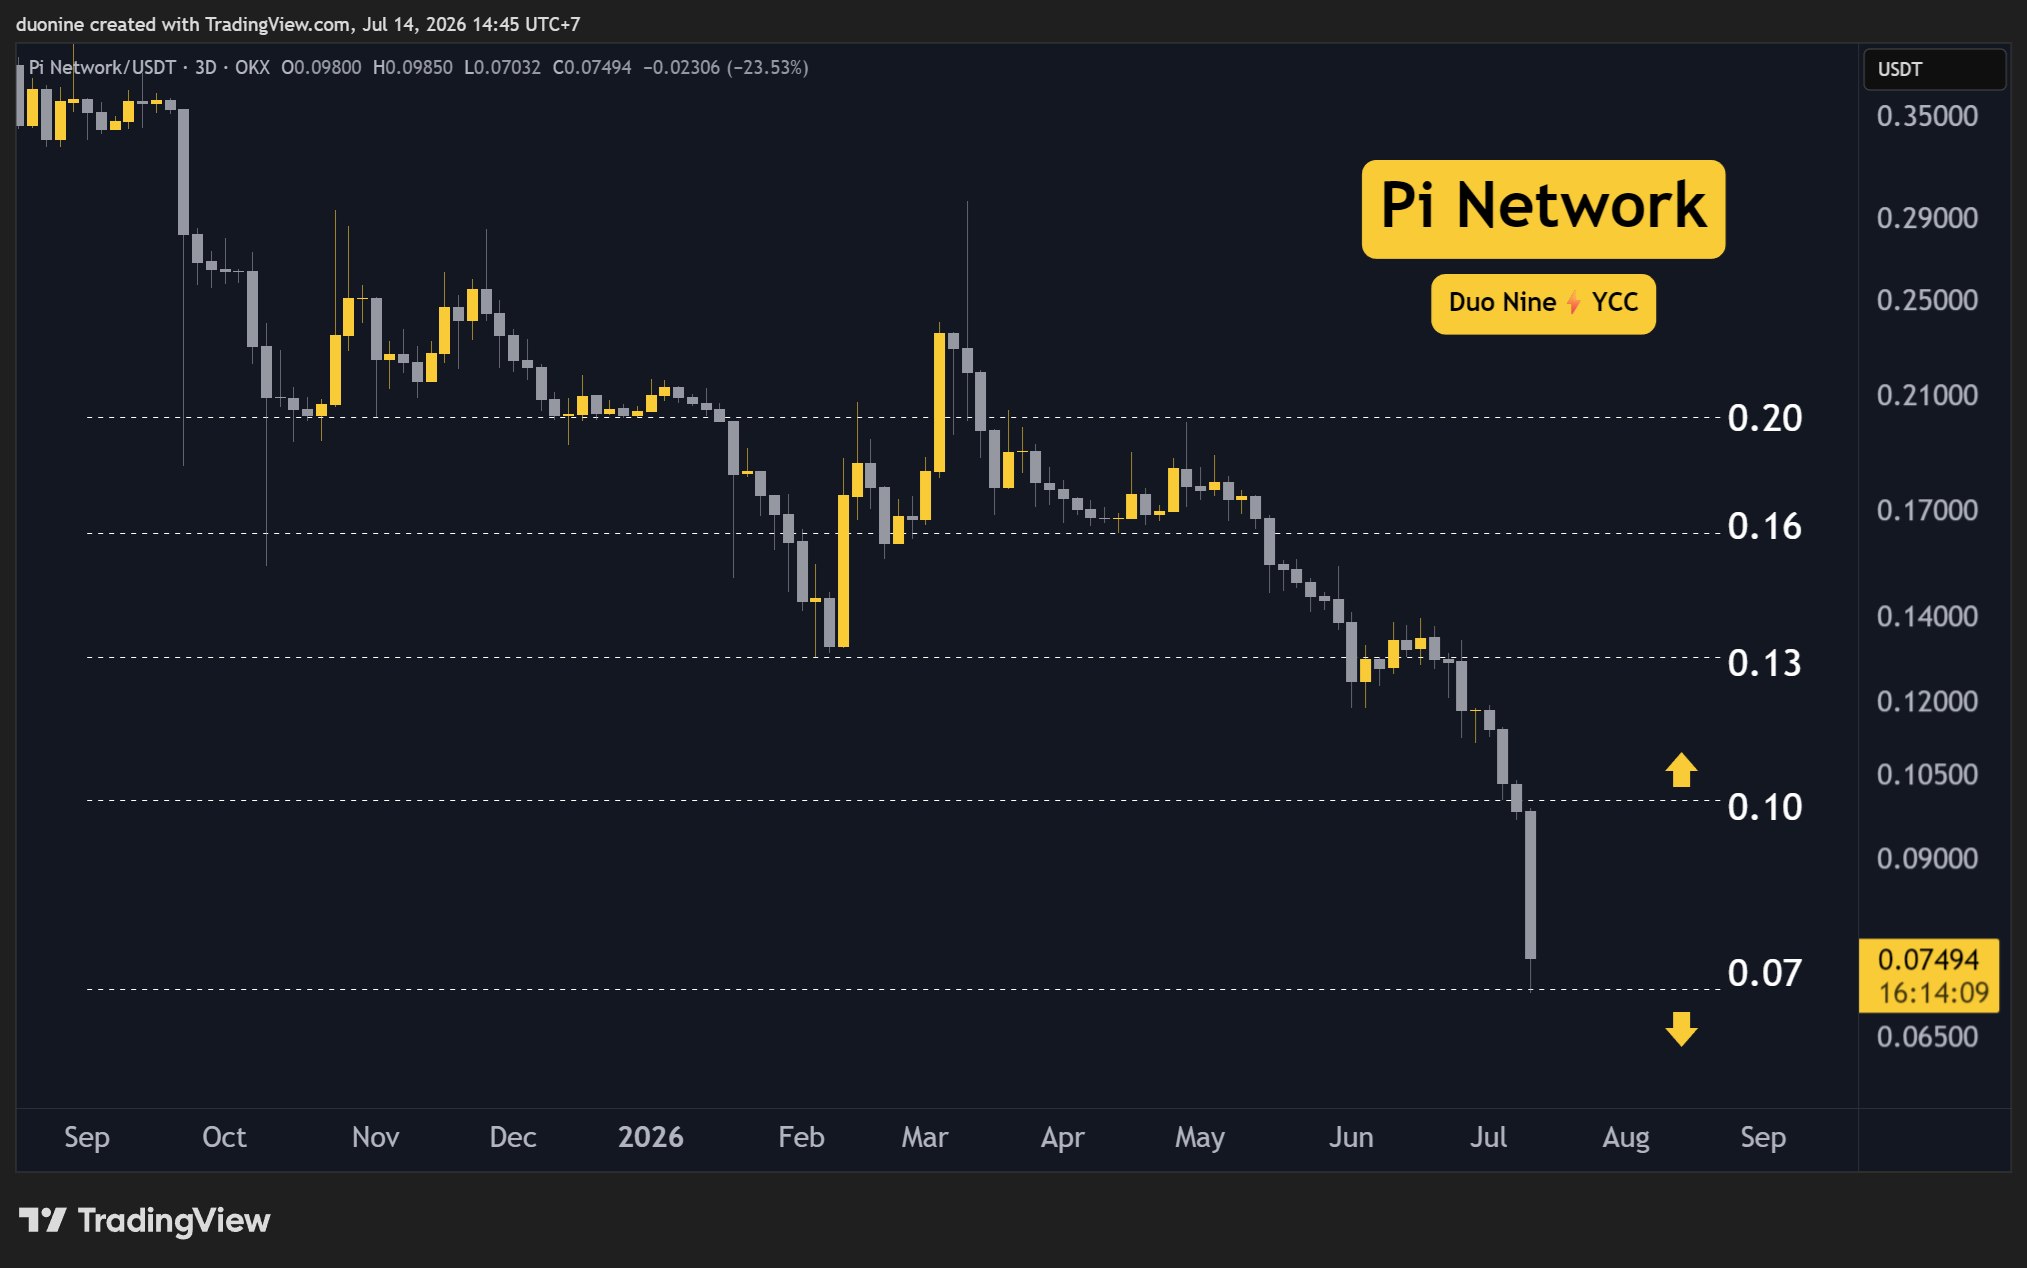
    The cryptocurrency PI experienced a dramatic 40% decline this week, driven by a significant sell-off that pushed its price to consecutive all-time lows. However, the asset has since rallied 10% from these troughs, prompting speculation about whether a market bottom has been established.

    Key Technical Levels

    Key support for PI is identified at $0.07, while resistance levels are positioned at $0.10, $0.13, and $0.16.

    Market Downturn and Investor Sentiment

    PI endured one of its most challenging weeks of 2026 after losing the critical support at $0.10. This level subsequently flipped to resistance, triggering a wave of selling pressure that sent the price into a sharp decline, ultimately reaching a new record low of $0.07.

    Investor confidence appears to have evaporated, with buyers largely absent from the market. Data from the past ten days shows only a single day closing in positive territory, underscoring an overwhelmingly bearish sentiment. This suggests the downtrend may be entering a new phase where a bottom could form more rapidly.

    Signs of a Potential Rebound

    In the past several hours, PI has shown signs of recovery, trading at $0.08 as of press time. However, it remains uncertain whether this represents a sustainable rebound or a temporary “dead-cat bounce.”

    Factors Contributing to the Decline

    The loss of support at $0.10 coincided with a surge in sell volume, exacerbating the downward spiral. This likely triggered cascading liquidations, further intensifying pressure on the declining price.

    While selling pressure has eased compared to the previous day, the market remains dynamic, and the situation could still shift. The price has held above $0.07 and seen a bounce to $0.08, but this could be a brief pause before further declines to new lows.

    Momentum Indicators and Future Outlook

    Heavy selling has driven momentum indicators to extreme levels. The daily Relative Strength Index (RSI) is currently at 12, a historically low point for this cryptocurrency. Such extreme readings can often signal potential market bottoms.

    The hope is that this price action will mark the end of the downtrend, allowing PI to consolidate and confirm a stable bottom. Should the support at $0.07 fail to hold, buyers may retreat further, with potential support levels at $0.06 or even $0.05. The immediate resistance remains at $0.10.

  • XRP Price Action Ambiguous: Key Levels and Technical Signals Under Scrutiny

    XRP Price Action Ambiguous: Key Levels and Technical Signals Under Scrutiny

    XRP’s price action this week presents a complex picture, with a recent dip below $1.07 followed by a rebound, yet key technical indicators offer only tentative signs of a potential reversal rather than a reported trend change. The cryptocurrency experienced a notable price drop, falling below the $1.07 mark, before staging a recovery. However, according to the analysis, XRP still needs to reclaim a key level before its price action can be considered more bullish.

    Downtrend and Rebound:

    XRP entered an evident downtrend in the weeks prior to the article, with sellers taking control of price action around the $1.18 level. This downtrend drove XRP to a low under $1.07. Although it appeared primed to retest the $1.00 support level, it has since rebounded swiftly, and there is no immediate danger in sight, as per the source. The current low is reported at $1.01.

    Technical Indicators Signal Potential:

    From a technical perspective, the data suggests two signals that could influence future price movements. Firstly, sell volume has been declining for months. This trend, according to the article, could provide buyers with an opening to regain control. Secondly, another interesting signal appears on the 3-day Relative Strength Index (RSI), which shows a clear bullish divergence. While the XRP price has been making lower lows, the RSI has been making higher lows. This is described as an early signal that could hint at a major reversal ahead.

    Conditions for Trend Shift:

    However, these signals are presented with significant caveats. To turn bullish on this price action, XRP will need to hold above the $1.00 support level and make a higher low. As long as buyers can prevent bears from reaching the $1.01 level, they have a chance to reverse the downtrend and regain momentum. This scenario would also require an increase in buy volume, the article states.

    Key levels to watch include the support at $1.00 and resistance levels at $1.3, $1.6, and $2. For a bullish reversal to be reported, XRP’s correction needs to stop at $1.00 and then slowly recover its most recent losses. A higher high above $1.18 would serve as confirmation, according to the analysis.

    Navigating Uncertainty:

    It remains uncertain whether the $1.00 level will ultimately act as support or turn into resistance. It is too early to definitively call the price action bearish until this level is tested as resistance. Buyers will have another opportunity to show up at this key level and push bears away. The current price action is characterized by ambiguity, with potential upside indicated by technical divergence, but contingent on holding critical support and demonstrating sustained buying pressure. The market is watching to see if XRP can consolidate above $1.00 and build momentum for a sustained recovery.

    Why This Matters

    The materials describe a narrow update: XRP’s price fell below $1. Whether the $1.00 level will turn into resistance.

    Broader Context

    Source materials place the market analysis in this context: XRP’s price dipped below $1.07 yesterday, but the impressive market rebound helped it erase most losses. However, it still needs to reclaim a key level before it turns more bullish.

  • Market Reassesses Corporate Bitcoin Demand Amid Scrutiny of Funding Conditions and Uncertainties

    Market Reassesses Corporate Bitcoin Demand Amid Scrutiny of Funding Conditions and Uncertainties

    The market’s perception of corporate Bitcoin treasury demand is undergoing a shift, moving away from a sole focus on accumulation volume towards a more critical evaluation of the underlying financial conditions and risks that enable these holdings. This reassessment, according to QCP Capital, was catalyzed by a relatively small sale of Bitcoin by Strategy in late May.

    While Strategy’s sale of 32 BTC was immaterial compared to its substantial holdings of 846,842 BTC, it challenged a long-held market assumption: that corporate treasuries would exclusively buy Bitcoin and never sell. This event prompted investors to question whether these treasury holdings were truly untouchable. Even after Strategy resumed buying within weeks, the market’s reaction indicated a greater focus on the funding capacity, balance-sheet liquidity, and overall confidence in the corporate treasury model, rather than solely on the volume of accumulation. The exact timing and magnitude of future corporate Bitcoin purchases remain uncertain, as do the stability of ETF inflows into Bitcoin, the future pricing of preferred securities and convertible instruments related to Strategy, and the future premium on Strategy’s ability to raise capital.

    Corporate Holdings and Strategy’s Dominance

    Public companies collectively hold approximately 1.26 million BTC, with Strategy accounting for roughly two-thirds of this total. This concentration means that Strategy’s actions, issuance conditions, and reserve policies significantly influence Bitcoin sentiment beyond their direct impact on the spot market. In Q2, the financial structures supporting corporate Bitcoin accumulation came under increased scrutiny. Instead of relying on purchase announcements, investors are now closely monitoring metrics such as mark-to-market net asset value (mNAV), equity issuance, preferred demand, convertible capacity, and cash reserves to gauge treasury demand. The future cash reserves of companies holding Bitcoin are also a point of uncertainty.

    Financial Health and Funding Conditions

    QCP Capital explained that favorable funding conditions allow companies to raise capital, expand their Bitcoin reserves, and reinforce confidence in the treasury model. Conversely, tightening conditions can create cash needs due to recurring preferred-stock obligations, as potentially indicated by Strategy’s May sale. Despite these concerns, Strategy’s equity continues to trade above the combined value of its Bitcoin net asset value and U.S. dollar reserves, suggesting a premium on its ability to raise capital, even with approximately $22.2 billion in preferred securities and convertible instruments ranking ahead of its common equity.

    Future Outlook and Potential Risks

    Looking ahead to Q3, QCP Capital outlined potential scenarios for Bitcoin. Their base case anticipates Bitcoin trading between $60,000 and $75,000, supported by stabilizing ETF inflows and corporate treasury demand. A sustained reclaim of $75,000 could potentially drive prices toward $80,000-$82,000. However, the firm warned that renewed ETF outflows, a stronger dollar, or rising real yields could lead to a break below $58,000-$60,000, signaling a more bearish outlook. The precise impact of a stronger dollar or rising real yields on Bitcoin prices remains uncertain. It is also uncertain whether Strategy will become a major seller of Bitcoin in the future.

    Bitwise CIO Matt Hougan also commented on Strategy’s future influence, suggesting that the company is unlikely to dominate Bitcoin demand in the next market cycle as it has previously. Hougan does not anticipate Strategy becoming a major seller, viewing it as a net buyer if crypto asset prices recover.

    Continued net accumulation by Strategy and other public companies, coupled with stabilizing ETF inflows, could strengthen Bitcoin’s absorption capacity and help repair market confidence. However, QCP warned that slower purchases, weaker preferred pricing, a compressed mNAV premium, or declining cash reserves would indicate growing stress, potentially making the corporate treasury bid more selective and increasing sentiment risk. The market’s focus has undeniably shifted, requiring a deeper dive into the financial health and sustainability of corporate Bitcoin holdings.

    Why This Matters

    The materials describe a narrow update: Strategy’s sale of 32 BTC in late May, despite being a small amount relative to its holdings, challenged the market’s assumption that corporate treasuries only buy Bitcoin and never sell. The exact timing and magnitude of future corporate Bitcoin purchases.

    Broader Context

    Source materials place the market analysis in this context: Corporate treasury demand remains one of Bitcoin’s most important structural sources of support.

  • Bitcoin Price Predictions Vary Widely Amidst Market Uncertainty and Mixed Signals

    Bitcoin Price Predictions Vary Widely Amidst Market Uncertainty and Mixed Signals

    Bitcoin’s future price is subject to a wide range of predictions, with AI models and financial institutions offering forecasts that span from a potential $100,000 by the end of 2026 to a bearish target of $42,000. These divergent outlooks are occurring against a backdrop of mixed market signals, including recent ETF flows, investor sentiment indicators, and technical chart patterns, underscoring significant uncertainty in the cryptocurrency’s trajectory. The exact timing and impact of the FOMC meeting on July 28-29 remain uncertain, as do the ability of buyers to reclaim key resistance levels and the realization of bearish technical patterns.

    According to Claude Fable 5, an AI model, the bull case price target for Bitcoin is $100,000 by the close of 2026. Standard Chartered also carries a $100,000 year-end target and views current price dips as a potential buying opportunity. However, other analyses present a more cautious or bearish outlook. Citi recently revised its 12-month target for Bitcoin downwards, from $112,000 to $82,000, and now anticipates zero new ETF inflows for a full year. Furthermore, a head and shoulders pattern identified on the 3-day chart suggests a potential measured move towards $42,000 if the Fibonacci neckline at $55,298 is breached.

    Market sentiment, as measured by the Fear and Greed index, currently stands at 23, indicating ‘Extreme Fear.’ This level of fear has historically been interpreted by some as an entry point for conviction. Despite this, June saw significant outflows from Bitcoin ETFs, totaling $4.5 billion, marking it as the worst ETF month on record. This contrasts with a positive inflow of $221 million reported on July 2, which was the first positive inflow in ten sessions. At the time of reporting, Bitcoin was priced at $62,155, down 2.49% on the day, with a session high of $64,385 and a low of $61,750. Spot ETFs currently hold approximately $80 billion in Bitcoin.

    Technical indicators suggest fading momentum. The Relative Strength Index (RSI) is reading near 42, with its signal line around 46. This pattern, where momentum fades beneath its average and bounces are sold, is interpreted by some analysts as exhaustion rather than capitulation. For Bitcoin to reach the $100,000 target, buyers would need to reclaim the $68,000 resistance level and maintain support at $59,500.

    Macroeconomic factors also play a crucial role in shaping the outlook. The upcoming FOMC meeting on July 28-29 is seen as a potential catalyst. A dovish pivot from the Federal Open Market Committee could weaken the U.S. dollar, compress yields, and potentially drive institutional capital back into risk assets like cryptocurrencies.

    PlanB and Glassnode have flagged Q4 2026 as the likeliest window for a Bitcoin bottom. Historical price action indicates that Bitcoin topped near $126,000 in October 2025 and has since formed lower highs. A significant structural break was observed in February when the price dropped through $84,000, followed by a failed rally to approximately $82,000 in May.

    The inherent uncertainties surrounding Bitcoin’s future price remain substantial. The potential impact of the FOMC meeting, the ability of buyers to overcome key resistance levels, and the realization of bearish technical patterns all contribute to a complex and unpredictable market environment. The long-term impact of ETF ownership on Bitcoin’s traditional four-year cycles is also a subject of ongoing debate, with some analysts suggesting the cycle may be lengthening and becoming shallower.

    Why This Matters

    The materials describe a narrow update: Various AI models and financial institutions have issued price predictions for Bitcoin, ranging from bullish targets of $100,000 to bearish targets of $42,000, with differing analyses on ETF flows, market sentiment, and technical patterns. The exact timing and impact of the FOMC meeting on July 28-29.

    Broader Context

    Source materials place the factual news in this context: The article discusses predictions for Bitcoin’s price by various AI models and financial institutions.

  • Binance Capital Connect Introduces Express Interest-Only Mode

    Binance Capital Connect Introduces Express Interest-Only Mode

    Binance Introduces “Express Interest Only” Mode on Capital Connect

    Binance is launching “Express Interest Only” (EIO) mode on Capital Connect, a pioneering portfolio marketplace designed to connect professional trading teams with institutional investors. This new feature aims to provide a compliant avenue for trading teams to showcase their performance history to institutional investors, while simultaneously offering investors an early look at emerging strategies before they are officially available for investment.

    EIO Mode Functionality

    Under EIO mode, investment in portfolios is not directly available. Instead, institutional investors can submit non-binding expressions of interest. Trading teams will then receive anonymized demand signals via email notifications.

    Alongside the introduction of EIO mode, Capital Connect’s portfolio detail pages have been enhanced with more comprehensive performance metrics, detailed portfolio composition data, and information about the trading teams. These updates apply to both active and EIO portfolios. Access to this enhanced dashboard is restricted to whitelisted Capital Connect investors.

    EIO mode serves as a view-only listing for trading teams that have not yet obtained the necessary licenses to offer their strategies to external investors. This allows them to gauge interest from verified Capital Connect investors before undertaking the licensing process required to become fully open to investors on the platform.

    Key features of EIO mode include:

    • Visible Performance Data: Investors can access the same detailed performance metrics as active portfolios, including multi-period returns, risk metrics, Net Asset Value (NAV) history, and portfolio composition.
    • No Investment Available: All investment functionalities, such as subscribe and redeem options, are disabled.
    • Marketplace Badge: All EIO listings will be clearly marked with an “Express Interest Only” badge on the marketplace.
    • Restricted Visibility: EIO portfolios are only visible to logged-in, verified professional investors who meet Capital Connect’s qualification criteria. Users who are not logged in or do not meet these requirements will not be able to view EIO listings.
    • Limited Duration: Trading teams can remain in EIO mode for a limited period. The EIO mode expires after six months and may be extended for an additional three months, subject to review.

    How to Express Interest

    Investors can browse EIO portfolios alongside active portfolios, viewing full performance data. To express interest, users click “Express Interest” and complete a brief form. These submissions are non-binding, do not grant investment access, and do not guarantee direct contact with the trading team.

    For trading teams, EIO mode offers a way to showcase their performance track record to KYB-verified professional investors on Capital Connect. They will receive anonymized email notifications when an investor submits an interest form. It is important to note that investment and direct investor contact are unavailable while in EIO mode.

    Pathway to Active Status

    Trading teams operating in EIO mode are required to pursue the necessary licensing to transition to active status. Once licensed and after maintaining a 30-day active track record on Capital Connect, their portfolios can be moved to active status.

    Existing Portfolio Account Trading Teams are advised to contact their dedicated Account Manager. Binance will review applications before listing strategies in EIO mode. New entities must complete KYB onboarding and configure their Portfolio Account before applying for an EIO mode listing. Detailed onboarding instructions are available from dedicated Account Managers.

    Investors can access the Capital Connect marketplace directly on Binance. KYB-verified users who are VIP 3 or above are eligible to access Capital Connect, including EIO portfolios.

  • XRP Tests Key Support Level Amid Divergent Analyst Views and Institutional Selling

    XRP Tests Key Support Level Amid Divergent Analyst Views and Institutional Selling

    XRP is currently trading around the $1.07 mark, testing a critical support level, a situation met with sharply divergent outlooks from market analysts. Institutional investors have also recently begun reducing their exposure to the cryptocurrency, adding to the prevailing uncertainty.

    XRP at a Crossroads
    The cryptocurrency space is closely watching XRP’s price action as it hovers near a significant support level. As of press time, XRP is valued at approximately $1.07, reflecting a 5% decrease over the past week. Whether XRP will continue to fall or rebound to new highs remains uncertain.

    Divergent Analyst Outlooks
    Analysts are divided on XRP’s future trajectory. Some foresee a potential move below the $1 mark, with some market observers suggesting a possible decline toward the $0.90-$0.93 liquidity zone, potentially extending to a macro support level around $0.87. These views suggest that the current market structure may favor sellers and could lead to further downward price movement.

    Conversely, other market participants remain optimistic, pointing to historical patterns that have previously preceded significant rallies. Some analysts believe XRP could be repeating a macro pattern that has coincided with substantial gains in the past, with projections of a return to new all-time highs. Speculation exists regarding a potential price of $7 by year-end, though such targets are considered ambitious by some.

    Institutional Investor Behavior Shift
    Recent weeks have seen a shift in institutional investor behavior. Up until the beginning of July, inflows into spot XRP Exchange-Traded Products (ETPs) consistently surpassed outflows. However, this trend has reversed, with pension funds, hedge funds, and other conservative investors reportedly reducing their exposure. This has reportedly forced entities such as Bitwise, Canary Capital, Franklin Templeton, 21Shares, and Grayscale to sell XRP to maintain the proper backing of their shares.

    Navigating Uncertainty
    This institutional selling pressure adds a layer of complexity to the market analysis. While positive online sentiment regarding XRP has surged recently, the actions of these larger investors suggest a more cautious approach. The waning interest in spot XRP ETPs in recent weeks contrasts with the persistent loyalty often associated with the XRP community.

    The divergence in analyst opinions highlights the inherent uncertainty in the cryptocurrency market. While some foresee a continuation of the bear market for XRP, others anticipate a potential rebound. The possibility of XRP reaching new all-time highs, potentially above $9, is discussed, though the required market capitalization for such a surge, exceeding $350 billion, is viewed by some as a significant hurdle.

    Navigating this period of uncertainty requires careful consideration of all available signals. The current price action at a key support level, coupled with the contrasting views of market analysts and the recent actions of institutional investors, underscores the speculative nature of XRP and the broader crypto space. The future direction of XRP remains a subject of considerable debate, with no clear consensus emerging from the current market data.

    Why This Matters

    The materials describe a narrow update: XRP is currently trading around $1. Whether XRP will continue to fall or rebound to new highs.

    Broader Context

    Source materials place the market analysis in this context: Ripple’s cross-border token remains one of the most talked-about topics in the crypto space.

  • Perplexity AI Forecasts XRP Price Surge by End of 2026

    Perplexity AI Forecasts XRP Price Surge by End of 2026

    Perplexity AI has projected a bullish future for XRP, forecasting a price range of $3 to $5 by 2026, a significant leap from its current trading price of $1.06. This prediction suggests a potential near fivefold increase for a cryptocurrency that has experienced a year-long decline.

    The Bull Case for XRP

    The optimistic outlook for XRP hinges on its transition from a speculative trading asset to a functional utility token. Perplexity AI highlights several key factors: sustained institutional demand, consistent ETF inflows, and increasing transaction volume on Ripple’s payment network.

    These elements, when combined, could create a “supply shock” amplified by a narrative repricing, a combination historically known to drive substantial price appreciation. The stability of ETF investments is particularly noteworthy, as they are less prone to rapid divestment during market downturns compared to “hot money.” If Ripple’s payment network continues to absorb XRP from speculative markets, a shrinking supply coupled with growing interest could fuel significant price gains.

    Achieving a $3 price target from $1.06 does not require extraordinary market events, but rather a single quarter where the narrative surrounding XRP aligns with actual transaction flows.

    The Bear Case for XRP

    Conversely, the bearish outlook for XRP is currently more strongly supported by market data. Perplexity AI identifies a scenario where inflows diminish, adoption lags behind expectations, and overall cryptocurrency market risk appetite weakens.

    In such a climate, XRP could become trapped between $1 and $1.50, despite ongoing optimistic pronouncements. This price range has largely defined XRP’s trajectory since February, and recent market activity offers little indication that this consolidation will break to the upside.

    XRP is currently in a pronounced downtrend, having peaked near $3.66 in August 2025 and consistently printing lower highs each month since. Significant structural breaks occurred with the decline through $2.40 in October and the sharp drop below $1.20 in February. Since February, XRP has traded within a range of approximately $1.30 to $1.60 before breaking lower in June. This pattern suggests a descending channel, with continuation of this trend being the most probable scenario until evidence to the contrary emerges.

    As of the latest close, XRP was trading at $1.06696, down 1.70% for the session. Immediate support is identified at $1.05, with psychological support at $1.00. Resistance levels are situated at $1.20, $1.40, and the February high of $1.60.

    The Relative Strength Index (RSI) stands at approximately 41, with its signal line near 45, indicating negative momentum as the indicator continues to trend below its average. This suggests a gradual decline rather than an imminent bottom.

    For Perplexity AI’s bullish price prediction to materialize, XRP must first reclaim the $1.20 resistance level and then break through $1.60. Until then, the $1 to $1.50 range remains the most likely forecast based on current chart patterns.

    The Search for the Next Catalyst

    Major cryptocurrencies like Bitcoin, Ethereum, and XRP have been testing similar resistance levels for weeks. The catalyst for the next significant upward movement is often perceived to be just one data release away. Institutional inflows are consistently anticipated for the following quarter, and traders awaiting a breakout are essentially waiting for decisions made on other entities’ balance sheets.

    Early-Stage Infrastructure Plays

    In contrast, early-stage infrastructure projects operate under different dynamics. Capital that might be negligible at Bitcoin’s scale can significantly impact smaller, undiscovered projects. The potential for asymmetric returns lies in the discrepancy between a project’s intrinsic value and its current market valuation, a gap that exists because the project has yet to gain widespread recognition. Once discovered, this gap tends to close.

    Addressing Cross-Chain Fragmentation

    Cross-chain fragmentation has been a persistent issue in decentralized finance (DeFi) since the advent of blockchain bridges. Major networks like Bitcoin, Ethereum, and Solana were designed as independent systems with no inherent interoperability. Transactions between these networks incur costs in the form of fees, slippage, and execution failures. Bridges, intended as solutions, have instead become mechanisms for extracting value.

    LiquidChain aims to eliminate these fees by operating three networks within a single execution layer, allowing for unified deployment and interaction without a “cross-chain tax.” Perplexity AI has identified LiquidChain as a project worth monitoring. Its presale is currently priced at $0.01454, with over $860,000 raised.

    However, LiquidChain’s execution remains unproven, and its adoption is uncertain. Established assets offer predictable returns with clearly defined upside limits. LiquidChain, on the other hand, represents an entry point that may disappear once it gains market traction.

  • Binance Marks Ninth Anniversary with 323 Million Users, Expands into Traditional Financial Products

    Binance Marks Ninth Anniversary with 323 Million Users, Expands into Traditional Financial Products

    Binance, the global cryptocurrency exchange, is celebrating its ninth anniversary, reporting a significant milestone of 323 million registered users worldwide. The company also announced its strategic expansion into traditional financial products, including direct stock trading and tokenized U.S. equities, according to the firm’s report.

    Launched in July 2017, Binance has grown to operate in over 100 countries. The exchange’s user base now represents approximately 43% of the estimated 741 million global cryptocurrency owners. In the first half of 2026, Binance saw a 7% increase in registered users and a 9% rise in institutional users. This growth in user activity was accompanied by substantial trading volumes. Binance’s cumulative trading volume has reached $156 trillion, with an additional $11.4 trillion added in the first six months of 2026. Total trading activity in this period was 7.8% higher than at the end of 2025.

    Diversification into Traditional Finance

    The company’s diversification into traditional finance has shown early traction. Monthly trading volume for Binance’s traditional finance offerings has exceeded $80 billion since March. In June, Binance introduced direct stock trading, which achieved $1 billion in assets under management within 30 days of its launch and generated over $3 billion in cumulative trading volume. Furthermore, Binance’s tokenized U.S. equities, known as bStocks, reached $100 million in assets under management within two weeks of their introduction. Notably, 47% of bStocks trading activity occurred outside regular U.S. market hours.

    Binance stated its aim to serve both retail users and institutional participants through a wider range of financial products. Recent launches, including stocks and tokenized assets, support Binance’s goal of improving access to global markets. The company also launched a community campaign called “Built by You” with up to $4.5 million in rewards.

    Binance’s expansion into traditional financial products, alongside its substantial user growth, signifies a strategic pivot. This move leverages its extensive user base to tap into new market segments. The anniversary comes as regulatory frameworks continue to evolve in major markets and institutional participation in digital assets remains a key industry trend.

    Broader Context

    Source materials place the factual news in this context: The anniversary comes as regulatory frameworks continue to evolve in major markets and institutional participation in digital assets remains a key industry trend.

    Significance of the Developments

    Binance’s ninth anniversary is marked by significant user growth to 323 million globally and the expansion of its offerings to include traditional financial products such as direct stock trading and tokenized U.S. equities. The growth in user activity was accompanied by higher trading volumes, with monthly trading volume for traditional finance offerings exceeding $80 billion since March. The introduction of direct stock trading and tokenized equities has shown early traction, with substantial assets under management and trading volumes reported within weeks of launch. These developments indicate Binance’s strategic diversification beyond cryptocurrency, leveraging its established user base to enter new financial markets. The reported metrics do not suggest price direction or market shifts.