Tag: Market Trends

  • XRP, XLM Eye Breakouts: Which Will Hold?

    XRP, XLM Eye Breakouts: Which Will Hold?

    Ripple (XRP) is trading near $1.04–$1.06 with minimal movement in the past 24 hours. In contrast, Stellar (XLM) is showing more immediate strength, currently priced at $0.18 with a 3.91% gain for the day. This divergence is reigniting the classic XRP versus XLM debate among relative-value traders.

    Looking ahead to 2026, both assets have attempted to break out of multi-week consolidation periods, but neither has yet confirmed sustained upward momentum. The key question is not the existence of momentum, but whether either cryptocurrency possesses sufficient structural support to prevent a retreat back into their previous trading ranges.

    Coinpedia characterized the recent price action as “a massive upswing as bullish momentum revives after weeks of consolidation,” framing it as a technical breakout attempt rather than a definitive trend shift.

    XRP faces significant resistance between $1.30 and $1.37. Stellar’s immediate hurdle is at $0.22–$0.23; a clean reclaim of this level could pave the way toward $0.26 and subsequently $0.30. The XRP/XLM trading pair is currently at 7.59, up 2.15%, indicating that XRP still holds relative value dominance within the pair, even as XLM demonstrates stronger short-term momentum.

    The price action at these critical inflection points over the next few trading sessions will likely determine whether traders are witnessing a sustained rally or a potential bull trap in a market highly sensitive to headlines.

    XRP’s Technical Outlook

    XRP’s technical chart suggests a short-term correction within a broader breakout attempt. TradingView data places XRP’s price at approximately $1.058. The near-term support zone is identified between $1.08 and $1.10, a floor that must hold for any bullish scenario to remain viable.

    A confirmed bounce from this support zone, accompanied by increased trading volume, would bring the $1.30 level back into play. Some price models projecting significantly higher targets by the end of 2026 assume this resistance band will be cleared without substantial selling pressure.

    Bull Case: XRP reclaims $1.10, consolidates briefly, and then pushes towards the $1.30–$1.37 resistance on strong volume. A decisive break above this band could open the door to $1.45 and $1.60.

    Base Case: The price consolidates between $1.04 and $1.20 for another week, forming a tighter base before initiating a directional move.

    Bear Case (Invalidation): A close below $1.04 with subsequent selling pressure would reintroduce the possibility of a return to sub-$1.00 levels.

    Stellar’s (XLM) Setup

    XLM’s technical setup appears cleaner in percentage terms. Starting from its current price of $0.18, with immediate resistance at $0.22–$0.23, a 22–28% move to the first key target is achievable if the breakout is sustained.

    The Stellar network’s inherent utility in cross-border transactions provides a macro narrative that could attract institutional investment once risk appetite returns. However, at this juncture, the price action on the chart is the primary driver.

    Traders should monitor $0.18 as a critical support level. A failure to hold this price on any pullback would shift the market interpretation from “breakout confirmed” to “consolidation continues.” While both scenarios have merit, XLM’s current setup is more binary.

    Market Cap and Future Potential

    With XRP at $1.06 and XLM at $0.18, both cryptocurrencies already represent significant market capitalizations. Even a clean breakout to $1.45 for XRP or $0.26 for XLM would represent incremental gains from their current levels.

    Traders who entered these positions earlier are experiencing compressed upside potential relative to their entry risk. This reality highlights the growing appeal of early-stage infrastructure projects.

    LiquidChain ($LIQUID) Emerges

    LiquidChain ($LIQUID) is a Layer 3 infrastructure project positioning itself as a cross-chain liquidity layer. Its unique selling proposition is the fusion of liquidity from Bitcoin, Ethereum, and Solana into a single execution environment, enabling developers to deploy applications once and access all three ecosystems.

    According to the project’s presale data, $LIQUID is currently priced at $0.01475, with $880,132.41 raised to date. Key features include a Unified Liquidity Layer, Single-Step Execution, Verifiable Settlement, and a Deploy-Once Architecture. These infrastructure-level components address a significant fragmentation issue across the three largest ecosystems by liquidity depth.

  • XRP Surges as FOMO Hits 3-Month Peak

    XRP Surges as FOMO Hits 3-Month Peak

    XRP Holds Key Support Amidst Growing Optimism and Network Activity

    XRP is currently trading near $1.04, maintaining its position above the critical $1.00 support level. This comes after the cryptocurrency experienced a dip to a 19-month low of approximately $1.01 on June 25.

    Despite recent price volatility, data from analytics firm Santiment indicates sustained interest in the XRP Ledger. The network saw 4,941 new wallet creations in a single day, marking the highest level of network growth in over three months. Santiment noted that this surge in new users entering the ecosystem occurred while XRP’s price was under pressure.

    Concurrently, social sentiment surrounding XRP has shifted towards optimism. Santiment’s analysis reveals a ratio of 3.7 bullish comments for every bearish comment, the most positive sentiment observed in three months. This suggests that many traders are viewing the $1.00-$1.05 price range as an opportunity to buy the dip, reflecting a growing fear of missing out (FOMO).

    Santiment attributes this optimism to several factors, including XRP’s historical ability to rebound after significant price drops, ongoing discussions about Exchange-Traded Funds (ETFs) and institutional adoption, and observations that larger holders have continued to accumulate assets during the downturn. The firm emphasized the importance of monitoring whether the increase in new wallets translates into sustained buying demand or proves to be a short-term FOMO-driven trend.

    In parallel, separate data from CryptoQuant highlights a shift in whale activity. While overall whale activity on centralized exchanges has become more prominent, its concentration on Binance has decreased. Whales appear to be diversifying their trading activities across multiple platforms.

    Even as XRP’s price faces challenges, investment products linked to the cryptocurrency have attracted new capital. On June 29, U.S.-based spot XRP ETFs recorded net inflows totaling $15.34 million. The Bitwise XRP ETF led these inflows with $11.94 million, followed by Canary XRPC with $3.40 million.

    Cumulatively, June’s inflows for spot XRP ETFs have exceeded $62 million, bringing the total net inflows across all such products to $1.48 billion, according to data compiled by SoSoValue.

  • Altcoins Plummet: 84% Show ‘Total Underperformance’

    Altcoins Plummet: 84% Show ‘Total Underperformance’

    Altcoins Face Prolonged Downturn, Analysts Divided on Future Prospects

    The altcoin market has borne the brunt of the ongoing bear market, with a staggering 84% of these digital assets trading below their 200-day moving average and exhibiting a “state of total underperformance,” according to insights from CryptoQuant analyst ‘Darkfost’ on Tuesday.

    Darkfost noted that “every attempt at a momentum recovery has failed outright,” and the total market capitalization for altcoins, excluding Ethereum, continues to decline. A weekly close below the 200-day moving average has now been confirmed, marking a significant downturn. This prolonged period of stagnation, which has battered altcoins for the past eight months, represents the second-longest underperformance streak observed since 2020. The analyst described the situation as a “prolonged period of stagnation across the majority of altcoins, one that is pushing investors to their limits.”

    However, Darkfost concluded on a cautiously optimistic note, suggesting that such periods have “historically also presented medium-term opportunities.” He cautioned, though, that identifying these opportunities “demands significantly more rigorous asset selection” compared to previous market cycles.

    Market Capitalization and Performance Metrics

    The broader cryptocurrency market has seen its capitalization shrink by approximately 51% from its peak, currently standing at $2.15 trillion. Within this landscape, high-capitalization altcoins such as BNB, XRP, and Solana have experienced declines ranging from 60% to 75% from their respective peaks. The majority of lower-cap altcoins have fared even worse, with losses between 80% and 90% from their all-time highs.

    Despite the widespread downturn, the top three altcoin season indexes are currently hovering between 48 and 51 out of 100, indicating a neutral sentiment.

    Contrasting Outlooks Emerge

    In contrast to the somber assessment of altcoins’ current performance, permabull analyst ‘Sykodelic’ expressed a bullish outlook, stating that “things are shaping up very well for altcoins.” He acknowledged the difficulty in believing this given the “soul-destroying performance of alts over the last few years,” but insisted that “things really are looking very constructive here,” as he remarked on Monday.

    This optimistic view is partially supported by technical analysis, which shows the 1-week MACD entering positive territory for the first time in over two years. The chart is reportedly forming a “strong bottom position,” mirroring the market bottom observed in the 2020 cycle.

    Brief Market Movements

    While most altcoins remain at bear-market lows, a few have seen marginal gains today, including Solana, Hyperliquid, and Zcash. Bitcoin briefly reclaimed the $60,000 mark but fell back below this psychological level during the Tuesday morning Asian trading session. Similarly, Ether managed to surpass $1,600 following a purchase by Bitmine, but this recovery was short-lived, with the asset trading at $1,590 at the time of writing.

  • Analyst Disputes Ripple CEO’s Strategy: ‘Two Giants, Same Model’

    Analyst Disputes Ripple CEO’s Strategy: ‘Two Giants, Same Model’

    Crypto Analyst Challenges Ripple CEO’s Stance on MicroStrategy’s Bitcoin Strategy

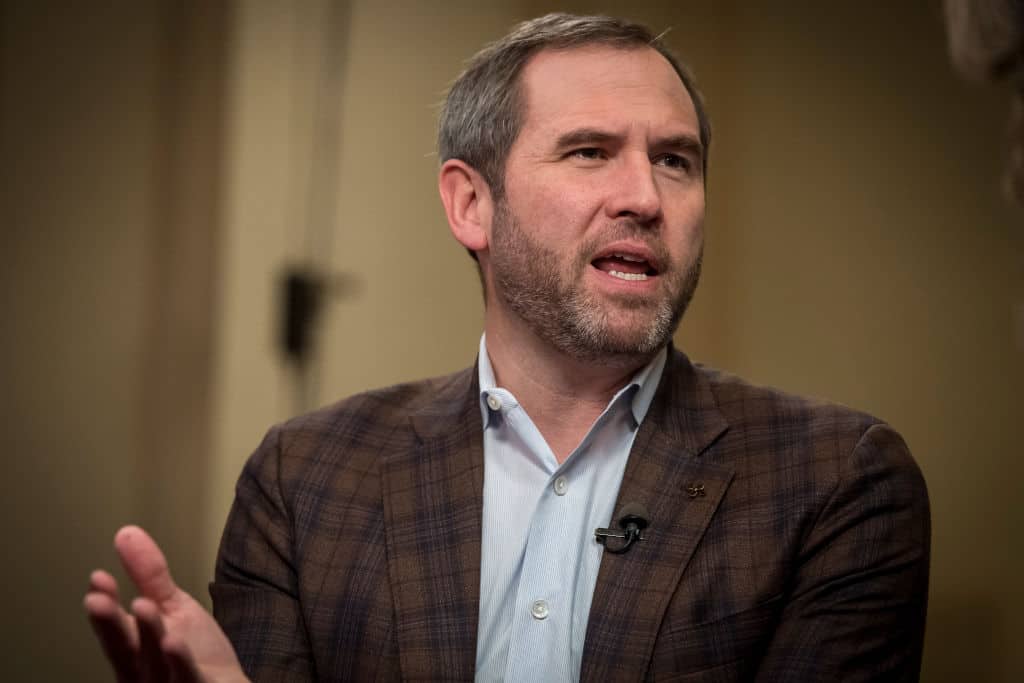
    As the cryptocurrency community continues to weigh in on MicroStrategy’s recent decisions regarding its Bitcoin holdings, trader Merlijn has pushed back against the views expressed by Ripple CEO Brad Garlinghouse.

    In a public statement on Twitter, Merlijn directly addressed Garlinghouse’s comments about MicroStrategy’s recent Bitcoin sale. Merlijn argued that both Ripple and the business intelligence firm employ comparable funding models, suggesting that Garlinghouse is in no position to criticize MicroStrategy and its CEO, Michael Saylor, given their similar market approaches.

    Over the weekend, reports indicated that Garlinghouse stated in a CNBC interview that MicroStrategy’s Bitcoin strategy was detrimental to the crypto market. The prominent Bitcoin treasury firm had recently halted its consistent Bitcoin purchasing streak and divested a portion of its holdings. This move generated significant market reaction, as MicroStrategy has been a key driver of Bitcoin demand.

    Although MicroStrategy has since resumed its Bitcoin purchases, the earlier sale drew considerable criticism from prominent figures and market experts. Garlinghouse contended that Saylor had not adequately focused on developing a strategy centered on Bitcoin’s inherent strengths. He suggested that while MicroStrategy’s purchasing model fueled market enthusiasm during Bitcoin’s rallies, the same approach is now exacerbating losses as the asset declines.

    According to the Ripple CEO, MicroStrategy has been utilizing a leveraged purchasing model through its Class A common stock, STRC. With STRC trading approximately 25% below its par value of $100, the market is beginning to observe the negative compounding effects of MicroStrategy’s model during Bitcoin corrections. Garlinghouse believes MicroStrategy should prioritize creating long-term value and utility rather than engaging in financial engineering via its Bitcoin funding strategy.

    While Merlijn acknowledged that Garlinghouse’s concerns about STRC’s performance are valid, the trader asserted that the Ripple CEO should not be targeting Saylor. Merlijn pointed out that Ripple itself funds its operations by selling XRP from escrow on a monthly basis, a model that Merlijn considers similar to MicroStrategy’s.

    From Merlijn’s perspective, MicroStrategy and Ripple are two major entities with analogous funding models that rely on the very markets they operate within. Given that both companies’ funding strategies contribute to selling pressure on their respective assets, Merlijn questioned the rationale behind Garlinghouse’s criticism. The trader found it particularly ironic that Garlinghouse, who does not adhere to the “never sell your XRP” principle, would admonish MicroStrategy for a single Bitcoin sale.

  • Coinbase Plunges 62% After Jim Cramer’s PARC Basket Recommendation

    Coinbase Plunges 62% After Jim Cramer’s PARC Basket Recommendation

    Cramer’s “PARC” Basket Falters as Key Stocks Plummet

    Nearly a year after CNBC’s “Mad Money” host Jim Cramer christened a group of four stocks – Palantir (PLTR), Applovin (APP), Robinhood (HOOD), and Coinbase (COIN) – as the “PARC” basket, three of the quartet have seen significant declines or stagnation.

    The initial grouping, coined on July 14, 2025, led many in the financial industry to interpret Cramer’s move as a bullish signal for the cryptocurrency sector. However, the stock most intrinsically linked to crypto has now experienced the steepest fall. Cramer had described the PARC stocks as those retail investors had “anointed and taken up without any real bounds,” framing the market at the time as bifurcated between the S&P 500 and these momentum-driven names.

    Coinbase Leads the Decline

    New performance data, shared on X by market commentator Heisenberg on June 29, 2026, reveals that Coinbase has been the worst performer since Cramer’s announcement, shedding 62% of its value.

    Yahoo Finance data indicates that over the past 52 weeks, Coinbase’s stock has fluctuated between $139 and $444. It is currently trading near the lower end of this range, around $149, a stark contrast to the strong investor conviction that accompanied its inclusion in Cramer’s basket. Notably, Donald Trump’s financial disclosure in May showed that the former president purchased Coinbase shares between January and March of this year, though these transactions were managed by third-party financial institutions.

    Palantir and Robinhood Lag

    Palantir has also struggled, declining approximately 25% since the “PARC” acronym was introduced, and has fallen about 40% in 2026 alone. Its 52-week high was around $207, and it was trading near $113 at the time of this report.

    Robinhood, meanwhile, has remained largely flat. This performance could be considered a relative success given the steep drops experienced by other members of the group. Earlier this month, Robinhood expanded into the Canadian crypto market with its $180 million acquisition of WonderFi, now boasting over 1 million international funded customers. However, this expansion has not significantly boosted its stock price.

    Applovin Stands Out

    Applovin is the sole outlier in the PARC basket, having genuinely delivered positive returns with a 34% increase since the group was named. Despite this gain, its current price of around $477 remains well below its one-year high of $745. Nevertheless, compared to its PARC counterparts, Applovin’s performance is a clear exception.

    A “CRAP” Forecast?

    In 2025, Cramer had considered two similar acronyms: PARC and CARP (Coinbase, Applovin, Robinhood, Palantir). However, some observers humorously proposed a third: CRAP. A year later, this alternative acronym appears to have been a more accurate predictor of the stocks’ performance.

    Analyst Shanaka Anslem Perera commented on this development via X, stating, “The acronym arrived at the precise moment conviction in these names ran hottest, and the year that followed turned a throwaway joke into a price chart. CRAP was never an insult. It was the forecast, written a year early.”

  • XRP Whales Shift Holdings, Binance Loses Favor

    XRP Whales Shift Holdings, Binance Loses Favor

    XRP Whales Shifting Away from Binance, Data Suggests

    Large transfers of XRP are increasingly dominating activity across centralized exchanges, though their presence on Binance has notably diminished. Data tracking the 7-day moving average of the XRP Whale vs. Retail Spread across all centralized exchanges shows a significant rise, climbing from 26% on May 6 to 50.9% by June 29 – an increase of 24.9 percentage points.

    According to analytics firm CryptoQuant, this trend indicates that transactions involving more than 100,000 XRP now constitute a substantially larger portion of exchange outflows compared to smaller, retail-sized transactions, a shift from the dynamics observed in early May.

    However, Binance presents a contrasting picture. CryptoQuant data reveals that the exchange’s Whale vs. Retail Spread decreased from 62% on June 11 to 44.6% on June 29, a drop of 17.4 percentage points. This places Binance’s current reading 6.3 percentage points below the broader centralized exchange average of 50.9%.

    The Whale vs. Retail Spread metric quantifies the difference between XRP outflow volumes from transfers exceeding 100,000 XRP and those involving 100,000 XRP or less. Higher readings signify that whale-sized transactions represent a greater share of exchange outflows relative to retail transfers.

    This divergence suggests that large XRP transfers are becoming less concentrated on Binance and are instead being distributed across a wider array of trading platforms.

    XRP has faced considerable pressure throughout June, declining from over $1.30 at the month’s outset to approximately $1.05 at the time of reporting. Despite a brief mid-June recovery, the upward momentum proved unsustainable as sellers reasserted control, pushing prices lower once more. The cryptocurrency even saw its market capitalization fall behind that of BNB and USDC. With XRP currently testing the critical $1.06 support level, previously identified by analyst Ali Martinez, the asset now faces potential downside to lower support areas at $0.80, $0.62, and $0.51.

    Concurrently, data from Glassnode indicates that XRP investors are currently realizing more losses than profits. Despite this prevailing weakness, some analysts maintain an optimistic outlook. EGRAG CRYPTO, for instance, projects that if XRP adheres to historical price patterns associated with its “Central Line,” the asset could potentially reach between $5.70 and $8, drawing parallels to gains observed in previous market cycles.

  • VELVET Altcoin Surges 1,700% in a Month: Rally Continues or Peak?

    VELVET Altcoin Surges 1,700% in a Month: Rally Continues or Peak?

    Viral Altcoin VELVET Surges 1,700% in a Month: A Path to Further Gains or a Looming Collapse?

    Despite a prolonged bear market gripping the cryptocurrency sector, certain tokens are defying the trend with substantial upward momentum. Velvet (VELVET) stands out as a prime example, having experienced quadruple-digit growth over the past month. While some market observers anticipate continued short-term gains, others caution that the altcoin could represent a significant risk.

    As of this report, VELVET is trading around $1.58, according to CoinGecko. This represents a 250% increase on a weekly basis and a remarkable 1,700% surge over the last 30 days. Its market capitalization has climbed to nearly $700 million, positioning VELVET as the 90th-largest cryptocurrency by market value.

    One factor potentially fueling this price surge is the project’s collaboration with AerodromeeFi. An announcement stated that the integration offers users “tighter pricing,” “less slippage,” access to “deeper liquidity on every trade,” and the ability to “land better fills, automatically.”

    Subsequently, the project unveiled Velvet-1, an Artificial Intelligence (AI) model designed for on-chain intelligence, which may have also contributed to the positive price action.

    Several analysts have noted the coin’s impressive performance and suggest it may have further room for growth. X user Crypto With Gopal observed that the price “is tightening inside a Symmetrical Triangle after a sharp bullish impulse,” indicating a potential loss of control by sellers and setting a short-term target of $2.1.

    The analyst known as The Boss also offered an optimistic outlook, arguing that recent breakout attempts demonstrate sustained buyer activity following consolidation, rather than an immediate reversal of gains. The analyst described the current market structure as “healthier than it did 24 hours ago, with the chart transitioning from recovery mode into expansion mode.” They concluded, “If momentum persists and volume follows through, the market could begin testing higher liquidity zones that were previously rejected during the first impulsive move earlier this month.”

    Conversely, a significant number of analysts advise caution, believing investors should steer clear of the altcoin due to the potential for a sharp decline. Yesterday, June 28, X user Crypto with Haris ₿ predicted that VELVET could plummet to $0.90 within the next six hours, labeling the situation a “generational short opportunity.” This prediction did not materialize.

    Vuori Trading, meanwhile, characterized the token as another “Binance Alpha aka. CZ scam.” This analyst suggested that while the token appears to be approaching its peak, a move above $2 could trigger an explosive rally to $8.

    Adding to the bearish sentiment, the coin’s Relative Strength Index (RSI) has surpassed 80, indicating that VELVET has entered extremely overbought territory. This technical indicator, which ranges from 0 to 100 with readings below 30 typically signaling a buying opportunity, suggests the asset could be poised for a significant correction.

  • Copilot AI Forecasts Massive Bitcoin Surge by 2026

    Copilot AI Forecasts Massive Bitcoin Surge by 2026

    Microsoft Copilot AI has presented a comprehensive outlook on Bitcoin’s price trajectory, suggesting the current market stands at a critical juncture. The AI model forecasts a realistic base scenario of $100,000 to $130,000 by the close of 2026. In a more optimistic “bull case,” the price could surge to $150,000 to $180,000, provided certain conditions align favorably.

    A Pivotal Inflection Point

    Bitcoin is currently trading around $59,800, a level the AI model identifies as a pivotal inflection point. This position signifies a transition between short-term volatility and sustained long-term structural demand.

    Several enduring forces underpin the bull case, rather than relying on a single, short-lived catalyst.

    • Digital Gold Narrative: Institutional investors continue to view Bitcoin as a form of “digital gold.” This perception has strengthened as traditional capital increasingly seeks assets that can act as a hedge against inflation.
    • ETF Demand: Demand from Bitcoin Exchange-Traded Funds (ETFs) remains robust, even amidst recent outflows. This suggests that the core buyer base has not abandoned the market, despite potentially volatile headlines.
    • Halving Impact: The lingering effects of the 2024 Bitcoin halving are also significant. With daily issuance reduced to approximately 450 BTC, supply is tightening precisely as global liquidity is anticipated to ease.

    The AI model posits that if macroeconomic conditions become genuinely supportive, adoption accelerates beyond expectations, and long-term investors gain prominence over short-term traders, the combination of these factors could propel Bitcoin’s price toward the $150,000 to $180,000 range.

    The Bear Case Scenario

    Conversely, the AI model also outlines a plausible bear case. Should prevailing macroeconomic headwinds, such as prolonged high interest rates, a recessionary shock, or renewed regulatory crackdowns, dominate the financial landscape, Bitcoin could remain confined to a range of $55,000 to $75,000 for an extended period.

    This scenario would imply a considerably longer wait for the structural bull case to materialize, with the price essentially trading sideways as these headwinds are resolved.

    Current Market Dynamics

    On a daily chart, Bitcoin is trading at approximately $59,887. This follows a significant decline from highs near $128,000 reached in October. The downtrend has been persistent, punctuated by a relief rally in May that peaked near $83,000 before reversing into the current period of weakness.

    For the past several weeks, Bitcoin’s price has been consolidating in the high $50,000s to low $60,000s, aligning closely with the $59,800 level identified as the pivotal point in the AI’s prediction. This type of tight, prolonged consolidation around a psychologically significant number often indicates a market awaiting a definitive catalyst rather than committing to a particular direction.

    Immediate resistance is observed near $64,000, a level that has been tested and failed multiple times recently. A more substantial ceiling lies further up, around $76,000, where the May rally ultimately lost momentum.

    Support is holding in the $58,000 to $59,000 zone, an area Bitcoin is currently testing. The broader market structure remains a clear downtrend dating back to October, characterized by lower highs and lower lows throughout the move.

    Momentum on the daily charts appears subdued rather than decisive, with small, choppy candles clustering near the lows, indicating a lack of strong directional conviction.

    Given the precise alignment of the current price with the predicted inflection point, the next decisive break above $64,000 or below $58,000 is likely to signal which trajectory—the base or bull case—will begin to unfold.

    A Shift in Capital Allocation

    The market is already experiencing a rotation, though its full implications may only become apparent in hindsight. Large-cap cryptocurrencies are not failing but are instead facing limitations in their upside potential. Bitcoin, Ethereum, and XRP have been consolidating against similar resistance levels for weeks, while anticipated macroeconomic tailwinds continue to be delayed.

    Institutional inflows are being postponed to subsequent quarters. Holding assets whose upside is contingent on uncontrollable catalysts is less a strategy and more a form of waiting. Capital that has weathered multiple market cycles tends to move proactively rather than waiting for destinations to become obvious.

    Early-stage infrastructure projects operate on a different economic model. Their smaller market capitalization means that even modest capital rotations can lead to significant price movements. This asymmetry arises because the market has not yet fully priced in the potential of these nascent developments. The returns are generated from the gap between current valuations and the true worth of the project.

    The fragmentation of multi-chain ecosystems imposes substantial costs on decentralized finance (DeFi) daily. Bitcoin, Ethereum, and Solana maintain isolated liquidity systems with no native interoperability. Users transferring value between these ecosystems incur direct costs through fees, slippage, and failed transactions.

    LiquidChain aims to unify these three networks into a single execution layer, enabling one deployment and full ecosystem access without cross-chain transaction taxes. The market has yet to discover this solution, which is the core of its potential.

    The LiquidChain presale is currently priced at $0.01454, having raised over $840,000. This represents an early stage in its lifecycle, with inherent risks such as unproven execution and unknown adoption rates. While established assets offer a more predictable path to a visible ceiling, this opportunity provides an earlier entry into a project still in its foundational phase.

  • XRP Faces Crucial Decision as Calm Precedes Potential Volatility

    XRP Faces Crucial Decision as Calm Precedes Potential Volatility

    XRP Faces Intense Selling Pressure Amidst Broader Crypto Downturn

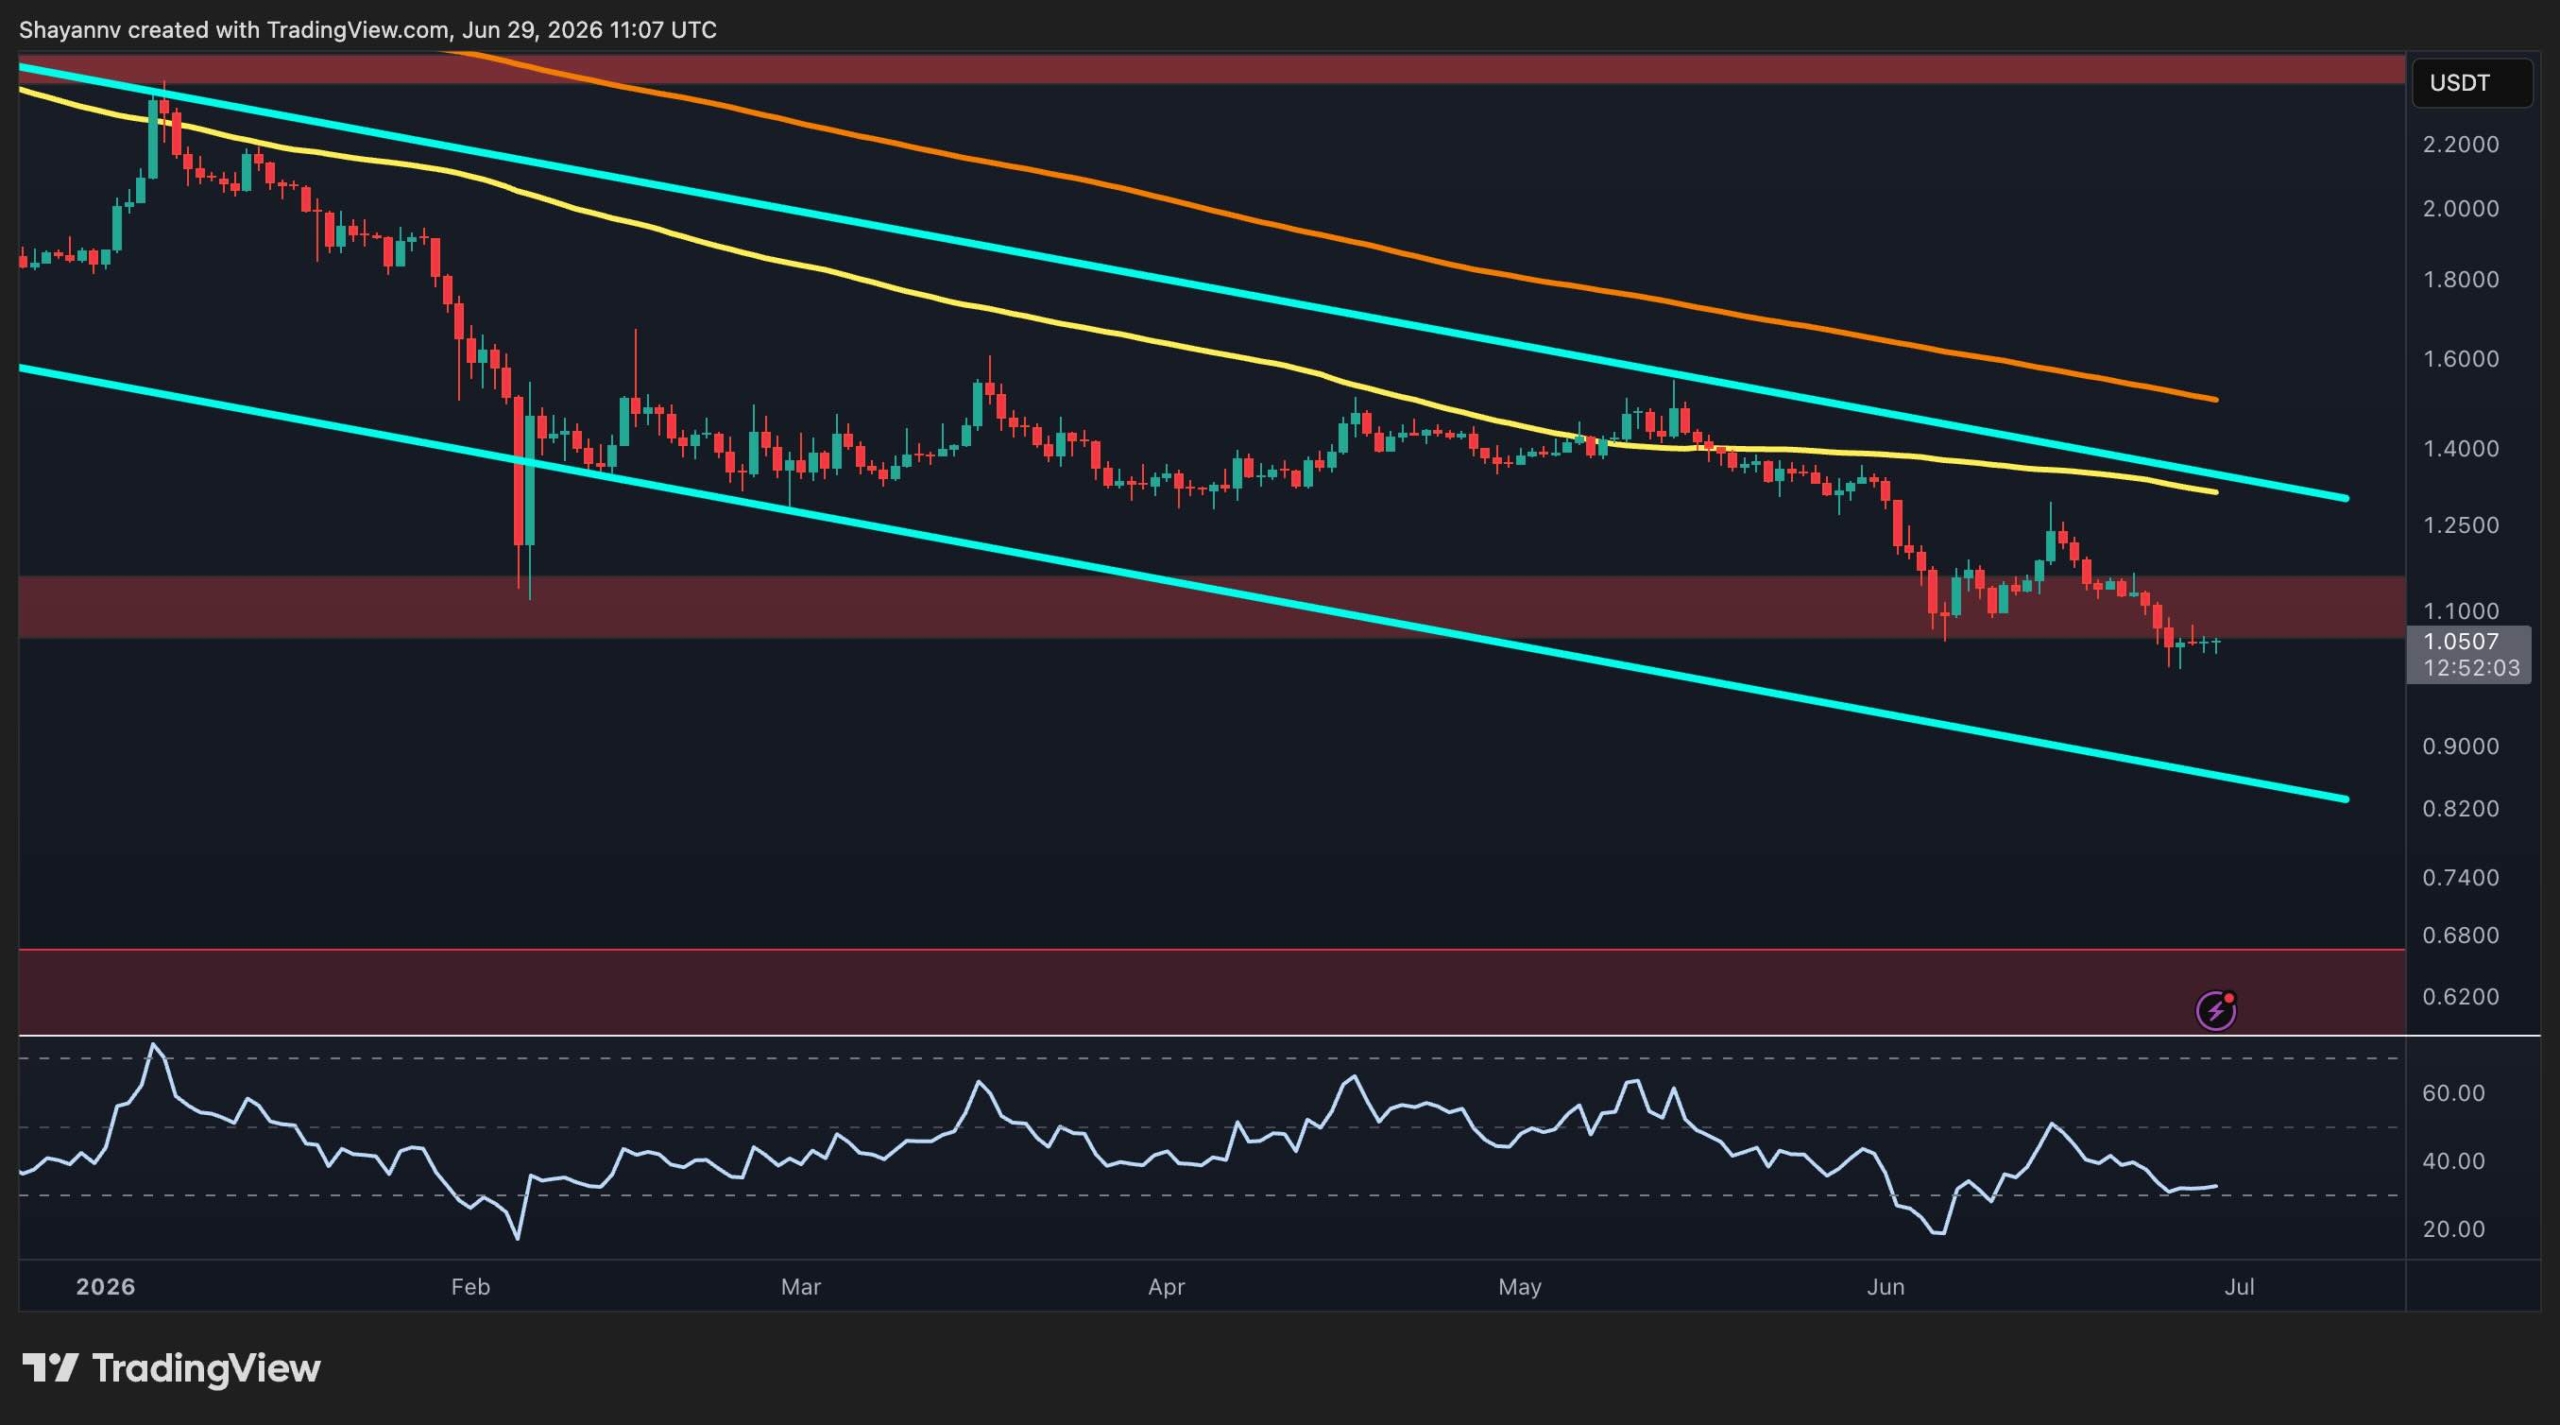
    XRP is currently experiencing significant selling pressure, a trend that mirrors the broader cryptocurrency market. Both its trading pairs against Tether (USDT) and Bitcoin (BTC) are entrenched in clear downtrend structures. While the dollar-denominated pair is testing a critical demand zone, the BTC pair is hovering just above a key support level, placing the market at a pivotal juncture.

    XRP/USD Analysis

    On the daily chart, XRP continues to exhibit its established bearish structure, remaining confined within a long-term descending channel. The digital asset is presently trading around the $1.05 mark, having failed to establish higher lows in recent weeks, a clear indication of sustained seller dominance on higher timeframes.

    The most significant support for XRP/USD is now situated between $1.00 and $1.10, an area where the price is attempting to find stability. This zone has historically attracted buying interest and could potentially trigger a relief bounce if buyers successfully defend it. However, the overarching trend remains bearish, with XRP trading below both its 100-day and 200-day moving averages. These averages are both sloping downwards, serving as dynamic resistance levels.

    Any attempt at a recovery is likely to encounter its initial hurdle around the 100-day moving average, which is positioned near the $1.30 level and aligns with the upper boundary of the descending channel. A decisive break above both this channel resistance and the moving average would be necessary to signal a meaningful shift in the market’s structure.

    Conversely, a failure to hold the current support area could expose XRP to the lower boundary of the descending channel, located near the $0.80 region. This makes the current support zone particularly crucial for the medium-term outlook.

    XRP/BTC Analysis

    Against Bitcoin, XRP continues to underperform, with the XRP/BTC pair firmly entrenched within its own descending channel. The pair is currently trading at approximately 1,750 satoshis, sitting directly above a horizontal support level that has repeatedly halted deeper declines since May.

    Despite this support holding on multiple occasions, none of the subsequent rebounds have resulted in a clear bullish breakout, underscoring persistent selling pressure and a lack of sustained upward momentum. Repeated rejections near the 100-day moving average further reinforce the bearish structure.

    On the upside, the first major horizontal resistance is observed around 1,850 satoshis, which converges with the declining 100-day moving average. Above this, stronger resistance emerges near 2,000 satoshis, followed by the descending 200-day moving average and the upper channel resistance. As long as XRP remains below these resistance clusters, the trend against Bitcoin suggests continued relative weakness.

    On the downside, a confirmed breakdown below the 1,700 satoshis support region would likely invalidate the current consolidation pattern and pave the way for another downward leg towards the psychological support level around 1,500 satoshis, and potentially lower. This positions XRP at a critical decision point on both its USDT and BTC charts, as buyers and sellers vie for dominance over the prevailing trend.

  • Bitmine Acquires 27,000 ETH Amid Market Downturn, Nearing 5% of Supply

    Bitmine Acquires 27,000 ETH Amid Market Downturn, Nearing 5% of Supply

    Bitmine Expands Ethereum Holdings Amid Market Downturn

    [City, Date] – Bitmine Immersion Technologies, a prominent former Bitcoin miner, has once again increased its Ethereum holdings. The move comes during a week where the cryptocurrency experienced a significant slump, falling by over 8% and hitting a multi-month low of $1,500 before finding some support.

    The company now holds just over 5.7 million ETH tokens, representing approximately 4.7% of Ethereum’s total circulating supply of 120.7 million coins.

    Based on an ETH price of $1,570 as of June 28, Bitmine’s total crypto, cash, and investment holdings are valued at roughly $10 billion. This expansion solidifies its position as the world’s largest corporate holder of ETH and the second-largest public crypto treasury, trailing only Strategy, which recently announced a new initiative unrelated to Bitcoin purchases.

    Chairman and long-time Ethereum proponent Tom Lee acknowledged the recent market weakness but expressed confidence in Bitmine’s long-term strategy.

    “This past week was a challenging one for crypto investors as ETH fell by 8%, even as Ethereum witnessed notable positive developments such as the creation of Ethlabs, and even the Bank of England softened its stance around stablecoins,” Lee stated. “We are nearing quarter-end for June, and it is not surprising to see ‘window dressing’ leading to investors reducing their holdings in assets which have fallen in the past 3 months.”

    Lee reiterated his belief that Ethereum is poised to benefit from Wall Street’s increasing adoption of blockchain-based financial infrastructure and the development of agentic AI payment systems operating on crypto networks.

    A press release from Bitmine also highlighted that the company has staked nearly 4.9 million tokens, representing over 85% of its total holdings, through its institutional staking platform, MAVAN. With a current staking yield of 2.75%, this is projected to generate an annualized revenue of approximately $211 million.

    While Bitmine maintains its lead in ETH accumulation, rival SharpLink made a notable return to the market last week with significant purchases. After an eight-month hiatus, the firm, chaired by Joe Lubin, acquired 5,000 ETH on Friday and continued to add to its holdings over the weekend.

    In total, SharpLink invested over $62 million to acquire 39,196 ETH, a quantity exceeding Bitmine’s purchases during the same period. However, the substantial difference in their overall holdings means the gap between the two remains considerable.