Tag: Market Trends

  • Bitcoin’s Next Surge: Analyst Predicts Timing

    Bitcoin’s Next Surge: Analyst Predicts Timing

    Bitcoin’s Price Plunge Sparks ‘Dead Cat Bounce’ Speculation

    Bitcoin’s recent slide to just under $60,000 marks a significant correction, with the cryptocurrency shedding over 53% of its value since its all-time high in October of last year. Despite the steep decline, some analysts are suggesting that the digital asset may be at or nearing its bottom.

    Contrasting Views on Market Sentiment

    Analyst Michaël van de Poppe pointed to on-chain metrics that he believes indicate an impending end to the bear market. In contrast, Merlijn The Trader offered a more provocative take, stating that “Bitcoin looks dead,” a sentiment he suggests could be the very catalyst needed for a substantial price rebound.

    Merlijn drew parallels between the current cycle and those of 2012, 2016, and 2020. In each of those instances, Bitcoin’s price experienced a prolonged period of stagnation and suppression following a significant correction that halved its value or more. It was only after overall market sentiment reached new lows that the asset embarked on a rally, leading to substantial gains and subsequent record highs.

    Historical Patterns and Potential Catalysts

    “It’s good that Bitcoin looks dead right now,” Merlijn stated, arguing that this sentiment has historically preceded every cycle bottom. However, he also anticipates a further “flush” before the eventual “moonshot.”

    In a separate analysis, Merlijn highlighted Bitcoin’s electrical cost – the average expense to mine a single unit. He noted that the cryptocurrency has only fallen to this level for the fifth time in 11 years. Each of the previous four occasions coincided with a “historic bottom” and preceded “massive rallies.”

    On-Chain Indicators Signal a Potential Bottom

    Michaël van de Poppe echoed the sentiment that Bitcoin’s bottom may already be in place for this cycle. He explained that numerous on-chain indicators are currently displaying “what we clearly want to see at these ranges: a bottoming formation on BTC.” Among these is the Puell Multiple, which has dropped to 0.65, one of its lowest historical levels.

    However, Van de Poppe cautioned that Bitcoin could still consolidate at current levels for months or experience a minor dip. He pointed out that BTC has been trading sideways between $60,000 and $80,000 since the early February crash, representing a “pretty long period of consolidation.” He concluded that if the current correction does not deepen, there is no clear argument against the bottom being in place.


  • Kiyosaki’s Crypto and Gold Strategy: Why No Dip Buying?

    Kiyosaki’s Crypto and Gold Strategy: Why No Dip Buying?

    Kiyosaki Explains His Approach to Buying Assets Amid Market Declines

    Robert Kiyosaki, the author of the influential investment book “Rich Dad, Poor Dad,” has shared his perspective on asset acquisition, emphasizing that current prices are not the sole determinant of opportune investment timing. He elaborated on his readiness to increase holdings in Bitcoin (BTC), Ethereum (ETH), silver, and gold, even as these assets have experienced recent downturns.

    The past year has been tumultuous for investors across various asset classes. Bitcoin began the year with an ascent towards $100,000, a level it failed to breach, followed by several challenging months. The cryptocurrency’s correction reached a low of $59,100 in early June. Ethereum mirrored this trend, dropping to $1,500 a few weeks prior. While both have seen some recovery since, they remain significantly down year-to-date.

    Even traditionally stable assets like silver and gold have seen substantial losses. Silver, which traded above $120 at the start of the month, is now nearly 50% below that peak. Gold, after soaring to $5,600 per ounce, has experienced a painful crash, ending the business week below $4,160 per ounce, a correction of 25%.

    Kiyosaki contends that these price drops are not the only crucial factor. He admitted to recently making the error of allowing “price to determine reasons to buy or sell any asset.” He has since learned to prioritize understanding the “context” or environment surrounding an asset, rather than its price alone.

    The author and investor explained his shift in focus to the technical charts of Bitcoin, Ethereum, silver, and gold. He stated he “will buy when prices reverse their decline.” Furthermore, he predicted that the two precious metals are “poised for a massive rise in prices.”

    The year-to-date declines and significant drops from their respective January peaks have raised questions about the safe-haven status of both Bitcoin and gold among some analysts. Market observer Charlie Bilello recently noted the difficulty in explaining these price drops, particularly when most major stocks have seen double-digit gains.

    Bilello attributes a significant portion of this movement to investor rotation, with capital shifting towards the technology sector, largely driven by the artificial intelligence boom. He suggested that investors are favoring assets with earnings momentum over stores of value that offer negligible yield.

  • Bitcoin Price Plunge Risk: Top Corporate Buyer Turns Seller

    Bitcoin Price Plunge Risk: Top Corporate Buyer Turns Seller

    Bitcoin’s Next Major Downturn Could Come From Its Biggest Corporate Buyer

    Bitcoin’s next significant price decline may not originate from miners, exchange-traded fund (ETF) outflows, macroeconomic data, undisclosed large holders, or even geopolitical instability. Instead, the cryptocurrency’s largest and most prominent corporate purchaser could become the catalyst if it transitions from a consistent buyer to a recurring seller, a scenario many critics and experts have long feared.

    In light of these concerns, we sought the perspective of ChatGPT on the potential threat and the possible downside for Bitcoin if the company, Strategy, begins liquidating its cryptocurrency holdings to cover dividends or other operational expenses.

    Peter Schiff, a vocal critic of cryptocurrencies, is not alone in raising alarms about Strategy’s approach to funding its Bitcoin accumulation through its STRC (perpetual preferred stock). Earlier reports highlighted warnings from popular crypto analyst Kaleo, who suggested the company might need to sell at least 50,000 Bitcoin over the next two years to meet dividend obligations and other financial commitments.

    ChatGPT cautioned that if the largest corporate holder of Bitcoin begins to offload substantial portions of its reserves, beyond the 32 units sold several weeks ago, the immediate market reaction could send the asset plummeting towards multi-year lows of $52,000. This represents a baseline scenario, a preliminary shockwave. A more profound correction, driven by a significant erosion of confidence in Strategy’s capital structure, could potentially push Bitcoin down to $45,000.

    The artificial intelligence model indicated that while it is highly improbable Strategy would divest “hundreds of thousands of coins,” the primary risk to Bitcoin’s price lies in a fundamental shift in market narrative.

    “For years, Strategy served as the market’s most dependable corporate Bitcoin buyer,” ChatGPT explained. “When Bitcoin experienced dips, investors anticipated that Michael Saylor’s company would raise capital and increase its holdings, establishing a psychological floor. If the market begins to believe that Strategy must sell Bitcoin to service its financial instruments, that floor could rapidly transform into resistance.”

    STRC, also known as Stretch, is the company’s variable-rate perpetual preferred stock. In essence, investors purchase STRC to receive a cash yield, while Strategy utilizes the capital raised to bolster its Bitcoin-centric balance sheet. The instrument is designed with a stated value of $100.

    The company possesses the ability to adjust the dividend rate to maintain STRC’s trading price close to this $100 benchmark. When the shares trade at or above $100, the model functions as intended: Strategy can issue additional preferred shares through at-the-market programs, generate cash, acquire more Bitcoin, and sustain its operational cycle.

    However, when the $100 par value is breached, the structure faces significant challenges. At current prices below $90, STRC is no longer behaving as a stable, high-yield instrument. Instead, it is trading at a substantial discount relative to the level the firm aims to maintain, creating a cascade of issues.

    Strategy’s capacity to issue more STRC is diminished, as selling new shares below the intended $100 threshold would contravene the product’s design or signal that investors are demanding a considerably larger discount.

    Furthermore, the dividend rate may need to be increased to attract new buyers. Critically, instead of allocating proceeds from STRC to acquire more Bitcoin, Strategy might be compelled to tap into its cash reserves, sell common stock, or, as previously indicated, sell Bitcoin holdings to ensure timely dividend payments.

  • XRP Faces Weekly Rejection: What’s Next for Ripple?

    XRP Faces Weekly Rejection: What’s Next for Ripple?

    XRP Faces Persistent Selling Pressure, Key Support Levels Tested

    XRP continues to struggle against both the U.S. dollar and Bitcoin, trading within a persistent bearish pattern. While buyers have managed to defend crucial support zones in recent weeks, the overall trend has yet to signal a definitive reversal, with the token remaining below key moving averages and a descending trendline resistance.

    XRP/USD Dynamics

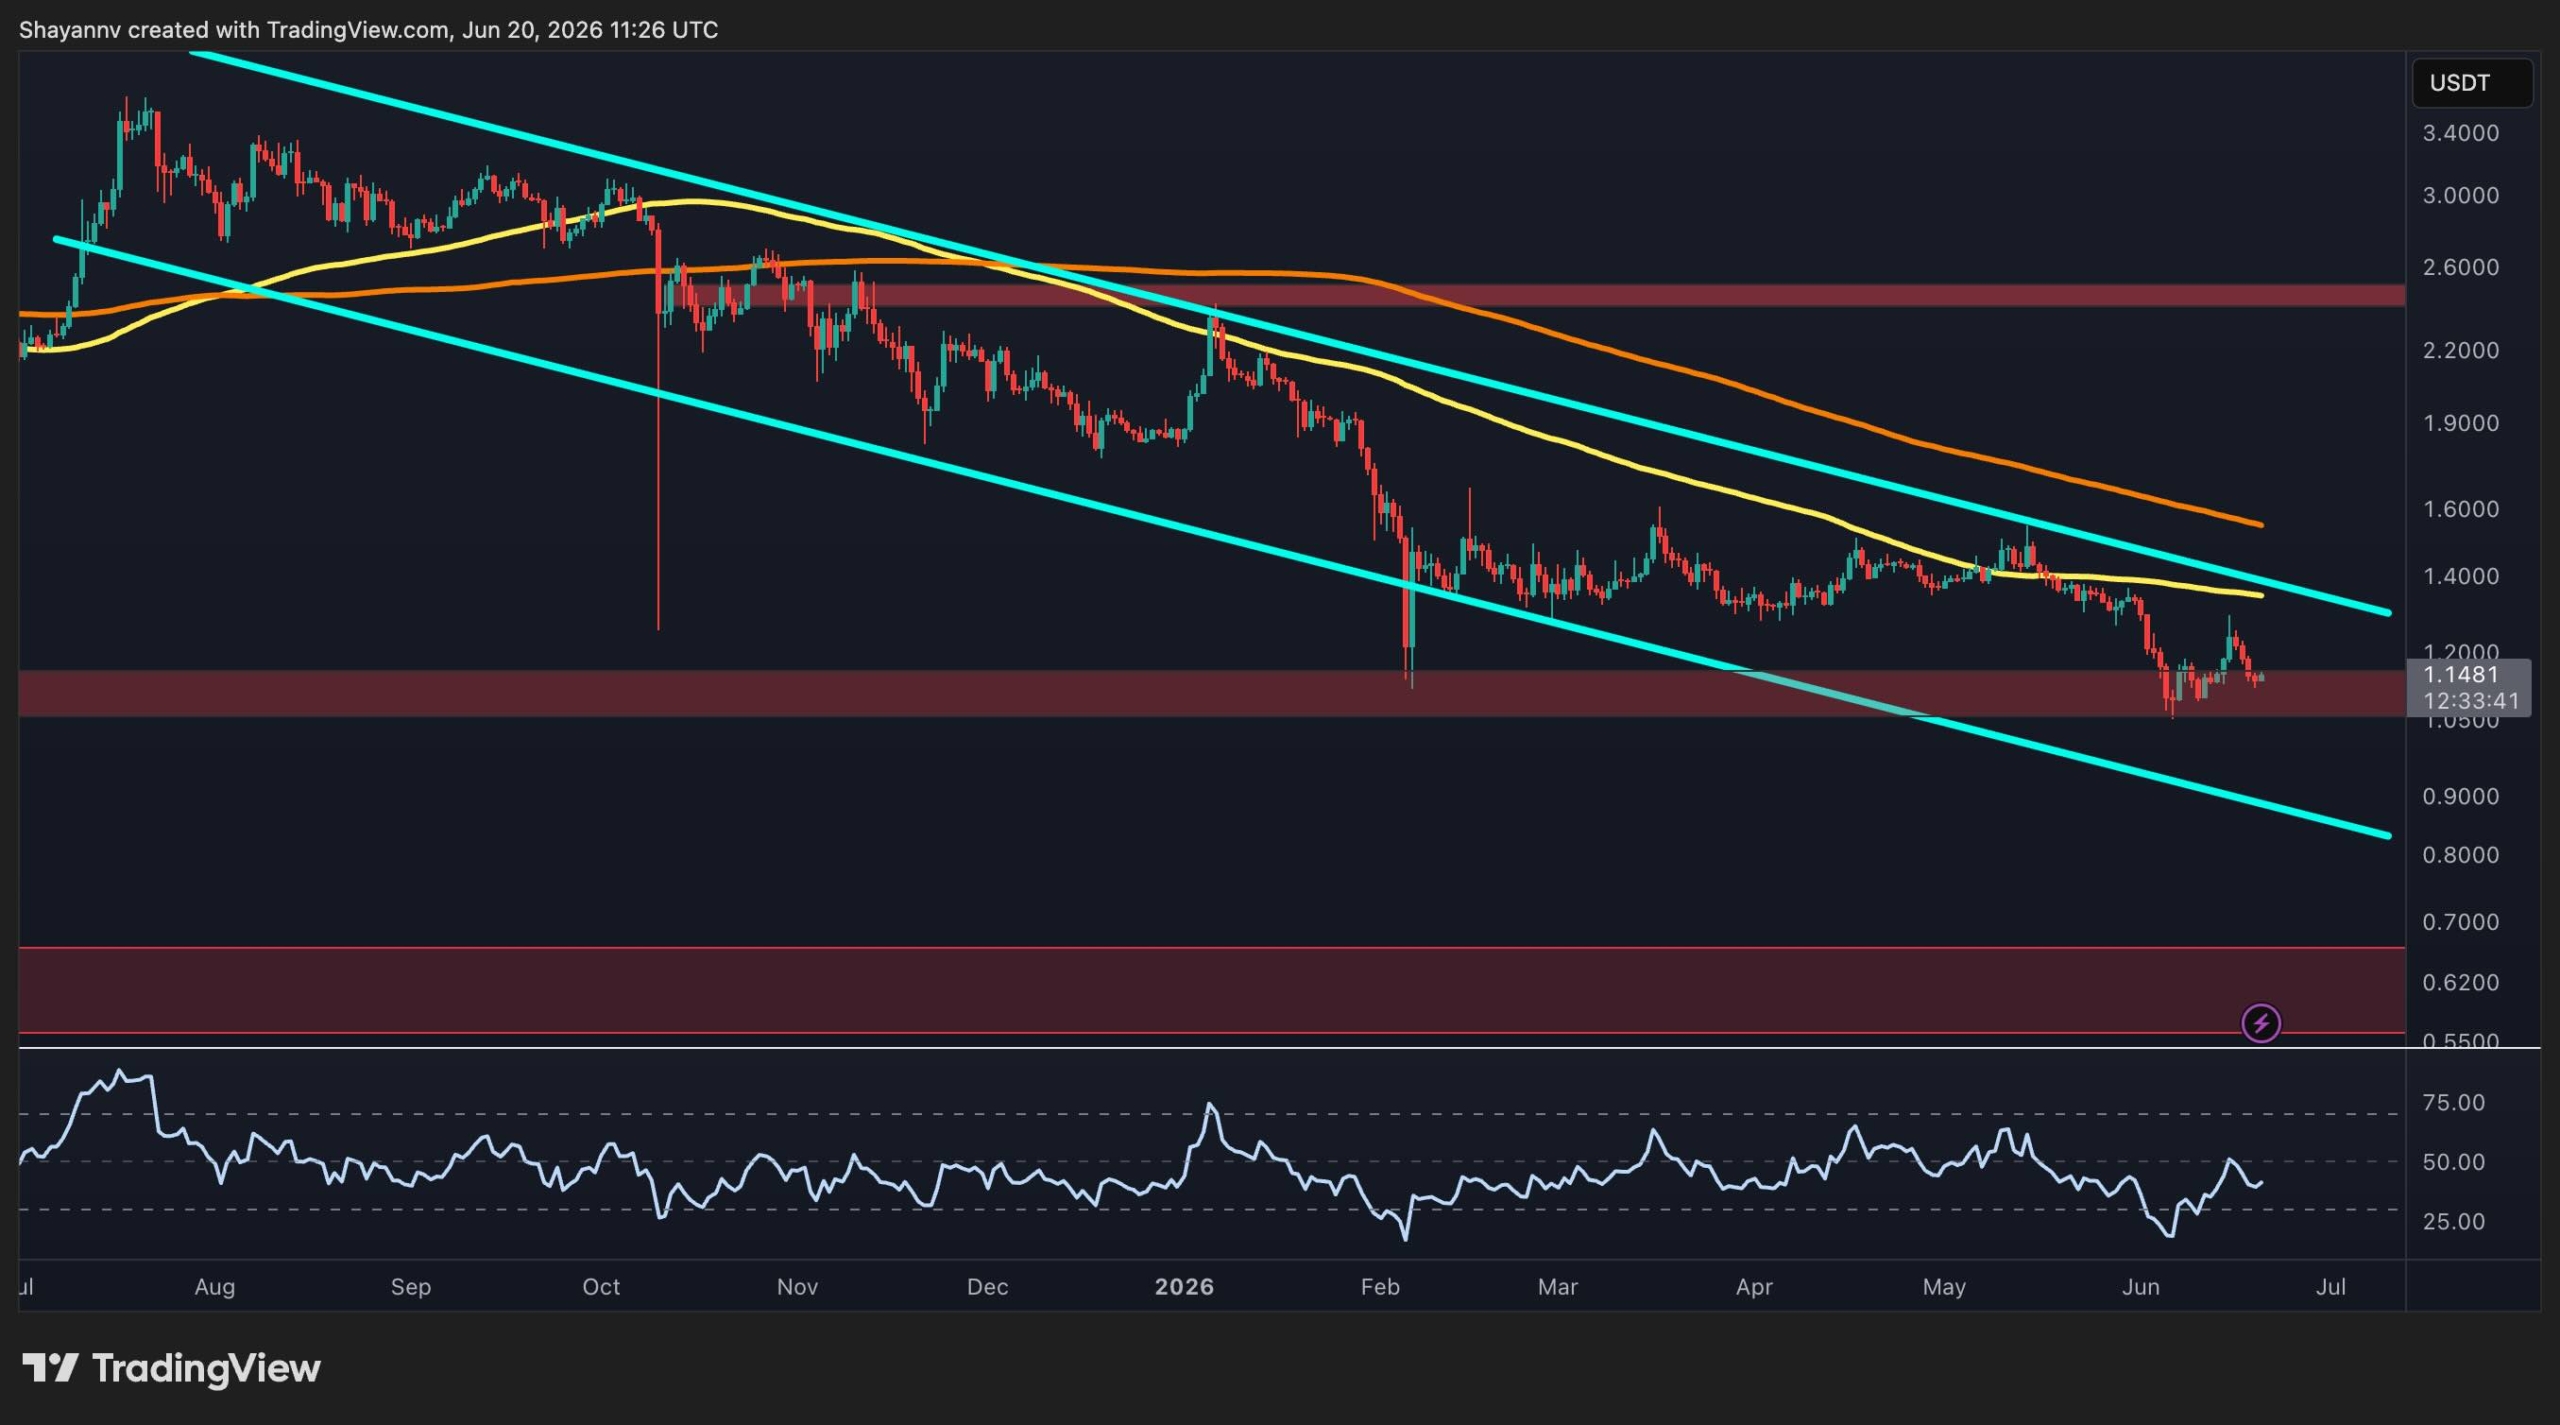
    On the USDT pair, XRP is confined within a large descending channel that has dictated price action since the latter half of 2025. A recent downturn saw the asset retreat to a critical support zone near $1.1, where buying interest has once again emerged to stave off a steeper decline. This area has served as a significant demand region throughout the current correction and remains the most vital support level on the chart. A decisive breach of this zone could pave the way for a move towards the next major downside target around the $0.60 region, which represents the next discernible demand area on higher timeframes.

    On the upside, XRP faces multiple resistance layers. The upper boundary of the descending channel currently aligns with the 100-day moving average, situated around $1.35. Higher still, the 200-day moving average sits at approximately $1.75. Beyond these technical indicators, the significant supply zone at $2.5 remains the pivotal level that buyers must reclaim to shift the long-term structure in their favor.

    Meanwhile, overall momentum remains subdued. Although the Relative Strength Index (RSI) has stabilized above oversold territory, it has yet to exhibit the bullish divergence or strength typically associated with a sustainable trend reversal. As long as XRP remains below the descending channel resistance and major moving averages, the broader market structure will continue to favor sellers, despite recent stabilization.

    XRP/BTC Performance

    The BTC pair presents a similarly cautious outlook, underscoring XRP’s ongoing relative weakness against Bitcoin. Following an extended decline within a descending channel, XRP/BTC has recently entered a consolidation phase above a key support area around 1,720 SATs. This level has been tested multiple times since May and continues to attract demand, forming the base of the current trading range.

    However, despite holding support, buyers have repeatedly failed to achieve a sustained breakout above the nearby resistance zone around 1,850 SATs. This area coincides with the 100-day moving average and has acted as a ceiling throughout June. A loss of the 1,720 SATs support floor could expose the next major demand area significantly lower, around 1,500 SATs. Conversely, a successful breakout above the 1,850 SATs level could open the possibility of a move towards the next resistance region near 2,000 SATs, where further supply is expected to emerge.

    Ultimately, the BTC pair suggests that XRP has yet to establish meaningful relative strength, reinforcing the cautious sentiment observed on the USDT chart. Until buyers reclaim nearby resistance levels and break the broader descending structure, rallies are likely to be interpreted as corrective moves rather than the commencement of a new bullish trend.

  • Hayes Sells All ETH Holdings at a Loss

    Hayes Sells All ETH Holdings at a Loss

    Arthur Hayes Sells Entire Ethereum Stake Days After Purchase, Incurring Significant Loss

    Arthur Hayes, the former CEO of cryptocurrency exchange BitMEX, has once again engaged in a rapid and reportedly unprofitable trading maneuver, this time liquidating his entire Ethereum (ETH) position just days after acquiring it. The move follows a pattern of what some observers have described as erratic crypto market activity from Hayes.

    On-chain data analyzed by Lookonchain revealed that Hayes had amassed a substantial ETH holding starting June 17. His initial purchase involved 1,400 ETH for $2.51 million. He continued to expand his stake in the following days, including another significant acquisition of 1,500 ETH for $2.63 million. In total, Hayes acquired approximately 5,900 ETH for $10.58 million, at an average price close to $1,800 per token.

    However, Lookonchain analysts reported that Hayes proceeded to sell even more than he had bought. Wallets associated with him disposed of 6,000 ETH for $10.14 million on Friday, resulting in a loss exceeding $600,000 within a matter of days. A social media post from Lookonchain highlighted the situation, stating, “Arthur Hayes (@CryptoHayes) is buying high and selling low again.”

    The swift sale and subsequent loss have drawn sharp criticism from the crypto community, particularly given Hayes’ recent history of allegedly promoting altcoins only to sell them shortly thereafter. Many comments on social media platforms expressed disapproval of his trading strategy.

    Interestingly, while many altcoins Hayes has recently offloaded have seen price declines, Ethereum has shown resilience. Since his average selling price, ETH has seen a slight increase, trading above $1,720.

    Meanwhile, other significant market players appear to be accumulating ETH. Data from the same monitoring resource indicates substantial inflows into private wallets. A wallet linked to K3 Capital withdrew 10,000 ETH, valued at over $17 million at the time of reporting, from Binance. Separately, a wallet associated with Chun Wang purchased and transferred 7,650 ETH, worth approximately $13 million, out of the world’s largest cryptocurrency exchange.

    These large-scale acquisitions are occurring as analysts continue to debate whether Ethereum, the second-largest cryptocurrency by market capitalization, is approaching a potential bear market bottom. Some market watchers believe that ETH may find its floor sooner than Bitcoin.

  • Strive Blames Leverage Liquidations for STRC Plunge

    Strive Blames Leverage Liquidations for STRC Plunge

    Digital Credit Offerings Plunge Amidst Leverage Liquidation

    Preferred share offerings tied to Bitcoin treasury firms experienced their most significant downturn on Thursday, a day marked by sharp price declines attributed to leveraged positions, according to Strive CEO Matt Cole. Cole, however, maintained that the underlying credit instruments remain sound.

    The price drops affected SATA and STRC, the preferred equity and digital credit products respectively from Strive and Bitcoin treasury giant MicroStrategy. Both fell considerably below their par values, the price points at which they are intended to trade.

    “Today was the most difficult day in the history of digital credit,” Cole stated on X Thursday afternoon. “What happened today was a leverage liquidation event, not a deterioration in underlying credit quality.”

    Cole explained that investors often increase their exposure to attractive yield opportunities with perceived limited volatility by borrowing capital, a practice known as leveraging. “Many eventually decide that owning it is not enough. They borrow against it. They lever it,” he wrote. “That works until it doesn’t.”

    Both SATA and STRC saw exceptionally high trading volumes on Thursday. According to data shared by Strive’s Chief Risk Officer Jeff Walton, SATA recorded its second-largest trading day with $153 million, while STRC had its fourth-largest with $941 million. Walton suggested these figures, when contrasted with the significantly lower daily trading volumes of larger preferred equity instruments like JPMorgan’s JPM.PD and Blackrock’s PFF, indicate a higher likelihood of a leverage unwind.

    “Leverage appears to have been flushed, fundamentals intact, and the instruments absorbed the flow and found bids throughout the day,” Walton posted on X.

    When questioned on X about the concentration of SATA leverage, Walton indicated that Strive is “aware of a couple anecdotal sources” and is conducting a “deeper postmortem analysis” to be shared later.

    SATA and STRC are designed to trade around $100 per share. However, on Thursday, SATA dropped to a low of $92.88, while STRC fell further, reaching a daily low of $82.53 before closing at $88.59.

    While it is typical for STRC to trade below its par value following its dividend date, analysts told Decrypt on Thursday that uncertainty surrounding the firm’s dividend payment strategy appears to be contributing to “continued weakness.”

    These digital credit products, created to help Strive and MicroStrategy accumulate funds for Bitcoin purchases, have attracted retail investors seeking dividends and lower volatility compared to the firms’ common equities or direct Bitcoin exposure. However, questions about how dividend obligations will be met have raised skepticism regarding the financial engineering of these products. Last month, MicroStrategy sold 32 BTC for $2.5 million, a move signaled by Michael Saylor, demonstrating the firm’s willingness to deviate from its “never sell” stance if necessary.

    Despite bolstering its cash reserves and consistently messaging its ability to meet obligations, MicroStrategy’s common shares and preferred equity have continued to underperform. By the close of trading on Thursday, MicroStrategy (MSTR) had fallen an additional 3.46% to $112.53, marking a decline of over 32% in the past month. Shares in Strive (ASST) decreased by 3.8% to $14.85, bringing its monthly losses to nearly 6%. U.S. markets will be closed on Friday for the Juneteenth federal holiday.

  • Morgan Stanley Amends Filings, Paving Way for Low-Cost ETH, SOL ETFs

    Morgan Stanley Amends Filings, Paving Way for Low-Cost ETH, SOL ETFs

    Morgan Stanley Amends Filings, Paving Way for Potentially Cheapest ETH, SOL ETFs

    Morgan Stanley has submitted amended S-1 registration statements to the Securities and Exchange Commission (SEC) for its proposed Solana and Ethereum Exchange Traded Funds (ETFs). This move signals continued engagement with the regulator, though final launch dates are contingent on the SEC’s review process.

    The Wall Street bank updated its filings on Thursday, revealing that both funds are slated to carry a sponsorship fee of 0.14%. This rate has drawn attention, with Bloomberg ETF analyst Eric Balchunas noting it would position the funds as the lowest-cost options globally for both Ether (ETH) and Solana (SOL) ETFs.

    “Morgan Stanley Ether and Solana ETFs nearing launch. The fee on each is going to be 14bps, making them the cheapest in the U.S. and world,” Balchunas commented.

    For comparative context, Grayscale’s Mini Ethereum Trust currently has the lowest sponsorship fee among ETH trusts at 0.15%. In the SOL ETF market, Franklin Templeton’s SOEZ has the lowest rate at 0.19%.

    The updated documents also indicate that Morgan Stanley intends to incorporate staking arrangements for both investment products. The firm plans to stake a portion of the assets held by the ETFs to generate additional rewards. Figment and Galaxy Blockchain Infrastructure have been appointed as the staking providers for these funds.

    Under these arrangements, custodians will receive a 5% fee for their services, with the remaining 95% of staking rewards flowing back into the fund. This structure means investors could potentially benefit from both the price appreciation of SOL and ETH, as well as earnings from staking activities.

    Morgan Stanley initially filed its applications for the SOL and ETH ETFs in January 2026. The latest revisions mark the second time these filings have been altered. Should the SEC approve both ETFs, the Solana fund is expected to trade under the ticker MSOL, while the Ethereum fund will be listed as MSSE.

    The firm also filed for its Morgan Stanley Bitcoin Trust (MSBT) around the same period. That product launched in April, debuting with $34 million on its first day and also featuring a competitive 0.14% sponsorship fee. MSBT has experienced a notable period of zero outflows since its launch, with only one day, May 29, recording capital departure.

    In contrast, recent data from SoSoValue indicates that spot Bitcoin ETFs collectively saw a net outflow of $90.66 million on June 18, with many of these products experiencing negative flows in recent weeks. However, MSBT recorded its largest single-day inflow on that date, amounting to $10.43 million, bringing its total net inflow to $301 million.

  • Bitcoin Dips Amid Hawkish Fed and US-Iran Deal Uncertainty

    Bitcoin Dips Amid Hawkish Fed and US-Iran Deal Uncertainty

    Bitcoin Slides as Warsh Stays Hawkish and Markets Await a Lasting US-Iran Agreement: Weekly Recap

    The cryptocurrency markets experienced another volatile week, punctuated by geopolitical developments and central bank policy signals. Early in the week, promising news emerged regarding a potential deal among parties involved in the Middle East conflict, initially sparking optimism.

    However, the path forward proved complex. Bitcoin’s price struggled to breach the $64,000 mark until Sunday evening, coinciding with the announcement of a potential deal. This news triggered an immediate surge, propelling BTC to $66,000 within hours and further to over $67,000 on Monday, reaching a multi-week high.

    The rally was short-lived. In the hours preceding the Federal Open Market Committee (FOMC) meeting on Wednesday, the first under the new Fed Chair, Bitcoin dipped below $65,000 before briefly jumping to $66,400. However, the Federal Reserve’s confirmation of no interest rate cuts, as widely anticipated, coupled with a hawkish tone from former Fed Governor Kevin Warsh in his subsequent speech, led to another decline.

    Bitcoin continued its downward trend in the following days, hitting a weekly low of $62,300 earlier today. This slump occurred amid growing concerns that a memorandum of understanding between the United States and Iran might not materialize. Nevertheless, reports emerged today that Israel and Hezbollah have agreed to a ceasefire, scheduled to commence at 14:00 BST on Friday.

    In response, Bitcoin saw another uptick, trading above $63,000 as of press time. The cryptocurrency is likely to gain further momentum if a permanent deal is indeed signed as promised. However, the broader market sentiment remains fragile, particularly with ongoing uncertainty surrounding Strategy and its controversial STRC shares. Further details on this will be provided shortly.

    For the week, Bitcoin remains in negative territory, alongside BNB, DOGE, XMR, CC, BCH, and ADA. In contrast, HYPE, XLM, WLD, UNI, and RAIN have posted double-digit gains.

    Market Cap: $2.26T | 24H Vol: $75B | BTC Dominance: 56.1%
    BTC: $63,230 (-1.3%) | ETH: $1,700 (+0.85%) | XRP: $1.14 (-0.9%)

    Strive CEO: Sharp STRC, SATA Drops Were Leverage Liquidations, Not Credit Failures

    Despite making another $100 million Bitcoin acquisition this week, Michael Saylor’s Strategy has faced scrutiny over its STRC shares. The financial vehicle has fallen significantly below its intended $100 price point, and a sharp decline on Thursday exacerbated investor concerns, even as Strive’s CEO defended the product and its issuer.

    Bitcoin Dips Below $64K Again: Here’s How Whales Reacted

    Amidst Bitcoin’s price instability and persistent weakness, large holders, or “whales” (those with at least 1,000 BTC), have increased their holdings to their highest levels in over three months. These entities now control nearly 36% of Bitcoin’s available supply.

    Morgan Stanley Files Amendments, Clearing Path for Cheapest ETH, SOL ETFs

    Months after launching its Bitcoin ETF, Morgan Stanley has filed amendments for its Ethereum and Solana ETF applications. If approved, these new financial products are expected to be the most cost-effective on the market and will incorporate staking arrangements.

    BlackRock Rolls Out Bitcoin Income ETF as Demand for Covered Calls Grows

    In related news, the world’s largest asset manager, BlackRock, has launched its iShares Bitcoin Premium Income ETF (BITA). This new offering expands its product lineup with a yield-focused vehicle designed to capitalize on the growing demand for covered call strategies.

    Illinois Passed the Most Anti-Crypto Law in the US: Miles Jennings

    On June 17, Illinois enacted the Digital Asset Privilege Tax Act. Miles Jennings of Andreessen Horowitz described the legislation as “one of the most anti-crypto laws in the US,” imposing a 0.2% tax on the exchange, transfer, and custody of cryptocurrencies, with limited exemptions for routine self-custody activities.

    Bitmine Adds $135M in ETH, Closing In on 5% of Ethereum Supply

    The broader market’s weakness has not deterred Bitmine from its objective of acquiring 5% of Ethereum’s total supply. In its latest acquisition, the company announced it had purchased approximately 77,000 ETH for $135 million, bringing its total holdings to 5,620,754 tokens.

    This week’s analysis also includes charts and price action for Ethereum, Ripple, Cardano, Binance Coin, and Hyperliquid. A complete price analysis is available.

  • Ripple Holders Protest RLUSD Priority for 2026

    Ripple Holders Protest RLUSD Priority for 2026

    XRP Community Erupts in Anger Over Ripple Swell 2026 Focus on Stablecoin

    The XRP community has reacted with immediate hostility to the announcement of Ripple Swell 2026, with retail holders flooding the event’s reply threads just hours after the news broke. The prevailing sentiment was not excitement over the 1,500 expected attendees or the integration of the XRPL Apex agenda, but rather anger that Ripple’s premier institutional event appears to be prioritizing its stablecoin, RLUSD, while the price of XRP stagnates.

    “FUUUUUCK YOU. replaced XRP with your fucking stable coin your entire funding fan base will have a target on your heads,” one user exclaimed, encapsulating the widespread frustration.

    This anger is specifically directed at Ripple’s USD-pegged stablecoin, which community members believe is consuming valuable conference attention that should be dedicated to XRP. The language used by community members ranged from sharp criticism to outright fury, with some even calling out Ripple’s leadership by name, including CEO Brad Garlinghouse.

    The underlying accusation is clear: Ripple is building a regulated institutional business around RLUSD while XRP’s price remains stagnant, leaving long-term holders disappointed.

    Swell 2026: A Combined Event with a Controversial Agenda

    Swell 2026 is scheduled to take place from October 27-29 at The Shed in Hudson Yards, New York City. This year marks the first time Ripple will merge its developer-focused XRPL Apex summit into the main Swell conference. The combined event aims to attract over 1,500 attendees, feature more than 75 speakers, and host over 50 sessions across three programmatic stages covering finance, blockchain infrastructure, and digital assets.

    Ripple’s stated agenda themes include payments, tokenization, decentralized finance, AI applications, interoperability, and stablecoins. Notably, RLUSD’s role in enterprise treasury management and cross-border settlement is a prominent feature of the institutional track.

    Ripple CEO Brad Garlinghouse cited the XRP Ledger’s milestone of surpassing 4 billion completed transactions as evidence of the network’s maturity for the institutional audience Ripple is targeting. He framed the upcoming event with deliberate confidence, stating, “I’ve been in crypto long enough to know when a moment is real.”

    While this statement positions Swell 2026 as a significant event for institutional crypto adoption, reflecting Ripple’s ambitions, it offers no specific insights into what this adoption might mean for XRP’s price or holder value.

    Holder Grievances: Stablecoin Over XRP Utility

    The sentiment among XRP holders is far from a fringe reaction. Retail investors have voiced a clear and recurring grievance: Ripple is allocating significant conference prominence to RLUSD and institutional partnerships while XRP’s price continues to underperform relative to the company’s corporate achievements.

    “People are saying Brad is a grifter, using XRP holders as a ponsy scheme to buy other companies. I pray he pays the ultimate price. Lawsuits from XRP holders will bankrupt Ripple and have a negative impact on the Crypto market as a whole. Time will tell..,” one comment read, reflecting the deep-seated anger.

    The tone in many replies was openly hostile toward Garlinghouse and the Ripple leadership team, with holders describing themselves as investors who feel systematically sidelined.

    The issue of token burns has also re-emerged as a focal point. A segment of the XRP community is advocating for supply reduction as a means to directly influence price, a demand that Ripple has consistently declined to address. This refusal, coupled with a conference agenda that appears to prioritize stablecoins and tokenization over XRP utility, is being interpreted by holders as a clear indication of Ripple’s true priorities.

    Such intense community sentiment represents a legitimate market signal. When the XRP community, historically one of the most vocal and coordinated retail bases in the cryptocurrency space, publicly turns against a Ripple event, it can significantly impact social volume metrics, potentially suppressing short-term buying pressure and amplifying sell-side momentum.

  • XRP’s RSI at Critical 50 Level: What’s Next for Ripple?

    XRP’s RSI at Critical 50 Level: What’s Next for Ripple?

    A prominent cryptocurrency analyst has identified a critical technical indicator for XRP, suggesting its two-month Relative Strength Index (RSI) has reached a pivotal 50 mark. This level, according to the analyst, serves as a dividing line between a potential continuation of a broader market downturn and the commencement of a new expansionary phase for the digital asset.

    XRP is currently trading around $1.12, reflecting a nearly 5% decline over the past 24 hours and an approximately 18% drop in the last month.

    EGRAG CRYPTO, in a June 19 post on X, outlined a recurring pattern observed in XRP’s longer-term charts: a significant surge, followed by a cooling period, a reset, and ultimately, an expansion. The analyst noted that XRP’s two-month RSI is now positioned precisely at the 50 threshold, which he characterizes as a “battlefield level” rather than a definitive signal for either direction.

    His reasoning suggests that maintaining a position above 50 indicates an attempt by momentum to stabilize. Conversely, a decisive drop below this level could pave the way for a deeper correction, potentially targeting the 43.66 RSI zone.

    EGRAG CRYPTO believes that a recovery and sustained hold above the 52.85 to 55.45 range would signal a repair in macro momentum. From that point, he identifies the 80 RSI as the level where a more aggressive upward trajectory could come into play.

    “The 2-month RSI does not speak often. But when it does, it speaks MACRO,” the analyst stated.

    Complementing this RSI analysis, EGRAG CRYPTO also pointed to XRP’s two-month chart, which he believes is forming an ascending triangle with an A-B-C-D-E structure. He assesses that the initial four waves are complete, and the token may now be navigating the final “E” wave before attempting a breakout.

    However, the analyst cautioned that his price targets remain contingent on several factors. XRP must first establish rising support, reclaim its 7-week moving average, and overcome resistance between $2.00 and $2.10. Only then would broader Fibonacci-based targets, ranging from $9.50 to an “extreme cycle extension” near $100, become relevant.

    This outlook aligns with a previous analysis by EGRAG CRYPTO, where he mapped out three historical pump scenarios for XRP based on a larger triangle pattern. In that assessment, the conservative case projected a price range of $6.50 to $9.27, a “balanced” cycle case around $13, and an extreme case near $60, all modeled on XRP’s initial major cycle movement.

    The broader market context for XRP has been challenging. The asset has fallen below the $1.20 support level following Federal Reserve Chair Kevin Warsh’s first FOMC meeting and press conference. Some analysts have warned that a rejection at the $1.20 to $1.21 resistance could push the sixth-largest cryptocurrency towards the $1.00 mark.

    On-chain activity has also shown a slowdown, with active addresses decreasing by nearly 50% in the past two weeks, according to analyst Ali Martinez. Furthermore, over the last five days, large holders have divested more than 30 million XRP, although they still collectively control nearly 70% of the asset’s total supply.

    Despite these headwinds, a positive development has been the performance of spot XRP Exchange-Traded Funds (ETFs). These products have continued to attract inflows even as Bitcoin and Ethereum funds experienced outflows. Data from SoSoValue indicates that in the week leading up to June 18, net inflows for XRP ETFs reached $10.66 million, contrasting with the $226 million bled by BTC ETFs and the $10.05 million lost by ETH-tracking funds during the same period.