Tag: Market Trends

  • Bitcoin, Hyperliquid, Zcash, and Kaspa: Key Developments and Market Signals This Week

    Bitcoin, Hyperliquid, Zcash, and Kaspa: Key Developments and Market Signals This Week

    This week, four prominent cryptocurrencies – Bitcoin, Hyperliquid, Zcash, and Kaspa – are navigating significant protocol developments and market catalysts. Verifiable data offers insights into their progress and associated uncertainties.

    Bitcoin: Macroeconomic Influence and Market Levels
    Bitcoin experienced a notable surge past $87,000 on Friday, influenced by US economic data. The September jobs report showed 29,000 jobs added, weaker than expected, while core inflation rose 0.2% month-over-month and approximately 3.0% annually. These indicators have coincided with reduced concerns regarding the necessity for further monetary tightening by the US Federal Reserve. While institutional demand has reportedly improved in recent months, trading volumes remain comparatively weak, suggesting a need for stronger buyer participation to suggest a sustained upward trend. The $87,000-$87,500 resistance level is identified as a key obstacle, with a decisive break above it potentially opening the path toward the $95,000 zone.

    Hyperliquid: Protocol Activity and Tokenomics
    Hyperliquid’s native token has demonstrated strong market performance, reaching new all-time highs attributed to ongoing protocol activity and ecosystem development. A significant development was the introduction of manual borrowing through HyperCore on September 18, allowing users to leverage HYPE and BTC as collateral for borrowing USDC or USDT. On the first day of this feature, borrowing volume reached nearly $270 million. Furthermore, 99% of platform fees are directed to an Assistance Fund for repurchasing HYPE. A key uncertainty remains whether the $90-$92 region can establish itself as sustained support; if it does, the bullish structure is expected to remain intact. In the event of a pullback, $85 is considered a potential support level.

    Zcash: Network Upgrade and Issuance Model
    Zcash is preparing for its seventh major network upgrade, scheduled to activate on November 5. This upgrade is expected to reduce block times from the current 75 seconds to 25 seconds, effectively tripling the rate of block production. Participants have also voted to retain Zcash’s existing halving structure, which mirrors Bitcoin’s issuance model. According to recent updates, 29% of Zcash’s existing supply is held in shielded pools, with an additional 4 million tokens moved into the Ironwood pool. The cryptocurrency has seen significant price appreciation, reportedly rising by over 1,000% in the past year and recently trading around $1,600.

    Kaspa: Developer Expansion and Network Usage
    Kaspa is focusing on expanding developer capabilities through updates such as the Tokata hard fork and Silverscript 1.0, which introduced tools for building covenant logic. The .k name service, launched in September, allows for readable Kaspa addresses, recording several thousand registrations in its initial days. In terms of price action, Kaspa’s native token (KAS) has seen a roughly 50% increase in the past month, bringing the $0.50 level into focus. A central question for Kaspa is whether network usage will grow in parallel with its technological advancements.

    Overall, this week presents a landscape of evolving technology and market dynamics for these cryptocurrencies, with verifiable data highlighting key developments and persistent uncertainties.

    Why This Matters

    The materials describe a narrow update: Bitcoin experienced a surge past $87,000 following weaker-than-expected US jobs data and softer inflation figures, indicating potential reduced need for further monetary tightening. Whether Bitcoin can achieve a decisive break above $87,000-$87,500.

    Broader Context

    Source materials place the factual news in this context: Bitcoin entered its most successful month with a bang, surging past $87,000 on Friday after the release of the weak US jobs report.


  • Bitdeer Sells 292.3 BTC Mined in a Week, Bets on AI Cloud with Zero Holdings

    Bitdeer Sells 292.3 BTC Mined in a Week, Bets on AI Cloud with Zero Holdings

    Bitdeer Sells All Mined Bitcoin, Maintains Zero Holdings Amid AI Pivot

    New York, NY – Nasdaq-listed Bitcoin mining firm Bitdeer has continued its strategy of selling all newly mined Bitcoin, maintaining zero reserves of the cryptocurrency. In the week ending October 2nd, the company mined 292.3 BTC and sold an equivalent amount, resulting in no net addition to its holdings. This mirrors the company’s approach in previous months, where production is immediately converted to cash.

    Bitdeer is mining approximately 41.8 BTC per day. At the current price of around $84,770 per BTC, the 292.3 BTC mined in the specified week is valued at approximately $24.8 million, based on current market prices rather than actual transaction values.

    This zero-holding strategy is a recent development for Bitdeer. As of the end of 2025, the company held approximately 2,000 BTC. This figure decreased to 1,530 BTC by the end of January 2026, and further dropped to 943.1 BTC by February 13th. In the week of February 20th, the company announced via its official X account that it had sold all 189.8 BTC mined that week, along with the remaining 943.1 BTC from its reserves, officially bringing its holdings to zero.

    At the time of the divestment, Chief Communications Officer Ross Gann stated that the sale of Bitcoin was a liquidity decision, not an abandonment of mining operations. He explained that the company was prioritizing cash flexibility due to evaluating several non-binding acquisition opportunities involving land with power infrastructure. Bitdeer’s statement at the time also emphasized that its decision to sell Bitcoin should not be a cause for broader market concern. Concurrently, the company initiated convertible bond financing.

    Strategic Capital Allocation Towards AI and Power Infrastructure

    The proceeds from these sales are being redirected towards other ventures. Bitdeer’s August operational report (6-K filing with the SEC) details this shift. In August, Bitdeer mined 1,310 BTC with a self-owned hashrate of 79.9 EH/s. Simultaneously, its AI cloud segment reported an annualized recurring revenue (ARR) of approximately $86 million, with 4,328 GPUs deployed and a utilization rate of 92%. This represents an increase from the $76 million ARR reported in June.

    Land and power infrastructure represent another significant area of investment. The company acquired 200 acres of land near its Rockdale, Texas facility, which currently has a capacity of 563 MW. The AI cloud pipeline has a total capacity of 206.5 MW. In Norway, Bitdeer has secured a 16-year lease for its Tydal facility, valued at $4.7 billion, with an option to extend for an additional 8 years, potentially bringing the total value to $8 billion. The company also has an initial 30 MW setup in Bhutan, with plans to expand to 500 MW.

    The company’s second-quarter financial report provided further details on this transformation. At the Tydal facility, the lessee Volta is targeting 121 MW of IT load within the 180 MW park, with Bitdeer retaining 47 MW. In Malaysia, Bitdeer has leased a new 21.7 MW data center, expected for delivery in the first quarter of 2027, which is planned to accommodate 128 NVIDIA GB300 systems. AI cloud revenue for the second quarter reached $14 million, a 284% increase quarter-over-quarter. The company has also revised its full-year mining capital expenditure forecast downwards to between $200 million and $280 million, indicating a clear reallocation of funds towards AI and power infrastructure.

    Financial Performance and Debt Concerns

    However, the company’s financial performance reveals a more complex picture. In the second quarter, Bitdeer reported revenue of $228.8 million, a 47% year-over-year increase, and adjusted EBITDA of $31.1 million, up 575% year-over-year. Despite these positive figures, the company posted a gross loss of $8.5 million, resulting in a gross margin of approximately -3.7%.

    This indicates that while adjusted EBITDA, which excludes depreciation and amortization, presents a favorable outlook, the core business is still operating at a loss when the costs of mining equipment and GPUs are fully accounted for.

    The balance sheet also highlights financial pressures. Bitdeer has $496 million in cash against $1.8 billion in long-term debt. The immediate sale of mined Bitcoin is a rapid method to bolster cash flow, but it also means the company lacks any Bitcoin reserves for emergency situations.

    Industry Divergence in Strategy

    The broader industry context offers a compelling comparison. In the first quarter of 2026, publicly traded mining companies including MARA, CleanSpark, Riot, Cango, Core Scientific, and Bitdeer collectively sold over 32,000 BTC, setting a record. Riot Platforms alone sold 3,778 BTC in a single quarter, raising approximately $289.5 million to repay Bitcoin-backed loans.

    MARA, while selling over 20,000 BTC in the first half of the year, was observed by on-chain analytics platform Lookonchain on September 16th to have repurchased 1,292 BTC through FalconX at an average price of $76,347, totaling approximately $98.64 million. This brought MARA’s holdings back to 35,577 BTC.

    While both companies face cash flow pressures, MARA has begun to rebuild its Bitcoin reserves, whereas Bitdeer continues its divestment. This divergence signals a split in how these mining firms are positioning Bitcoin within their strategies.

    Bitdeer’s approach of treating Bitcoin as a cash flow generator rather than a reserve asset is a logical survival strategy given its high debt and negative gross margins. However, the long-term market acceptance of this strategy hinges on its AI cloud segment transitioning from a narrative to profitability.

    The conditions for success are clear: continued growth in AI cloud metrics and a positive gross margin for this segment will validate Bitdeer’s pivot strategy.

  • XRP Consolidates Near Key Levels Amidst Technical Uncertainty

    XRP Consolidates Near Key Levels Amidst Technical Uncertainty

    XRP is currently consolidating within a defined range, presenting a complex picture where technical signals are tempered by significant resistance and short-term trends that introduce uncertainty. The cryptocurrency has recovered from the $1.00 support zone and is trading above key moving averages, indicating a structural improvement. However, it faces immediate obstacles that introduce considerable uncertainty regarding its next significant price move.

    According to the analysis, XRP has shown resilience by moving back above the 100-day and 200-day moving averages, which are situated around the $1.30 mark. This recovery from the $1.00 support area signifies a notable improvement in its broader structure. As long as XRP maintains its position above this $1.30 region, the overall recovery structure remains intact. The daily Relative Strength Index (RSI) has also normalized, cooling from recent overbought conditions and now resting near the middle of its range, suggesting that momentum has stabilized.

    The charts show a more cautious picture on the 4-hour timeframe. XRP has formed a series of lower highs beneath a descending trendline, which acts as a short-term obstacle. The asset is currently trading around $1.49, with immediate support identified at the $1.45 level. This area has seen repeated consolidation, making it a critical point for the short-term structure. A decisive loss of this $1.45 support could potentially expose the broader demand zone located between $1.20 and $1.30.

    Conversely, a notable move above the descending trendline on the 4-hour chart would likely disrupt the current corrective structure. To suggest a stronger continuation of the recent recovery, XRP would then need to reclaim the main resistance zone, which lies between $1.60 and $1.70. A sustained move through this resistance area could open the door for further upside targets, with the next major resistance anticipated around $1.80-$2.00, followed by a more critical supply zone near $2.40.

    The prevailing uncertainty lies in whether XRP can overcome these immediate technical hurdles. The recovery structure remains constructive above the $1.20-$1.30 zone, but the path forward is contingent on breaking through the $1.60-$1.70 resistance. Conversely, a break below the $1.45 support level would increase the risk of another move towards the lower support zone. The exact timing of any potential notable move or notable move remains uncertain, requiring careful observation of price action against these key technical levels. The analysis does not suggest price direction.

    Why This Matters

    The materials describe a narrow update: XRP has recovered from the $1.00 support zone and is consolidating. The primary uncertainties are whether XRP will break through the $1.60-$1.70 resistance zone or break below the $1.45 support level, with the exact timing of any potential notable move or notable move remaining uncertain.

    Broader Context

    Source materials place the market analysis in this context: The article is a price analysis of XRP.

  • XRP Holds Steady at $1.50, Breakout Imminent?

    XRP Holds Steady at $1.50, Breakout Imminent?

    XRP Price Prediction: Ripple Remains Range-Bound as October Begins

    XRP is currently trading around the $1.50 mark, indicating Ripple’s continued presence within a broad trading range as October commences. Key resistance levels are identified between $1.45 and $1.60. A decisive break above $1.60 could potentially propel the token towards the $1.65-$1.70 range, offering buyers an opportunity to surpass its September high.

    Key Levels to Monitor

    Moving forward, several critical levels warrant close observation. A fall below $1.45 would bring $1.40-$1.42 into focus as the next support zone, followed by $1.32-$1.35. A more substantial decline below the $1.27-$1.30 corridor would further undermine the current price structure.

    Momentum Indicators Signal Indecision

    Momentum indicators suggest a lack of clear advantage for either bulls or bears at this juncture. The Relative Strength Index (RSI) hovers at 50.19, near the neutral midpoint, while the Ultimate Oscillator stands at 48.62. Recent trading volume has also been subdued, pointing towards ongoing consolidation.

    The RSI is exhibiting both bullish and bearish divergence signals. Three bearish labels suggest periods of weakening momentum, while four bullish labels highlight instances where momentum improved during price declines. The presence of both signals underscores the current indecision in XRP’s price action.

    Understanding the Current Structure

    To better comprehend the underlying structure, examining major price levels is beneficial. XRP experienced a recovery from approximately $0.90 to $1.70 before retreating to around $1.30. A subsequent rebound towards $1.51 has kept the token within its current consolidation range.

    An update noted that XRP’s Fibonacci resistance pocket between $1.55 and $1.57, previously a significant hurdle, had been rejected. The price has since failed to maintain a successful retest of support, and the token is currently losing its triangular structure. A hold at $1.46 is crucial to prevent a descent into the $1.30s.

    Potential Upside and Downside Targets

    A move above $1.60 would bring $1.70 into play, followed by potential targets at $1.80 and $1.90. Conversely, a decline below $1.40 could see XRP testing support levels at $1.30 and $1.20, with further support anticipated at $1.10, $1.00, and $0.90.

    As of October 3, XRP’s technical setup remains neutral. With the RSI at 50.19 and the Ultimate Oscillator at 48.62, both indicators point to balanced momentum.

    The key levels are clearly defined: a breakout above $1.60 could open the door to $1.70, $1.80, and $1.90. Conversely, a fall below $1.40 might lead XRP towards $1.30 and $1.20, with deeper support at $1.10, $1.00, and $0.90. Until one of these boundaries is breached, XRP is likely to remain confined within its current range.

    Institutional Demand and Competitive Landscape

    Institutional demand significantly influences XRP’s price outlook. In September, U.S. spot XRP exchange-traded funds (ETFs) recorded approximately $121.4 million in inflows, bringing their cumulative inflows to around $1.79 billion. By the end of the month, their combined net assets reached approximately $1.69 billion.

    However, institutional capital within the cryptocurrency space is facing increasing competition. Solana ETFs have amassed about $1.91 billion in net assets following eight consecutive days of inflows, surpassing XRP funds. Consequently, future ETF flows will be a critical factor for XRP’s price trajectory.

    Regulatory Developments and XRP Ledger Adoption

    U.S. regulatory developments remain another important consideration. On September 15, the Senate failed to advance the CLARITY Act in a 49-50 procedural vote. Following this vote, XRP experienced a nearly 10% decline, falling to approximately $1.30, illustrating the market’s sensitivity to regulatory news.

    In parallel, the XRP Ledger (XRPL) is gaining traction in financial infrastructure. CSD BR in Brazil has begun utilizing the XRPL to replicate records associated with BTG Pactual investment funds. CSD BR manages over BRL 22 trillion in registered assets, although its existing systems continue to serve as the official records for registration, custody, and settlement.

    The prolonged period of XRP trading within a range has prompted some traders to explore opportunities beyond large-cap movements, seeking exposure to earlier-stage infrastructure projects.

    Emerging Projects in the Crypto Space

    Bitcoin Hyper ($HYPER), a Bitcoin Layer 2 project with SVM integration, positions itself as the first Bitcoin Layer 2 to feature this architecture. Its proposition includes faster smart-contract execution on Bitcoin, alongside a decentralized canonical bridge for BTC transfers and low-cost transactions.

    The presale price is set at $0.0136871, with $33.1 million raised to date. Staking offers a high 30% APY, and the project aims to outperform Solana, boasting programmability and throughput.

  • Dormant Bitcoin Valued at $457 Million Moved in September

    Dormant Bitcoin Valued at $457 Million Moved in September

    In September, 5,419.45 BTC, valued at approximately $457.23 million, were transferred from dormant addresses to new ones. This activity represents a notable, though reduced, flow of long-held cryptocurrency compared to the record-breaking pace observed in August.

    The movement of these dormant coins in September was higher than in July, indicating continued, albeit slower, activity from holders of older Bitcoin. While August saw a surge in such transfers, September’s figures demonstrate that a substantial quantity of Bitcoin that had remained untouched for extended periods was still being repositioned.

    On-chain data suggests that 5,419.45 BTC were transferred in September, with a market value of $457.23 million. This activity in September follows a period of record-breaking dormant Bitcoin spending in August. Although the pace cooled in September, the volume remained comfortably above that recorded in July.

    It is important to note that the movement of dormant Bitcoin does not reveal the intent of the holders. Such transfers can occur for various reasons, including portfolio rebalancing, security upgrades, or consolidation of assets. Therefore, drawing definitive conclusions about market sentiment or future price action based solely on this activity is not possible due to the inherent uncertainty surrounding holder motivations.

    In summary, September witnessed the movement of a substantial volume of dormant Bitcoin. While this is a factual on-chain event, the interpretation of its implications requires caution. The data suggests the quantity and value of Bitcoin moved and its comparison to previous months, but the underlying reasons for these transfers remain unknown, highlighting the uncertainty inherent in analyzing such on-chain movements.

    Why This Matters

    The materials describe a narrow update: In September, 5,419. September’s dormant Bitcoin movement indicates continued, albeit reduced, activity after a record-breaking August.

    Broader Context

    Source materials place the factual news in this context: August set a record for dormant bitcoin spending, September still saw a healthy batch of long-idle coins stir, with 5,419.45 BTC valued at $457.23 million shifting to new addresses. Although the pace cooled, dormant spending last month remained comfortably above July’s tally. Sleeping Bitcoin Stirs Across 93 Transfers A great deal of so-called sleeping […].

  • Bitcoin at $96K or $82K? Price Analysis

    Bitcoin at $96K or $82K? Price Analysis

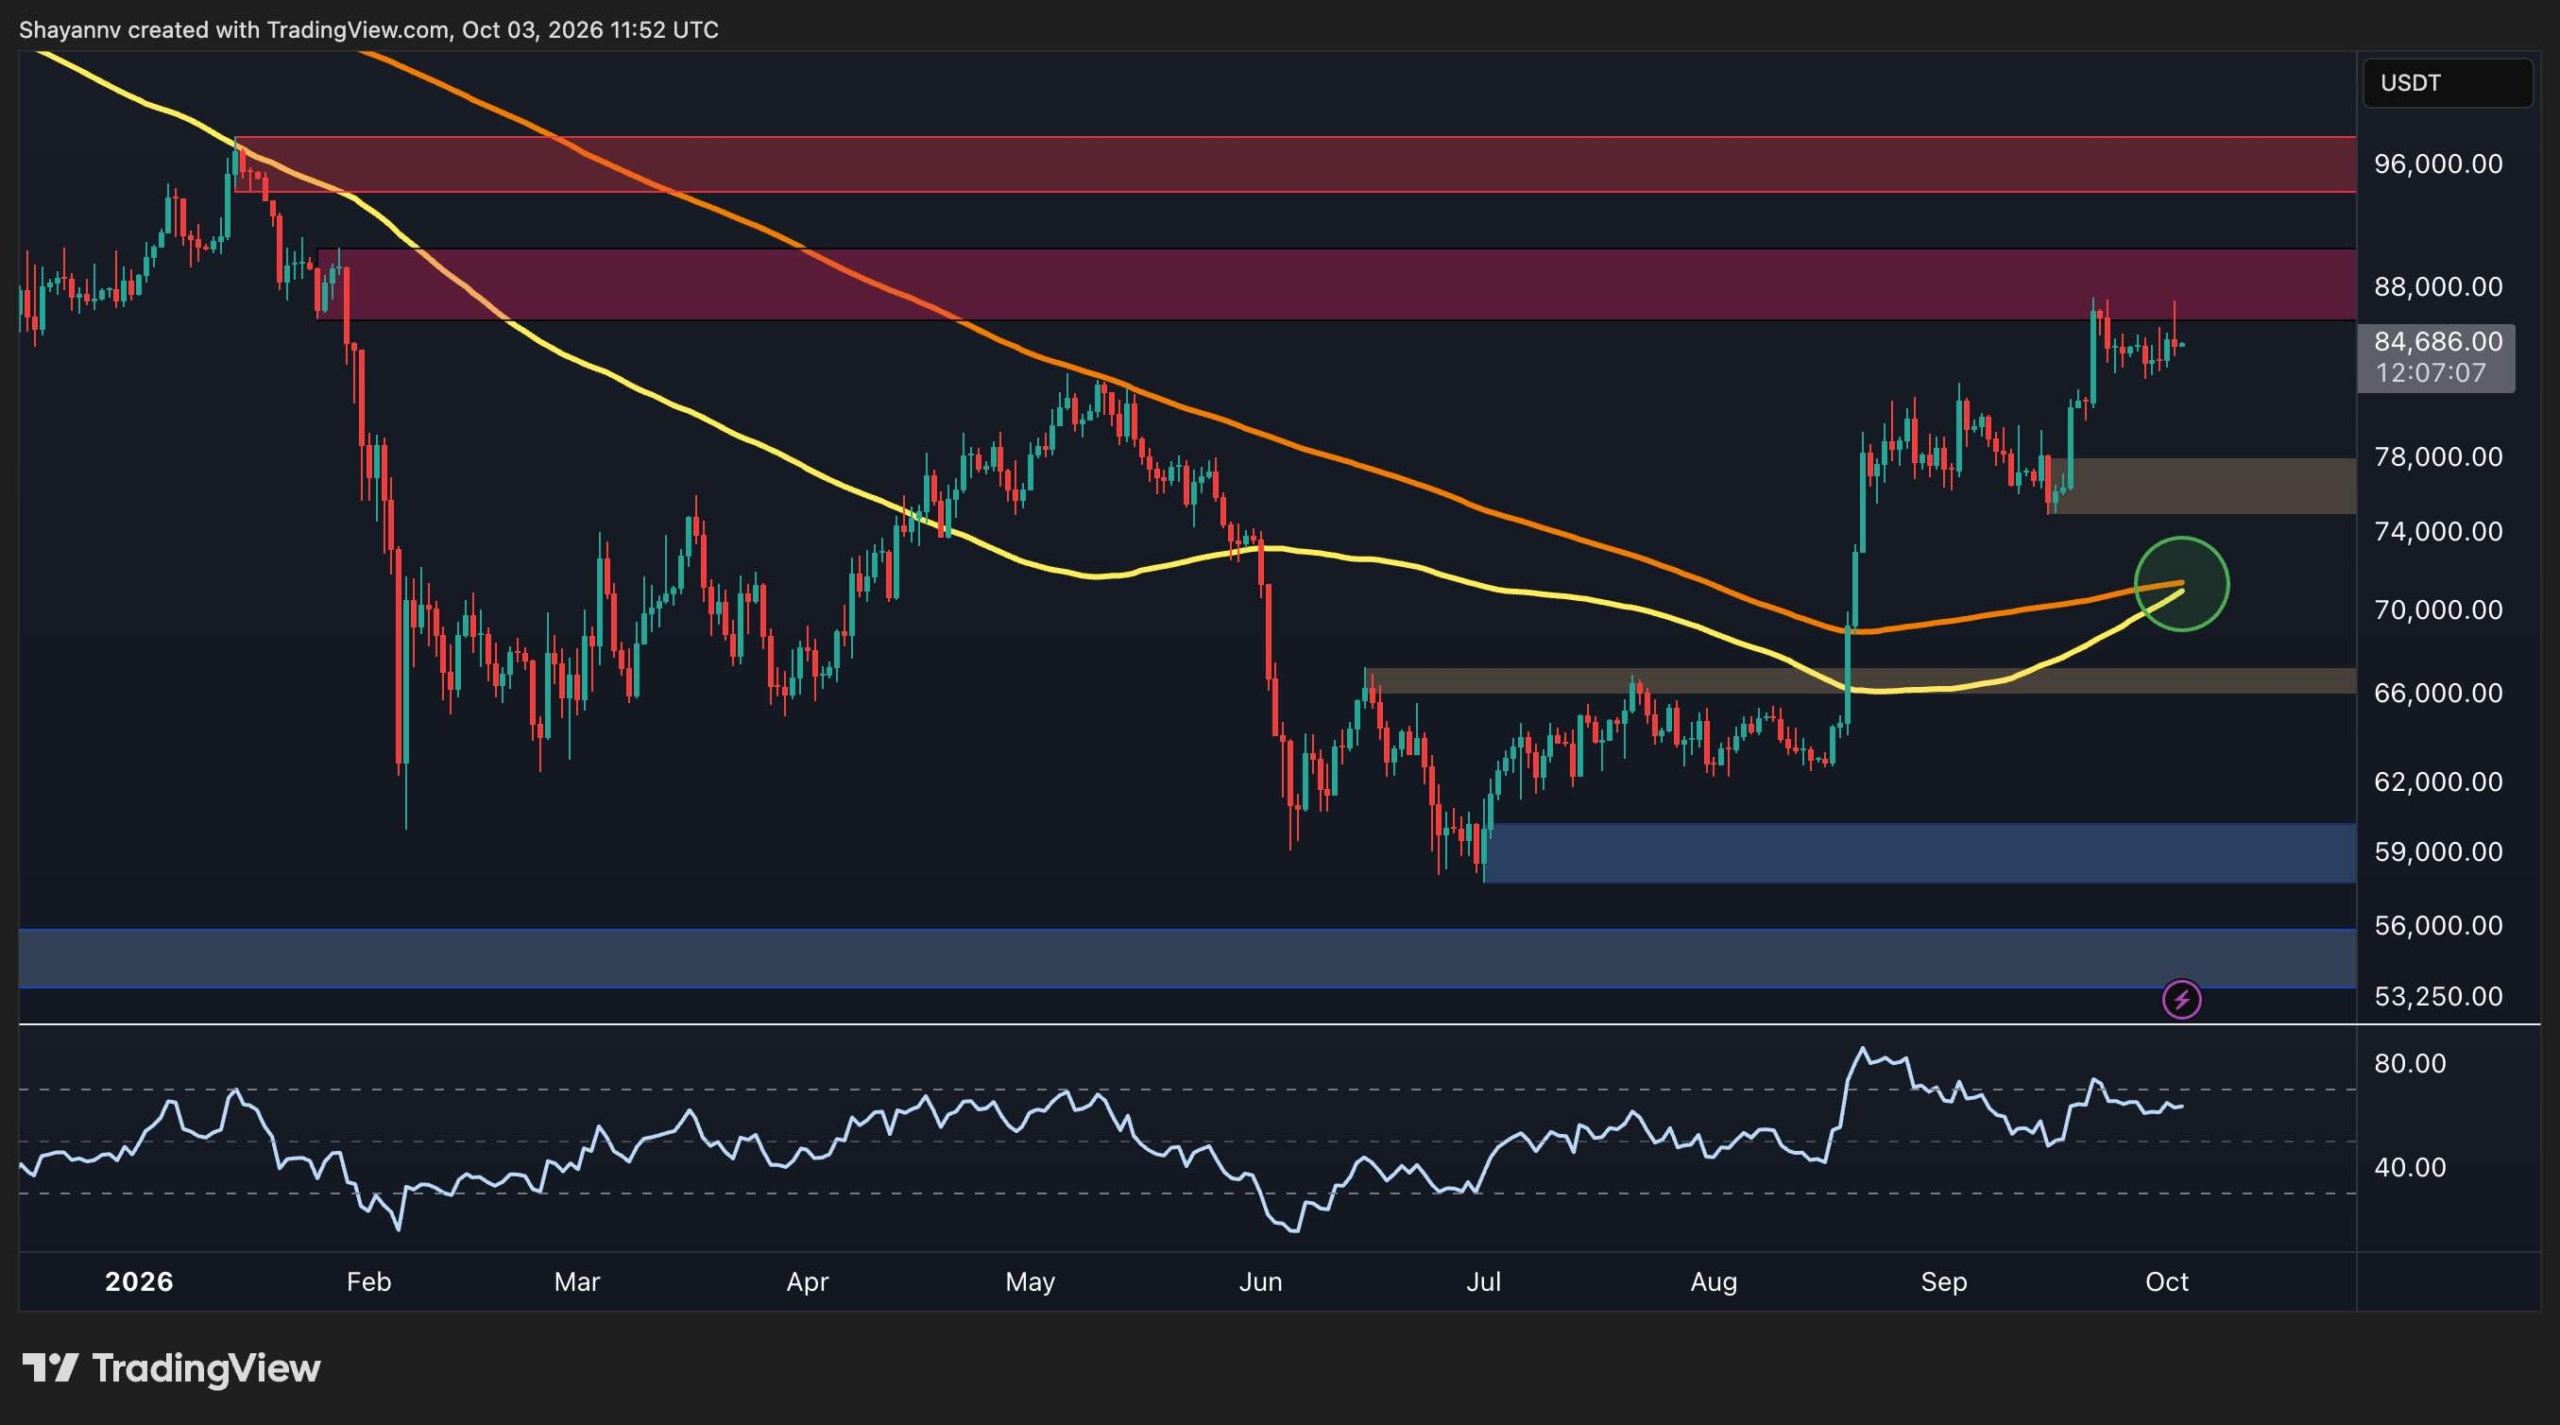
    Bitcoin is currently trading near $84,700, having staged a significant recovery from the $60,000 level over the past two months. While market structure indicators suggest improvement, the cryptocurrency is now approaching a critical resistance zone around $88,000.

    Constructive Momentum Signals Amidst Resistance

    Futures taker flow has once again shifted to a predominantly buyer-driven dynamic, signaling constructive momentum. However, Bitcoin must overcome immediate resistance before its broader upward trajectory can be sustained.

    Summer Rally and Structural Improvements

    The daily chart reveals a notable structural enhancement throughout the summer. Bitcoin established a base in the $60,000 vicinity before a period of consolidation, followed by a sharp ascent from the $66,000 region. The breach of the $75,000 mark initiated a pattern of higher highs and higher lows.

    Key Resistance and Support Levels

    Bitcoin is presently trading around $84,700, with immediate resistance identified between approximately $86,000 and $88,000. This area has previously capped upward movements and represents the primary obstacle for the current recovery. A decisive daily close above $88,000 would bolster the bullish structure and target the next significant resistance level around $96,000.

    On the downside, the first substantial support is located between $74,000 and $78,000. This zone previously served as a consolidation area before the recent impulsive move and could evolve into a crucial bullish order block should the current resistance lead to a deeper correction. Below this, another notable support region is observed around $66,000.

    Moving Averages and Potential Crossover

    The 100-day and 200-day moving averages are also exhibiting more constructive patterns. The 100-day average has turned sharply upward, converging with the 200-day average near $72,000. As long as Bitcoin remains above these averages, the broader recovery structure is expected to hold. Furthermore, a bullish crossover between these averages could serve as a key sentiment driver, potentially propelling the price back above $90,000 in the coming weeks.

    Short-Term Consolidation and Key Levels

    The 4-hour chart offers a more granular view of the current consolidation phase. Following a surge from the $75,000 support area, Bitcoin rapidly advanced towards $86,000 and has since traded sideways. The most apparent short-term structure is a slightly descending range, with its upper boundary at approximately $86,000 and its lower boundary at around $82,000. Bitcoin recently tested the upper boundary and was rejected, retreating to the $84,700 mark.

    Consequently, the $82,000 level serves as the first short-term support to monitor. A breakdown below this area could expose the broader $74,000-$78,000 support zone, particularly if selling momentum intensifies. Conversely, a clear 4-hour breakout above $86,000 would indicate that buyers are attempting to resolve the consolidation to the upside.

    RSI and Momentum Balance

    The Relative Strength Index (RSI) on the 4-hour chart has returned to the 50 area after a brief push higher, suggesting relatively balanced short-term momentum. This aligns with the current sideways price action rather than a strong trend in either direction. The broader outlook remains one of consolidation following a significant upward impulse. The critical technical question is whether the range resolves above $86,000 or if Bitcoin first loses the $82,000 floor.

    Futures Taker Flow Analysis

    The accompanying chart illustrates a 90-day Bitcoin Futures Taker CVD (Cumulative Volume Difference), which measures the net difference between aggressive futures buyers and sellers. Green periods signify taker-buy dominance, while red periods indicate taker-sell dominance. The latest reading has reverted to green after a period of predominantly neutral-to-bearish futures flow during the price decline from its highs. This is significant as the recent recovery towards $85,000 has been accompanied by renewed aggressive buying in the futures market.

    The recent green readings suggest that traders are once again predominantly lifting offers rather than aggressively selling into bids. Historically, sustained green periods on this indicator have often coincided with strong upward price movements, although the indicator itself does not guarantee future performance.

    Confirmation and Potential Absorption

    The key concern is that futures buying has been occurring directly below the $86,000 resistance zone. If aggressive buying persists as Bitcoin breaks above this area, it would provide confirmation that the current consolidation is resolving with increased demand. However, if the CVD remains green but the price repeatedly fails at the $86,000-$88,000 resistance, it could indicate that aggressive futures buyers are being absorbed by sellers at these resistance levels.

    In summary, the technical charts indicate an improving structure, with Bitcoin holding well above its summer base and futures taker flow turning buyer-dominant. For the next directional move, the immediate levels to watch are $86,000 on the upside and $82,000 on the downside.

  • Citi Ups Bitcoin Outlook, Reveals New Targets

    Citi Ups Bitcoin Outlook, Reveals New Targets

    Citi Elevates Bitcoin Price Forecast to Over $113,000, Cites Market Recovery

    Citigroup has revised its price prediction for Bitcoin (BTC) and MicroStrategy (MSTR), now anticipating the cryptocurrency to surge past $113,000 within the next year. This shift in outlook follows a broader market recovery that began in mid-August. The banking giant has nearly doubled its price target for Bitcoin, a significant reversal from its more cautious stance just months prior.

    July Downgrade Replaced by Renewed Optimism

    In July, amid a deteriorating market sentiment and a Bitcoin price drop to below $58,000, Citi had slashed its 12-month price target for BTC to under $82,000. However, Bitcoin has since rebounded by approximately 50%, currently trading around $86,000. In response, Citi has now raised its 12-month forecast by about 40% to $113,400.

    According to the bank’s latest analysis, key drivers for this revised target include increased cryptocurrency activity, a more favorable macroeconomic environment, and the notable return of Exchange Traded Fund (ETF) inflows.

    Inflows and Regulatory Landscape

    Citi projects around $5 billion in crypto inflows over the coming year, with financial advisors and brokerages expected to gradually increase their Bitcoin allocations. While acknowledging the recent failure of the CLARITY Act in the Senate, the bank noted that subsequent announcements from the Securities and Exchange Commission (SEC) and the Commodity Futures Trading Commission (CFTC) helped mitigate any negative impact on market sentiment.

    MicroStrategy Valuation Soars with Bitcoin Outlook

    The recalibration of Citi’s Bitcoin forecast has had a pronounced effect on its valuation of MicroStrategy, a major corporate holder of the cryptocurrency. In July, Citi had set a price target of $136 for MSTR, with the company’s shares trading below $100. Now, with MSTR trading at $160, representing a gain of over 60% from its summer lows, Citi has increased its target to $240 and maintained a “buy” rating.

    The bank attributes approximately 34% of the projected upside for MSTR to further Bitcoin appreciation, with an additional 16% linked to an expansion in the company’s market-to-net-asset-value premium. This underscores the significant influence of Bitcoin’s performance on MicroStrategy’s valuation, which Citi has previously described as a leveraged and more volatile way to gain exposure to the cryptocurrency. Consequently, Citi anticipates that MSTR’s valuation could change substantially in response to significant shifts in market conditions.

  • Grok AI Forecasts Volatile Bitcoin End to 2026

    Grok AI Forecasts Volatile Bitcoin End to 2026

    Elon Musk’s Grok AI has forecast a period of significant consequence over the next three months, with projections suggesting Bitcoin could achieve a substantial 2x return by January 1, 2027.

    Market Outlook and Projections

    As of October 3, Bitcoin (BTC USD) is trading around $84,500. Grok AI anticipates that in a full-blown bull market scenario, Bitcoin’s price could surge to $180,000 in its most optimistic projection, with a base case estimate falling between $150,000 and $160,000.

    These predictions are partly supported by recent ETF flows. In the first two days of October, inflows exceeded $130 million, contributing to a total of $58 billion since the ETFs launched in November 2024.

    The broader cryptocurrency market capitalization currently stands at $2.98 trillion, marking a 2% decrease over the past 24 hours. However, total trading volume has seen an 8% increase from the previous day, reaching $117 billion.

    Recent Price Action and Technical Indicators

    In late 2025, Bitcoin experienced a significant downturn, breaking through support levels and falling from $120,000 to approximately $84,000. Early in 2026, the price saw a sharp decline to around $58,000.

    A recovery attempt in the spring pushed the price back to roughly $82,000, but this momentum faltered by June, leading to a drop back into the low $60,000s.

    More recently, a shallow base has formed, characterized by higher lows, though this has not been accompanied by strong upward momentum. The weekly closing price is trending towards the $84,000-$85,000 range, with the weekly price range extending from $82,500 to $87,000.

    Grok AI has identified key support levels at $81,000, followed by $79,500 and $77,600. Resistance levels are noted at $87,400, $89,000, and $90,000.

    The Relative Strength Index (RSI) is currently at 39.06, with the signal line closely trailing at 39.32. These indicators are nearly converged, separated by only a quarter of a point. This reading is significantly below the midline and approaching oversold territory. Despite the current weak momentum, the flattening RSI suggests that the downward trend may be losing steam.

    Emerging Trends and Opportunities

    A notable surge in Stacks (STX) activity validates the market’s interest in Bitcoin-native yield and infrastructure. However, following a run to $0.40, the immediate upside potential may be less attractive than when prices were below $0.35. A failed retest of these levels could quickly place breakout buyers under pressure.

    This market tension underscores traders’ interest in earlier-stage projects. While early entry carries higher execution and liquidity risks, historical precedent suggests these are often the environments where significant, life-changing gains are realized.

    Bitcoin Hyper (HYPER) is highlighted as a Bitcoin Layer 2 project that integrates the Solana Virtual Machine (SVM). It aims to offer fast smart contracts and high-speed, low-cost execution, addressing Bitcoin’s limitations in transaction speed, fees, and programmability while preserving its core security and trust. The project’s presale price is set at $0.013687, and it has raised $33,166,357.73 to date. Bitcoin Hyper also promotes live staking with a high Annual Percentage Yield (APY) and claims to feature a decentralized canonical bridge for Bitcoin transfers. For comprehensive evaluation, market conditions and price scenarios for Bitcoin remain crucial considerations for the broader ecosystem.

  • Bitcoin Price Volatility: Rally to $87,000 Reverses Amidst Liquidations and Analyst Caution

    Bitcoin Price Volatility: Rally to $87,000 Reverses Amidst Liquidations and Analyst Caution

    Bitcoin experienced significant price volatility on Friday, with a rally past $87,000 followed by a sharp decline that triggered substantial liquidations across the market. This price action has led analysts to express caution regarding the sustainability of the rally, shifting attention to potential support levels.

    The upward movement on Friday was initially influenced by positive US economic developments. However, Bitcoin’s price quickly reversed, leading to significant market activity. Verified facts indicate that the price dropped by several thousand dollars within hours on Friday evening, resulting in nearly $600 million worth of liquidations, predominantly from long positions.

    Analysts are approaching the recent rally with caution. According to Ali Martinez, the move to $87,200 may have been compromised before it began, with data suggesting whales sold over 30,000 BTC as the price approached this level. The $87,000 zone has repeatedly acted as resistance for Bitcoin for over two weeks, further indicating the rally’s potential fragility. At one point, Bitcoin’s price fell to $83,500.

    Further complicating the market picture, investors who acquired Bitcoin one to two years ago at prices around $97,000, and those who bought six to twelve months ago at $89,000, have been observed selling their holdings. This selling pressure may have contributed to the price reversal.

    Daan Crypto Trades highlighted rising BTC open interest, which had climbed to over $1.3 billion in a couple of days, indicating a buildup of leveraged positions. Many long positions had appeared in the $85,500-$86,000 price region. Given Bitcoin’s major correction on Friday and the subsequent liquidations, it appears these long positions were significantly reduced, as Daan Crypto Trades later stated.

    Looking ahead, analysts are observing the $82,500 level as a point of interest for potential buying opportunities should the sell-offs continue. Ali Martinez suggested that if declines persist, it could provide confirmation for buying the dip around $82,500, with the aim of another rebound toward $87,000. However, uncertainty remains regarding whether this level will serve as a reported buying opportunity and the extent to which sell-offs will continue.

    The market’s recent volatility underscores the inherent uncertainties in cryptocurrency trading. While the $82,500 level is being monitored, definitive predictions about future price movements are not supported by the current data. The market continues to exhibit significant price swings, making careful observation crucial for investors.

    Why This Matters

    The materials describe a narrow update: Bitcoin rallied to over $87,000 driven by positive US economic developments but quickly fell, leading to significant liquidations. Whether $82,500 will be a real buying opportunity.

    Broader Context

    Source materials place the market analysis in this context: Driven by the positive macro developments on the US economic scene during the business week, bitcoin experienced an impressive rally on Friday to over $87,000 for the first time in about ten days.

  • QNT, NIGHT Outperform Amidst BTC Volatility

    QNT, NIGHT Outperform Amidst BTC Volatility

    Crypto Market Sees Volatility as Bitcoin Recovers from Sharp Decline

    The U.S. labor market showed signs of cooling on Friday, a development typically viewed as positive for risk assets. However, Bitcoin’s price surge was abruptly halted, and the cryptocurrency experienced a significant drop in the hours that followed, before stabilizing around $84,500.

    Meanwhile, larger-cap altcoins are largely trading in negative territory today. Ethereum has once again fallen below the $2,700 support level, and XRP has slipped below $1.50. Quant (QNT) and Night (NIGHT), however, are charting a different course.

    The business week began on a challenging note for Bitcoin, which faced resistance at $85,000 and dipped below the crucial $83,000 support on multiple occasions. Nevertheless, bulls managed to defend this level, initiating an upward movement that tested the upper limit of its narrow trading range at $85,000. A significant mid-week development occurred following the release of Wednesday’s Personal Consumption Expenditures (PCE) data, which saw Bitcoin skyrocket from $83,000 to $85,600 within hours.

    This rally was short-lived, however, as Bitcoin was almost immediately rejected at that level and plunged back toward its starting point. It traded sideways on Thursday before resuming its climb on Friday. The softer-than-expected U.S. jobs report provided a boost, pushing Bitcoin above $87,000 for the first time in approximately ten days.

    Despite these positive indicators from both inflation and the labor market, Bitcoin faced a sharp rejection at this higher level, falling below $84,000 in the subsequent hours and triggering nearly $600 million in liquidations. The cryptocurrency has since recovered to $84,500, with its market capitalization standing at $1.69 trillion. Its dominance over altcoins has risen to 59% on CoinMarketCap.

    Ethereum continues its struggle against the $2,700 resistance, remaining on the downside of this key level. XRP has dropped below $1.50 following a 3.5% daily decline. Zcash (ZEC) has seen a daily decrease of over 5% and is now trading just above $1,300. Dogecoin (DOGE), Chainlink (LINK), Cardano (ADA), Rain (RAIN), Stellar Lumens (XLM), and Near Protocol (NEAR) are also experiencing significant losses on a daily basis.

    The situation among mid-cap altcoins mirrors this trend. In contrast, Quant (QNT) has extended its recent rally, posting a 13% surge that has pushed its price well above $260. Night (NIGHT) has seen a similar percentage increase, reaching $0.50.

    The total cryptocurrency market capitalization has decreased by nearly 2% over the past 24 hours, now standing at $2.880 trillion on CoinMarketCap.