Tag: Market Trends

  • Wall Street and Washington Drive Bitcoin Surge

    Wall Street and Washington Drive Bitcoin Surge

    Bitcoin Surges Past $79,000 on Renewed Institutional Interest and Shifting Regulatory Landscape

    Bitcoin’s price surged past $79,000 on Friday, propelled by a confluence of factors including renewed institutional buying, improving macroeconomic conditions, and a more favorable regulatory outlook from Washington. These developments coincided with billions of dollars in short liquidations, further fueling the rally.

    While the current week has seen a sharp ascent for Bitcoin, analysts suggest the underlying momentum began building prior to this latest breakout.

    A Convergence of Forces

    Lacie Zhang, a research analyst at Bitget Wallet, told Decrypt that Bitcoin’s recent price action appears to be driven by a convergence of three key forces. These include a more supportive macroeconomic backdrop, a reduction in regulatory risk emanating from Washington, and robust spot demand.

    Zhang highlighted the U.S. Treasury’s expanded long-dated buyback plan as a significant factor, noting that it weakened the dollar and revived the “debasement trade” for both Bitcoin and gold. Simultaneously, the Trump administration’s advocacy for cryptocurrency market structure legislation has helped to alleviate regulatory uncertainty.

    The third crucial element, spot demand, has been clearly reflected in renewed buying activity within Bitcoin exchange-traded funds (ETFs).

    ETF Inflows and Short Squeezes

    “U.S. spot Bitcoin ETFs saw roughly $517 million of net inflows on August 19 and about $606 million on August 20, while the break above $70,000 forced short covering and pulled momentum buyers back in,” Zhang explained.

    These funds had already attracted substantial capital, with $853.5 million in net inflows over five consecutive trading sessions earlier this month.

    Julio Moreno of CoinShares reported that ETFs purchased approximately 7,500 BTC in a single day, marking their highest daily acquisition level since April.

    “The catalyst was the US Treasury announcement and Trump’s remarks about the US Gov. potentially buying Bitcoin,” Moreno told Decrypt. “However, Bitcoin spot demand was already showing signs of growth days before.” He added that historically, similar periods of demand growth have been followed by a median Bitcoin gain of 23% over the subsequent two months.

    Washington Warms to Crypto

    Earlier this week, former President Donald Trump urged Congress to pass a “fair version” of the Clarity Act during a White House meeting with cryptocurrency and finance executives. This proposed legislation aims to establish a federal regulatory framework for digital assets and delineate the respective jurisdictions of the Commodity Futures Trading Commission (CFTC) and the Securities and Exchange Commission (SEC).

    However, the immediate impact of such legislation on Bitcoin itself may be limited.

    “Bitcoin already has relatively high regulatory certainty in the US. It is widely treated as a commodity, spot ETFs are established, and institutional access already exists,” Moreno observed. “The Clarity Act does not radically change Bitcoin’s investability in the same way it potentially does for many other crypto assets.”

    Zhang noted that Trump’s push for market structure legislation is also influencing how investors perceive and price regulatory risk. “The regulatory risk premium is being repriced lower after Trump again urged Congress to pass crypto market structure legislation,” Zhang stated, adding that clearer rules facilitate easier underwriting of exposure for institutions.

    The Clarity Act remains stalled in Congress, with the Senate expected to revisit the legislation in September. In parallel, CFTC Chair Michael S. Selig announced on Thursday that he has directed agency staff to explore cryptocurrency market structure rules under the commission’s existing authority.

    Shorts Get Crushed

    The shift in demand and market sentiment left traders who had bet against Bitcoin exposed as the price continued its upward trajectory.

    Zhang estimates that over $4 billion in cryptocurrency shorts were liquidated within a two-to-three-day period, including approximately $2.7 billion during one 24-hour span and an additional $1.2 billion the following day.

    “Bitcoin shorts alone were reported around $2.75 billion during the initial squeeze,” she said. “It is one of the largest forced short covering episodes in recent crypto history.”

  • XRP Price Action: Overbought Signals and Derivative Risks Cloud Future Outlook

    XRP Price Action: Overbought Signals and Derivative Risks Cloud Future Outlook

    Ripple’s XRP cryptocurrency has experienced a significant price surge, climbing over 35% this week and reaching $1.42 on Friday after breaking through key resistance levels. This upward movement has reignited discussions about its potential to revisit previous all-time highs, but technical indicators and market data present a complex picture with notable uncertainties.

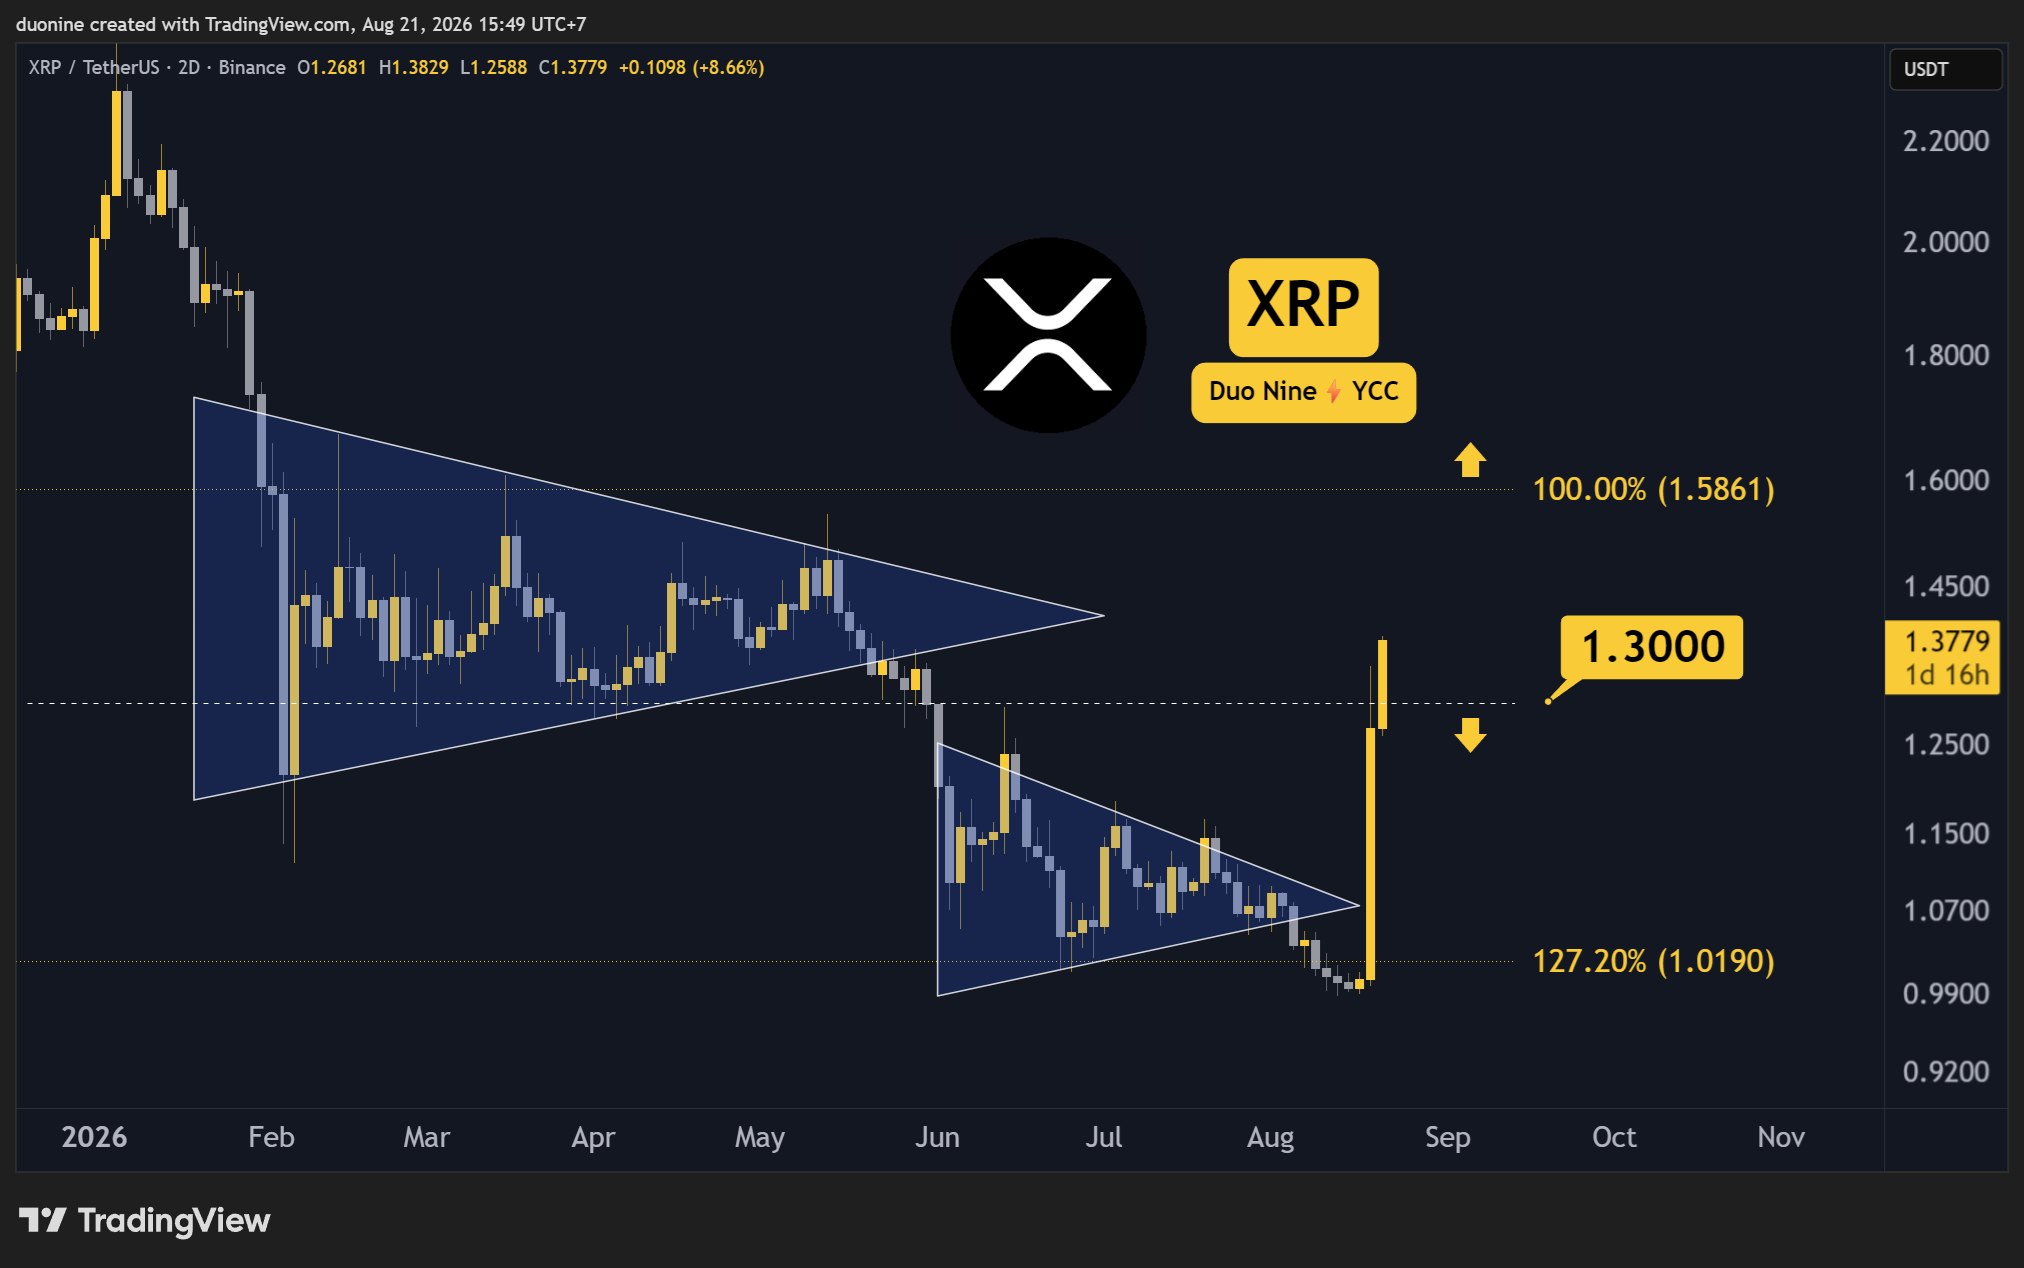
    The cryptocurrency saw a nearly 20% increase in the past 24 hours leading up to Friday’s peak. XRP successfully breached the resistance zone between $1.293 and $1.302. According to Diana’s findings, this notable move could signal a return to the previous all-time-high zone. However, the 4-hour Relative Strength Index (RSI) for XRP is currently around 83, indicating extremely overbought conditions. This suggests that the recent price rally may be due for a correction. A failure to hold the $1.30 level could lead to a cooling of momentum, with $1.20 potentially becoming a key support level to watch.

    Further analysis of the derivatives market on Binance reveals an elevated funding rate of 0.0101, which is significantly above its 30-day moving average. Data cited by analyst Ali Martinez indicates that large XRP holders, often referred to as whales, have accumulated over 300 million tokens since the start of the current business week. CryptoQuant revealed the funding rate reached its highest level since October 2025. This accumulation, coupled with the high funding rates, suggests strong demand for long positions in the derivatives market.

    While strong demand can fuel price increases, the elevated funding rates also introduce increased risk. As more traders establish long positions, the cost of maintaining them rises. This scenario leaves the market more vulnerable to sharp declines, which could trigger liquidations among leveraged traders and add further downward pressure on the price.

    Analyst Crypto Patel commented on XRP’s potential, suggesting that a move toward $10 should not be dismissed. He pointed to historical price action, noting that XRP traded around $0.006 in 2017 before reaching over $3 in 2018, and that it was described as ‘dead’ in 2023 before surging from $0.50 to $2.60 in November 2024. Considering factors like transaction speed, low fees, and adoption, the analyst stated that targets of $10-$20 are potentially achievable.

    Despite these perspectives, the current market signals present a mixed outlook. The overbought RSI and the risks associated with high funding rates introduce significant uncertainty. If funding rates remain elevated while XRP’s price stabilizes or continues to rise, it could indicate sustained demand. Conversely, a decline in funding could signal weakening speculative interest and recent price movement.

    The sustainability of XRP’s current momentum remains a key question. While the price has broken through significant resistance and whale accumulation is notable, the overbought technical indicators and the inherent risks in the derivatives market highlight the speculative nature of future price movements. Definitive predictions about reaching previous all-time highs or specific price targets like $10 or $20 remain uncertain.

    Why This Matters

    The materials describe a narrow update: XRP’s price increased by over 35% this week, with a nearly 20% rise in the last 24 hours, breaking through resistance at $1. Whether the previous all-time-high zone will be reached.

    Broader Context

    Source materials place the factual news in this context: XRP has emerged as one of the best-performing crypto assets this week after surging by over 35%.

  • XRP Reverses Bearish Trend, Soars Higher

    XRP Reverses Bearish Trend, Soars Higher

    Crypto Market Surges, XRP Leads the Pack

    The cryptocurrency market is experiencing one of its strongest weeks in months, with XRP notably taking the lead. Bitcoin surged past $72,000 this week, propelled by a record short squeeze. This phenomenon occurs when traders who bet on falling prices are compelled to buy back at higher levels, further driving up the asset’s value. The surge was reportedly fueled by a U.S. Treasury plan to nearly double its long-bond buybacks starting September 9. As of this report, Bitcoin is trading above $77,000, having reached an intraday high of $79,000.

    Traders have dubbed this market movement “QE Lite,” as the loosening of bond markets through this mechanism mirrors past Federal Reserve stimulus strategies, albeit originating from a different government entity. This liquidity injection has boosted risk assets across the board, with XRP seeing the most significant gains.

    On Friday’s daily chart, XRP opened at $1.2681, climbed to an intraday peak of $1.4300, and was trading near $1.40 at the time of writing. This represents a 10.52% increase within that single trading candle.

    Real-time rankings indicate an even higher 24-hour gain for XRP, reaching 14.21%, and a remarkable 40.06% increase over the past week. This performance positions XRP as the top-performing asset among the ten largest cryptocurrencies by market capitalization, outperforming Bitcoin’s 7.44% and Ethereum’s 4.50% gains.

    XRP Breaks Technical Resistance

    The XRP price chart had been mired in a “death cross” pattern for months, a bearish technical signal. This occurs when the 50-day exponential moving average (EMA), a short-term trend indicator, falls below the 200-day EMA, signaling a potential downturn in momentum. Since its formation on XRP’s chart, previous attempts to rally have faltered, stalling at or just below the “cloud” formed by these two moving averages.

    Today’s trading action saw XRP’s price not only reach this resistance level but close above it, marking the first daily close above both EMAs since the death cross appeared.

    However, this does not yet signify a reversal of the death cross itself. The 50-day average remains below the 200-day average, meaning a “golden cross” – the bullish counterpart – has not yet formed. Nevertheless, the price reclaiming territory above both averages is often the initial catalyst for such a shift, with the moving averages typically following suit.

    Indicators Signal Strong Momentum

    Further technical indicators support the breakout narrative. The Relative Strength Index (RSI), a momentum gauge ranging from 0 to 100, is currently at 83.5. This deep into overbought territory suggests the rapid ascent, and a potential pause or pullback would not be unexpected.

    The Average Directional Index (ADX), which measures trend strength irrespective of direction, stands at 32.4. This comfortably exceeds the 25 level that traders use to confirm a genuine trend, with the buy-side directional line also positioned above the sell-side line. Additionally, the Squeeze Momentum Indicator, which identifies periods of low volatility preceding a breakout, has flipped to “off,” indicating that the squeeze has occurred and momentum is now building.

    Broader Market Influences and Key Levels

    This significant movement for XRP is not occurring in isolation. Its best week since the 2024 election rally is riding the coattails of Bitcoin’s short squeeze. The same Treasury liquidity news that boosted Bitcoin also coincided with a $275 million Ripple bond sale and the introduction of new SEC crypto exemption rules, which are also contributing to the market dynamics.

    Notably, Bitcoin itself has not yet closed above its own death cross levels, suggesting XRP is currently outperforming the cryptocurrency it typically follows.

    Key levels to monitor for XRP include resistance at $1.43 (Friday’s high) and $1.60, near the upper boundary of the descending channel that has capped XRP’s price since late 2025. Support is identified at $1.34, followed by a golden zone between $1.0754 and $1.0965, with a deeper floor at $0.9862. The next significant tests for the market are anticipated around September 9, when the Treasury’s expanded bond buybacks commence, and September 15, when the Senate is scheduled to revisit the Clarity Act.

  • Pi Network Price Uptrend Faces Uncertainty Amidst Declining Volume

    Pi Network Price Uptrend Faces Uncertainty Amidst Declining Volume

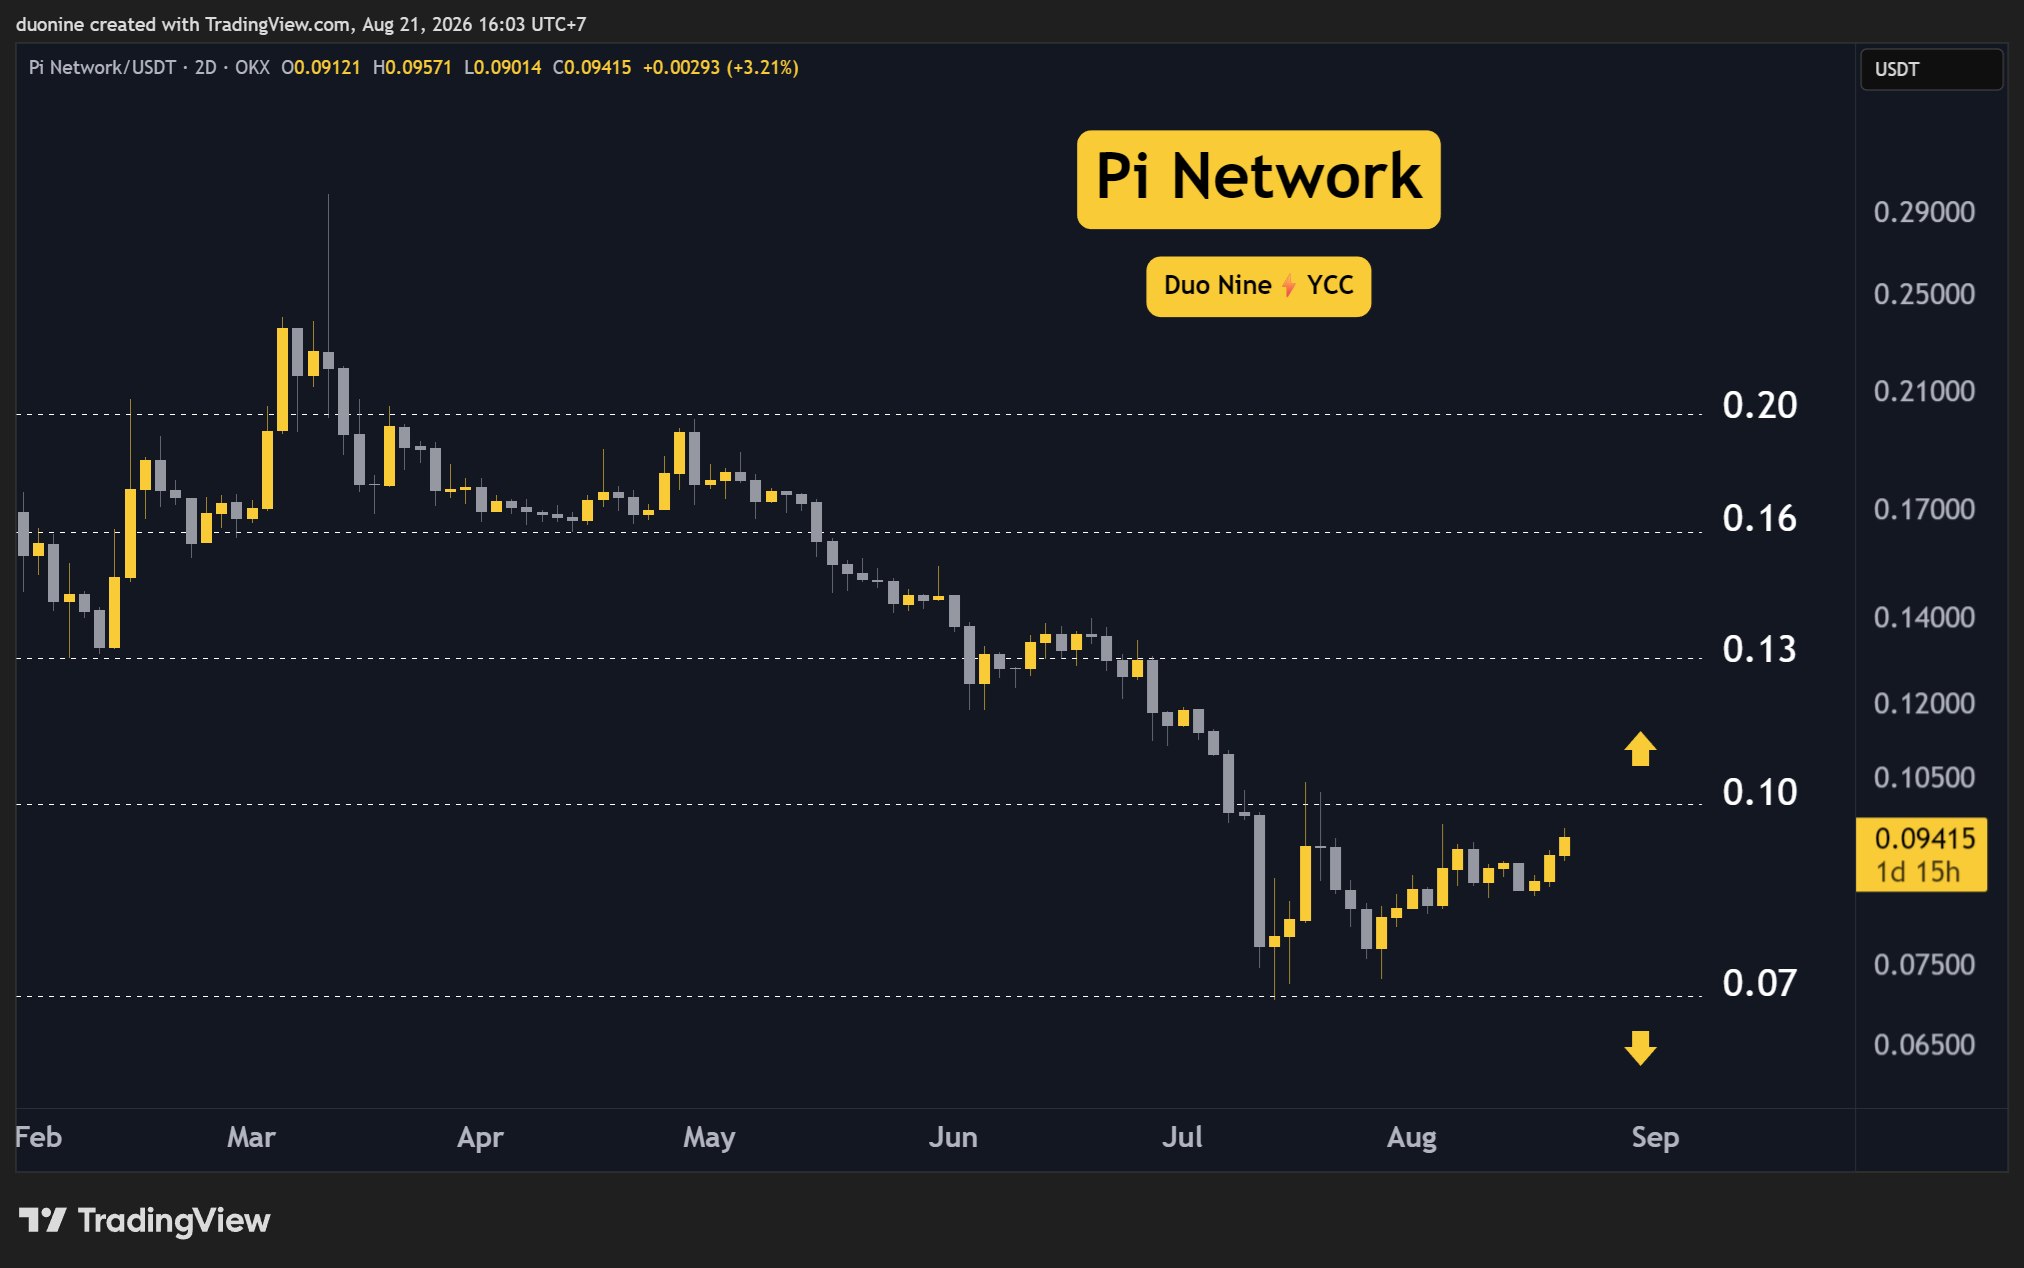
    Pi Network’s price has experienced a short-term uptrend this week, marking a 5% increase and consolidating around the $0.070 support level. However, this upward movement is occurring against a backdrop of steadily declining trading volume over several months, raising questions about the conviction behind the current momentum and the sustainability of these gains.

    The analysis suggests that while Pi Network has reported $0.070 as a key support level and has been on a steady uptrend since early August, the diminishing volume indicates a potential lack of strong buyer interest. Momentum indicators such as the MACD and RSI are showing bullish signals, yet the declining volume presents a significant challenge.

    According to CryptoPotato, the current resistance and a major psychological target for Pi Network is found at the $0.10 level. A test of this resistance is likely, but the declining volume suggests that sellers could regain control if the price fails to break through decisively. The article suggests that for the uptrend to continue with conviction, buyers would need to significantly increase volume and improve the ongoing momentum.

    Key resistance levels are identified at $0.10, $0.13, and $0.16. The immediate focus remains on the $0.10 mark. If Pi Network can successfully overcome this resistance and turn it into a key support level, it could pave the way for a more significant reversal and sustained gains. However, any failure at this level is likely to see bears return to the market.

    The current situation presents a mixed picture. While the price action has been positive since early August, the underlying volume trend suggests caution. The analysis highlights that the lower gains observed in Pi Network compared to other cryptocurrencies like XRP or ETH might be attributed to this lack of volume conviction. The outlook remains somewhat uncertain, with the potential for sellers to regain control at their discretion if the volume profile does not improve.

    Ultimately, the sustainability of Pi Network’s current price uptrend hinges on its ability to attract increased trading volume and overcome the significant resistance at $0.10. Without a substantial increase in volume, the current recent price movement may not be enough to sustain further gains, leaving the cryptocurrency vulnerable to a potential reversal.

    Why This Matters

    The materials describe a narrow update: Pi Network’s price has increased by 5% this week, consolidating around $0.070. Whether buyers will come to sustain the uptrend remains uncertain, as does Pi Network’s ability to overcome the $0.10 resistance. The volume profile’s ability to make a higher high is also uncertain.

    Broader Context

    Source materials place the market analysis in this context: Considering the bullish market context.

  • Ethereum ETFs See Inflows Amid Price Gains, Uncertainty Remains

    Ethereum ETFs See Inflows Amid Price Gains, Uncertainty Remains

    U.S. spot Ethereum ETFs recorded net inflows exceeding $220 million on August 20, marking the fourth consecutive day of positive performance. This trend coincides with Ethereum’s price holding above the $2,300 level. These inflows represent a notable shift from the combined net outflows of over $1 billion experienced by Ethereum ETFs during May and June.

    On August 20, BlackRock’s iShares Ethereum Trust (ETHA) was the primary driver of inflows, contributing approximately $173 million. Other notable inflows included BlackRock’s ETHB ($35.9 million), Fidelity’s FETH ($5.8 million), Bitwise’s ETHW ($2.8 million), and VanEck’s ETHV ($1.7 million). The sustained positive flow suggests continued institutional interest, even as Ethereum’s price has recovered.

    The inflows on August 20 followed $189 million in net inflows on August 19. This recent period of positive flows contrasts with the substantial outflows seen earlier in the year, indicating a potential change in institutional sentiment towards Ethereum.

    Ethereum’s price action has shown movement alongside this increased institutional activity. According to CoinGecko data, ETH was trading around the $2,360 area on August 20, with its market capitalization above $270 billion. The cryptocurrency has moved above the $2,300 level and briefly traded near $2,400.

    Supporting the narrative of increasing demand is a decrease in Ethereum supply held on exchanges. Santiment data indicated that exchange-held ETH dropped from approximately 7.70 million coins on June 2 to 6.54 million coins by August 18, a reduction of about 15% over an 11-week period. This reduction in readily available ETH on exchanges, combined with ETF inflows, could influence buying pressure.

    However, uncertainties remain regarding the sustainability of this trend. It is unclear whether Ethereum can translate this ETF momentum into a sustained breakout. The $2,400 area is identified as a level to monitor for potential resistance. Whether ETH can decisively clear this level while ETF inflows remain strong is a key question for future market direction.

    For now, the consistent inflows into Ethereum ETFs suggest that institutions are increasing their exposure to ETH, even as its price has recovered from recent lows. The market is observing whether this trend will lead to sustained upward price movement for Ethereum.

    Why This Matters

    The materials describe a narrow update: Ethereum ETFs recorded substantial net inflows, with over $220 million on August 20, extending a streak of positive flows. Whether Ethereum can turn this ETF momentum into a sustained breakout.

    Broader Context

    Source materials place the factual news in this context: Ethereum is back in the spotlight after U.S. spot Ethereum ETF pulled more than $220 million in fresh capital on August 20.

  • Kalshi’s Crypto Perpetual Futures Reach Record $17.98 Million Open Interest

    Kalshi’s Crypto Perpetual Futures Reach Record $17.98 Million Open Interest

    As of June 3, 2026, Kalshi’s crypto perpetual futures recorded a daily open interest of $17.98 million, a new high for the CFTC-regulated platform. This development indicates activity in the U.S. market for regulated crypto derivatives, offering an alternative to offshore platforms.

    Perpetual futures are derivative contracts that allow traders to speculate on the price movements of an underlying asset, such as cryptocurrencies, without owning the asset itself. These contracts do not have a fixed expiration date. They enable leveraged trading, meaning traders can control larger positions with a smaller amount of capital, amplifying both potential profits and losses. According to Kalshi’s guide, positions can be liquidated if market movements deplete the required collateral.

    Kalshi claims to be the first U.S. entity to offer CFTC-regulated perpetual futures, having launched the product on May 29, 2026. The platform’s contracts utilize a funding rate mechanism, charged every eight hours, designed to align the futures price with the underlying spot market price. As of June 3, 2026, Kalshi’s guide listed 13 CFTC-approved crypto perpetual futures contracts. These include contracts for assets such as Bitcoin, with a maximum leverage of 5.9x, Ethereum at 4.5x, and Shiba Inu at 2.0x, among others.

    It is important to distinguish Kalshi’s perpetual futures from its prediction markets. While both are offered on the platform, perpetual futures are directional bets on asset prices, whereas prediction markets resolve based on the occurrence or non-occurrence of specific events. The reported $17.98 million figure specifically pertains to crypto perpetual futures open interest.

    The open interest on Kalshi, while a record for the platform, remains significantly smaller compared to major offshore perpetual futures venues. For instance, Hyperliquid reportedly saw $11.7 billion in daily open interest across its numerous pairs. This comparison underscores the difference in scale between Kalshi’s regulated U.S. offering and established global markets.

    Despite the scale difference, Kalshi’s record open interest suggests that traders are beginning to explore regulated alternatives for leveraged crypto exposure within the United States. The appeal for traders lies in the ability to take long or short positions on major crypto assets through a CFTC-regulated platform, without the need to purchase the underlying tokens directly. This regulated environment offers a distinct choice compared to both direct crypto ownership and offshore derivatives markets.

    Uncertainties remain regarding the exact date the $17.98 million open interest was achieved beyond it being a daily figure. Additionally, the specific crypto assets included in the 13 CFTC-approved contracts, beyond those explicitly mentioned, are not detailed. The maximum leverage limits for assets other than Bitcoin, Ethereum, and Shiba Inu are also not specified in the provided information.

    Why This Matters

    The materials describe a narrow update: Kalshi’s daily crypto perpetual futures open interest reached a new record of $17. The exact date of the $17.98 million open interest record beyond ‘daily’.

    Broader Context

    Source materials place the factual news in this context: Kalshi is a platform offering both perpetual futures and prediction markets.

  • XRP Price Update: August 21st

    XRP Price Update: August 21st

    XRP Surges Over 20% in 24 Hours, Signaling Potential Trend Reversal

    XRP has experienced a significant surge of over 20% in the past 24 hours, showing no immediate signs of slowing down. This sharp increase follows a period where the cryptocurrency narrowly avoided falling below the critical $1 support level. The current rally appears to be part of a broader market-wide uptrend, with XRP capitalizing on the prevailing momentum.

    Key Price Levels to Watch

    Analysts are closely monitoring key support levels for XRP at $1 and $1.3. On the resistance side, immediate targets are identified at $1.6 and $2.

    At the time of reporting, XRP’s price has successfully broken through the $1.3 resistance, which is now expected to serve as a significant support zone. Should the upward momentum continue, the next major price target is projected to be $1.6.

    Buyers Re-emerge, Volume Spikes

    After months of trading within a narrow range just above the $1 mark, XRP has seen a strong return of buyer interest. Trading volume has surged to levels not observed since the market downturn in February. Crucially, the current market dynamic shows buyers in control, a stark contrast to the previous seller dominance.

    This robust rally has effectively reversed most of the losses incurred since the beginning of the year. If XRP can successfully reclaim the $1.6 level, it would mark a higher high and officially signal an end to its recent downtrend.

    Overbought Conditions and Future Outlook

    The aggressive buying activity has propelled XRP’s daily Relative Strength Index (RSI) above 80, indicating an overbought condition. This suggests a degree of caution for investors entering the market at this stage, as a significant portion of the upward move may have already occurred, even if XRP reaches the $1.6 target.

    Regardless of immediate price fluctuations, XRP’s recent performance has sent a strong message, potentially setting a bullish tone for the remainder of the year. Ideally, the cryptocurrency would now consolidate its recent gains, confirming the upward trajectory before attempting further advances.

  • XRP Surges Past $1.30: Key Drivers of Ripple’s Rally Revealed

    XRP Surges Past $1.30: Key Drivers of Ripple’s Rally Revealed

    XRP Surges Past $1.30, Fueled by Whales and Analyst Optimism

    Just days after speculation swirled around whether Ripple’s cross-border token, XRP, would breach the critical $1.00 support level, the cryptocurrency has staged an impressive recovery. Analysts had previously projected potential price drops to as low as $0.60.

    However, the market landscape shifted dramatically. A surge in Bitcoin’s price propelled the entire cryptocurrency market upward, with XRP taking center stage. The token rocketed to $1.30, its highest point in months, marking a 30% gain from its recent lows.

    Whales Drive the Rally

    The most significant factor behind XRP’s resurgence appears to be the activity of “whales” – large holders of the cryptocurrency. Reports indicate that these major players accumulated over 300 million XRP tokens within a 96-hour period, directly contributing to the substantial price increase. This followed an earlier accumulation of 72 million coins at the end of the previous week.

    Data shared by market observer Vincent Van Code on X corroborates this trend. Van Code highlighted that 53% of all significant buy orders originated from large players, with medium traders accounting for 35% and smaller investors making up just 12%.

    “Retail is not the driving force of this rally. This is great news,” Van Code concluded, suggesting that the current upward momentum is driven by more substantial market participants.

    ETF Inflows Remain Modest

    While spot XRP Exchange-Traded Funds (ETFs) saw positive performance for three consecutive days, their actual inflows remain relatively modest compared to peaks seen in November and December of the previous year. This suggests that ETFs are likely not the primary catalyst for the current recovery.

    Analysts Project Significant Upside

    The recent 30% surge has emboldened analysts to issue bullish predictions for XRP. Crypto Patel envisions XRP potentially reaching $10, a target he deems plausible. He referenced historical precedents, noting that in 2017, a $3 price was considered improbable, yet XRP achieved it the following year. Similarly, in 2023, despite widespread skepticism, XRP experienced a significant rally from $0.50 to $2.60 within a month. Patel suggested that the $1.00 dip acted as an accumulation zone, with “$10-$20 absolutely on the table.”

    Other analysts also expressed optimism. Mikybull Crypto predicted a “god candle” for XRP following a retest of the Ichimoku cloud, while CW observed that the asset has broken through a major resistance level, signaling the end of a prolonged downtrend and the commencement of a “full-fledged uptrend.”

  • Grayscale in Talks for 200,000 ZEC Contribution to Zcash Trust

    Grayscale in Talks for 200,000 ZEC Contribution to Zcash Trust

    Grayscale in Talks for Significant Zcash Contribution as Trust Eyes NYSE Arca Listing

    Grayscale has revealed ongoing discussions with a subsidiary of Digital Currency Group (DCG) concerning a potential contribution of approximately 200,000 ZEC to its Zcash Trust. This development, disclosed in an August 18 amendment to a registration statement, signals a move to list the trust on the NYSE Arca.

    Grayscale Investments Sponsors, the entity overseeing the trust, stated it is in talks with DCG International Investments Ltd. for the subsidiary to acquire shares via an authorized participant in exchange for the specified tokens. The filing clarifies that “because these discussions are not binding agreements or commitments to purchase, the Potential Investor could determine to purchase more, fewer, or no Shares.”

    The trust also intends to trade under the ticker ZCSH, a symbol already associated with its shares on the OTCQX market. As of June 30, the trust’s net asset value stood at $155.2 million, holding roughly 2.3% of circulating ZEC. On August 12, its shares closed at $36.6, representing a 7% discount to the net asset value per share.

    Since October 2021, the trust’s shares have traded at a discount for 700 days, with a maximum discount reaching 55% and a peak premium of 240%. The Securities and Exchange Commission (SEC) has yet to approve or disapprove these shares.

    Should the proposed contribution proceed, Grayscale’s parent company would assume a controlling stake. The filing indicates that DCG “may, directly and indirectly through the Potential Investor and other affiliates, own a majority of the Shares representing ownership in the Trust,” thereby holding “the ability to control the outcome of virtually all matters presented to our shareholders for their approval.”

    DCG is also actively involved in mining the asset. Its subsidiary, Fortitude Mining, mines ZEC and manages network infrastructure. Furthermore, Foundry Digital operates a ZEC mining pool that accounted for approximately 15.4% of the Zcash Network’s hash rate for the month ending July 2026.

    The filing warns that DCG “could prioritize its own interests in these and other investments over those of the Trust.” This comes as Zcash recently implemented the Ironwood upgrade and its turnstile mechanism following the discovery of a counterfeiting bug in the Orchard shielded pool.

    The Sponsor’s Fee, identified as the trust’s sole anticipated ordinary recurring expense, is noted in Amendment No. 4 with its annual rate left unspecified, similar to the trust’s intended new name. Coinbase Custody Trust Company currently holds the ZEC, with Coinbase acting as the prime broker.

    Grayscale has previously navigated similar conversions. The SEC previously approved its Digital Large Cap Fund for NYSE Arca listing under generic listing standards that eliminated the need for a 19(b) filing. The asset manager had also previously filed to convert its XRP trust into an ETF on the same exchange.

    As of August 19, ZEC was trading at $550.78, with a market capitalization of $9.3 billion, according to CoinGecko.

  • AI Predicts XRP Growth Potential by 2030

    AI Predicts XRP Growth Potential by 2030

    AI and Analysts Offer Divergent XRP Price Predictions for 2030

    Artificial intelligence and financial analysts are presenting a wide spectrum of potential values for XRP by the end of 2030, with the ultimate outcome hinging on crucial factors like regulatory clarity and the adoption of Ripple’s products.

    An investment of $1,000 in XRP at $1.07 would yield approximately 935 tokens. AI chatbot Claude AI projects that these tokens could be worth anywhere from $4,675 to $26,180 by 2030. This broad range underscores the significant impact of underlying assumptions on the final prediction.

    Standard Chartered’s Bullish Outlook Tied to Regulatory and ETF Factors

    Geoffrey Kendrick of Standard Chartered has put forth what is described as a “bank-grade roadmap,” forecasting XRP prices of $7 in 2027, $12.60 in 2028, and $28 by 2030. However, this optimistic scenario is contingent on two key conditions: the passage of the CLARITY Act and spot ETF inflows exceeding $4 billion.

    Current inflows stand at approximately $1 billion since November 2025, indicating a fourfold gap between existing flows and the level required by Kendrick’s model.

    Bitwise’s Similar Projections and Downside Risks

    Bitwise arrives at a comparable conclusion through a similar analytical path. Its most optimistic model forecasts a price of $29.32, which includes a speculative allocation for a U.S. strategic XRP reserve. Claude, meanwhile, does not treat downside scenarios as hypothetical. Bitwise’s own bear case predicts a price of $0.13, which would reduce the initial $1,000 investment to roughly $122.

    Structural Concerns and the Rise of RLUSD

    A more immediate structural concern is the increasing institutional volume on the network being captured by Ripple’s RLUSD stablecoin, rather than XRP itself. This dynamic leads several analysts to consider price targets between $8 and $12 as more realistic than the higher projections. While utility is emerging, it may not be directly benefiting the XRP token.

    Recent Price Action and Technical Indicators

    The recent daily chart activity offers context for why lower price predictions warrant attention. XRP traded near $2.65 last October and experienced a ten-month decline. In February, the price broke below the $1.80 level, pushing it towards $1.15. The spring saw a trading range between $1.30 and $1.55, which persisted into May.

    June saw this range broken, and the downward trend continued through the summer, with the price touching $0.995 before the latest trading session. This recent session marked a significant shift, with a sharp reversal lifting XRP back above $1.08 in a single day.

    The closing price was $1.08250, an increase of 8.13%, or $0.08136. The daily trading range spanned from $0.99524 to $1.08261.

    Immediate support levels are identified at $1.00, followed by $0.95 and $0.85. Resistance is anticipated at $1.15, then $1.25 and $1.40. The Relative Strength Index (RSI) stands at 59.05, with its signal line considerably lower at 38.23. This gap of nearly 21 points is unusually wide and reflects a dramatic one-day shift in momentum.

    The oscillator has moved from oversold territory to above the midline, indicating a bullish flip in momentum. However, such rapid price movements rarely sustain without a period of consolidation.

    The Crucial Distinction: XRP Token vs.

    Stablecoin Adoption

    The vast difference between the $122 and $26,180 potential outcomes hinges on whether institutions ultimately utilize the XRP token or the stablecoin. Observing where new volume is directed will be key to determining which end of the predicted range becomes reality.

    XRP’s long-term upside potential is increasingly dependent on whether institutional activity directly benefits XRP itself or is instead absorbed by products like RLUSD.

    LiquidChain’s Approach to Interoperability

    LiquidChain is addressing this challenge from a different perspective. Instead of betting on the success of a single asset within one ecosystem, it is developing infrastructure designed to connect liquidity across several of the largest blockchain networks.

    Currently, Bitcoin, Ethereum, and Solana largely operate as distinct markets. Moving assets between them involves bridges, additional fees, fragmented liquidity, and the need to redevelop applications for each chain.

    LiquidChain is creating a unified execution layer intended to integrate these three major networks. This would allow a single deployment to access multiple ecosystems without incurring repeated cross-chain transaction costs.

    This strategy positions the project to benefit from capital movement itself, irrespective of which large-cap token leads the next market cycle. The presale is currently priced at $0.01454, with over $940,000 raised, leaving substantial room for price adjustments if this infrastructure thesis gains traction.