Tag: Market Trends

  • Ripple ETFs Surge to Best Week Since May on XRP Rally

    Ripple ETFs Surge to Best Week Since May on XRP Rally

    XRP ETFs Experience Strongest Week Since May Amidst Token Surge

    Cryptocurrency markets are experiencing a significant shift, a trend clearly reflected in exchange-traded funds (ETFs) that track various digital assets, including Ripple’s native token, XRP.

    While generally trading in positive territory, spot XRP ETFs had faced a prolonged period of subdued demand, particularly throughout August. However, this trend reversed dramatically last week.

    The week began sluggishly for these funds, with SoSoValue data indicating zero actual inflows on Monday. This continued a challenging streak that saw seven out of the first eleven trading days of the month with no significant investor activity. The landscape changed on August 18, when investors injected $5.81 million into the funds, marking the largest daily net inflow for August.

    Wednesday saw a more modest gain of $2.35 million for the ETFs, a day that proved pivotal for the broader crypto market. The US Treasury Department’s announcement of a significant monetary policy shift, coupled with former President Trump’s hosting of a Crypto Summit at the White House, are widely considered the primary drivers behind the market’s revival.

    XRP’s own price surge lagged slightly behind other cryptocurrencies on Wednesday, but its momentum picked up considerably in the following days. Thursday saw inflows of $13.24 million, followed by a robust $18.38 million on Friday – the highest single-day inflow since May 14. Cumulatively, the XRP ETFs garnered $39.78 million last week, their best performance since the week ending May 15.

    The total cumulative net inflows for XRP ETFs have now reached a new all-time high of $1.55 billion. Bitwise’s XRP fund continues to lead the pack, holding $542.69 million in cumulative net inflows. It is followed by Canary Capital’s XRPC with $468.12 million and Franklin’s XRPZ with $434.16 million.

    Although XRP did not experience the same explosive growth as Bitcoin and many other altcoins on Wednesday, its subsequent rally was substantial. After successfully defending the $1.00 support level, the token embarked on a rapid ascent, reaching $1.70 by Saturday morning. This represented a remarkable 70% increase in less than 72 hours.

    However, the rally faced resistance at the $1.70 mark, leading to a sharp decline to $1.42. Bulls have since stepped in, facilitating a recovery, with XRP currently trading just above $1.50. Analysts, however, emphasize that the token must reclaim the $1.65-$1.70 resistance zone to signal a sustained shift in the broader trend.


  • Crypto Market Volatility: Surge, Liquidation, and the Role of Leverage

    Crypto Market Volatility: Surge, Liquidation, and the Role of Leverage

    The cryptocurrency market has recently demonstrated significant volatility, experiencing a rapid price surge followed by a substantial liquidation event after a prolonged period of subdued activity. This sharp shift, occurring after approximately 110 days of muted trading, underscores the market’s susceptibility to speculative leverage and external economic influences.

    Following a period described by analysts as largely stagnant for around 110 consecutive days between May 1 and August 19, the market saw an abrupt acceleration on Wednesday, August 19. Bitcoin (BTC) surged from under $65,000 to nearly $80,000. This upward movement contributed to a substantial increase in the total cryptocurrency market capitalization, which rose by approximately $500 billion within a day and a half. During this surge, some assets, including HYPE, reportedly reached new local peaks.

    However, this rapid ascent was followed by a sharp downturn. On Saturday, the market experienced a significant liquidation event, which the Kobeissi Letter described as the seventh-largest on record. Within minutes, approximately $500 million in leveraged long positions were liquidated as BTC dipped by $2,000 and Ethereum (ETH) dropped by 5%. The total market cap also saw a dramatic decrease, with about $110 billion disappearing in just 20 minutes on Saturday.

    The Leverage Factor
    According to analysts, the speed and scale of both the surge and the subsequent decline suggest that speculative leverage played a significant role. After BTC approached $80,000 and many altcoins posted considerable gains, traders reportedly increased their leveraged long positions. This buildup of leverage left the market vulnerable to rapid liquidation cascades when the price began to fall.

    Broader Influences and Uncertainties
    While leverage appears to be a primary driver of the volatility, other factors may have also contributed. The surge coincided with the White House hosting a Crypto Summit and a decision by the Treasury Department to increase purchases of longer-dated government debt. However, analysts noted that Treasury yields erased their initial decline within a day, while the crypto market remained substantially higher, suggesting that another force was at work. Institutional demand also saw inflows, with $2.6 billion entering spot Bitcoin and Ethereum ETFs.

    The preceding period of low volatility, from May 1 to August 19, saw BTC fluctuate significantly, including a surge to over $82,000 and a subsequent crash to under $58,000 by July 1. Despite these movements, the broader market remained subdued until the recent sharp acceleration.

    There remains uncertainty regarding the precise interplay of these factors. While the rapid surge attracted leveraged longs, leading to the subsequent liquidation event, the exact nature of the external forces influencing the market alongside Treasury yields is not definitively clear. The extent to which the market was truly stagnant for 110 days is also a point of interpretation.

    Ultimately, the recent events underscore the inherent volatility within the cryptocurrency market, driven by a complex combination of speculative trading, leverage, and broader economic signals, making it difficult to attribute such rapid shifts to a single cause.

    Why This Matters

    Following approximately 110 days of muted activity, the cryptocurrency market experienced a sudden surge, with Bitcoin reaching nearly $80,000. The exact date of the Saturday flash crash remains uncertain.

    Broader Context

    The cryptocurrency market was essentially muted for many, many weeks prior to the recent surge and liquidation event.

  • Bitcoin and Ethereum ETFs See Notable Inflows; Treasury Buyback Announcement Coincides

    Bitcoin and Ethereum ETFs See Notable Inflows; Treasury Buyback Announcement Coincides

    Spot Bitcoin and Ethereum Exchange Traded Funds (ETFs) have recorded substantial net inflows over the past five business days, reaching a level not observed in approximately ten months. This period of increased investment coincided with an announcement from the US Treasury Department regarding an increase in its liquidity-support buyback operations for longer-dated government debt.

    According to the FactSheet, Bitcoin ETFs attracted nearly $1.92 billion in fresh funds during the five business days leading up to August 21. In the same timeframe, Ethereum ETFs saw net inflows of close to $700 million. The US Treasury Department announced it would double the maximum size of its liquidity-support buybacks for longer-dated government debt, raising them from $2 billion to at least $4 billion per operation. The source states this action may have influenced investor appetite for risk-on assets.

    Market movements during this period saw Bitcoin’s price increase. Before the Treasury Department’s announcement, Bitcoin traded below $65,000. By Friday, its price had risen to nearly $80,000, an increase of approximately $15,000. Ethereum’s price also experienced a notable rise, moving from $1,900 on Wednesday to over $2,500 by Saturday morning. Ethereum’s weekly gains were reported to be over 28%.

    ETF Inflow Details

    Daily figures for Bitcoin ETF inflows show $517 million on Wednesday and over $606 million on Thursday. The total net inflows for Bitcoin ETFs rose from under $51.8 billion to over $53.7 billion by August 21. This past week was reportedly the best for Bitcoin ETF net inflows since the week ending October 10, when inflows reached $2.71 billion.

    For Ethereum ETFs, daily net inflows included $30.85 million on Monday, $71.47 million on Tuesday, $189.15 million on Wednesday, and $220.77 million on Thursday, followed by $185 million on Friday. Cumulative total net inflows for Ethereum ETFs increased from $11.45 billion to $12.15 billion on August 21.

    Correlation and Uncertainties

    While the FactSheet notes these inflows and price movements occurred concurrently with the Treasury announcement, the interpretation of a direct causal link is presented with caution. One signal suggests that increased institutional demand for Bitcoin and Ethereum ETFs correlates with positive price movements for both cryptocurrencies. Another signal indicates that the US Treasury Department’s announcement may have influenced investor sentiment towards risk-on assets, citing the Treasury’s action and subsequent inflows as basis, with a medium confidence level.

    It is important to note certain uncertainties. The exact date range for the ‘past five business days’ is not explicitly stated but is inferred to be leading up to August 21. Additionally, a mention of Ethereum ETF inflows since ‘October 2025’ is likely a typographical error and may refer to a date in 2023 or a similar recent period, given the context of a 10-month high. The precise timing of a past Bitcoin crash, which reportedly coincided with over $19 billion in liquidations, is also not specified.

    The narrative planner emphasizes an evidence-based correlation analysis, focusing on verified facts regarding inflows and the Treasury announcement, followed by observed price movements. Potential correlations are to be discussed with explicit mention of limitations and uncertainties, avoiding direct causal claims or speculative language. The aim is to provide a balanced perspective, highlighting that while inflows and price changes coincided with the Treasury announcement, the extent of influence remains subject to interpretation and broader market factors.

    Why This Matters

    The materials describe a narrow update: Spot Bitcoin and Ethereum ETFs saw substantial inflows totaling $1.92 billion for Bitcoin and nearly $700 million for Ethereum over five business days. This occurred alongside a US Treasury announcement to double liquidity-support buybacks for longer-dated government debt. The exact date of the ‘past five business days’ is not specified, but inferred to be leading up to August 21.

    Broader Context

    Source materials place the factual news in this context: The week started on the right foot, with almost $300 million in net inflows on Monday and another $189.30 million on Tuesday.

  • XRP Bulls Face Final Test After Surge; Key Level to Decide Ripple’s Fate

    XRP Bulls Face Final Test After Surge; Key Level to Decide Ripple’s Fate

    XRP Bulls Face Crucial Test After Surge, Key Level to Determine Ripple’s Trajectory

    Following a period of intense volatility and a ultimately positive few days after a Treasury Department announcement on Wednesday, Ripple’s XRP has seen a pullback, dropping from $1.70 to $1.50. The cryptocurrency experienced significant price swings recently, prompting widespread speculation among analysts regarding its future.

    The substantial rally began after XRP repeatedly tested the $1.00 support level in recent weeks. However, buyers intervened on Wednesday, propelling the cryptocurrency to a multi-month high of $1.70 by Saturday morning. This surge represented a 70% increase in less than 72 hours.

    The rejection at this $1.70 mark proved to be a significant hurdle. Analyst EGRAG CRYPTO highlighted the importance of this level, stating that XRP has now entered a critical zone after an extended period of bearish price action. His analysis emphasizes the $1.65 to $1.70 range, which has historically capped XRP’s upward movement for much of 2026. A successful breach of this resistance would not only establish a new local peak but also dismantle a barrier that has hindered the asset’s strongest rallies since late 2024.

    CasiTrades is also closely monitoring the post-rally market structure. Her analysis suggests that XRP’s recent advance has reached a pivotal technical area, and the subsequent correction will be instrumental in determining whether the broader bullish trend remains intact.

    A retracement after a 70% surge is not uncommon; in fact, it is largely anticipated. However, the extent of this pullback is a crucial factor. Dark Defender maintains a bullish outlook on the asset’s overall Elliott Wave structure. Meanwhile, ChartNerd is focusing on XRP’s capacity to reclaim significant higher-timeframe technical levels after its dip below $1.00. ChartNerd had previously predicted that XRP might briefly fall below the psychological $1.00 mark in 2026 before recovering.

    The market dynamics have shifted, and XRP must now demonstrate that the rejection at $1.70 was a temporary setback rather than the conclusion of its relief rally. A decisive breakout above this level would bolster the argument that the $1.00 bottom established earlier this month signifies more than just a short-term low.

    Dark Defender has indicated that XRP’s initial targets would be in the $1.80 to $2.00 range, the next significant psychological level. Consequently, many analysts on X have converged on the consensus that $1.70 is now the token’s most critical obstacle, and a sustained bullish trend will only materialize after it reclaims this price point.

  • Bitcoin Pulls Back from Near Record Highs; Hyperliquid Hits New All-Time High Amidst Market Volatility

    Bitcoin Pulls Back from Near Record Highs; Hyperliquid Hits New All-Time High Amidst Market Volatility

    The cryptocurrency market exhibited notable volatility over the weekend. Bitcoin experienced a pullback from its recent surge towards record levels, while Hyperliquid (HYPE) achieved a new all-time high, underscoring divergent performance across digital assets.

    Bitcoin, after approaching $80,000 on Friday, has since corrected. The cryptocurrency dipped to around $75,500 on Sunday morning. This pullback followed a rapid increase of approximately 25% in less than 48 hours. Earlier in the weekend, Bitcoin had bounced off $76,200 to tap $79,000 on Saturday morning, before slipping to $77,000 later that day. As of Sunday morning’s low, Bitcoin had recovered around $1,000 and was trading near $76,500. Its market capitalization is reported to be close to $1.540 trillion, with its dominance over altcoins at just over 58%.

    In contrast to Bitcoin’s pullback, Hyperliquid (HYPE) reached a new all-time high, surpassing $82 yesterday. This performance stands out as many other altcoins experienced minor decreases over the same period.

    The broader altcoin market showed mixed but generally downward trends. Ethereum dipped below $2,400 earlier today but has since reclaimed that level. XRP saw rejection at $1.70 and is now trading below $1.50. BNB is also below $690. Several other cryptocurrencies, including CC, XLM, and SUI, have plummeted by over 5% daily. BCH and ADA are down by nearly 3%, while CRO and WLD have fallen by over 7%.

    However, some altcoins bucked the trend. PUMP has seen a significant surge of over 17% in the past 24 hours, and ENA experienced an 8% increase during the same timeframe. On the other hand, TRUMP saw a substantial decline of 33% from its peak, reportedly due to the token’s team sending more coins to exchanges.

    The cumulative market capitalization of all crypto assets has decreased by approximately $100 billion from its recent peak, now standing at $2.650 trillion. Despite this recent decline, the total market cap has increased by $400 billion since Wednesday.

    Several factors contributing to these market movements remain unclear. The specific US Treasury Department announcement that preceded Bitcoin’s surge is not detailed. Additionally, the exact reasons behind Wintermute’s reported heavy short position and the full details of the TRUMP token’s price drop are not provided.

    Why This Matters

    The materials describe a narrow update: Bitcoin experienced a significant price increase, reaching almost $80,000, followed by a correction to around $75,500. The specific US Treasury Department announcement that was associated with Bitcoin’s surge is not detailed.

    Broader Context

    Source materials place the factual news in this context: After gaining $15,000 in a few days, bitcoin was primed for a correction, and the asset has cooled off with a dip to $75,500, where it found some support.

  • XRP Surges 70%: AIs Divided on Ripple’s Bear Market End

    XRP Surges 70%: AIs Divided on Ripple’s Bear Market End

    XRP Surges 70% in Days, But AI Models Urge Caution on Bear Market End

    The cryptocurrency market has experienced a dramatic shift, with XRP leading a significant rebound after weeks of decline. The token, which had fallen to $1.00 and briefly dipped below that level for the first time in 21 months, experienced a swift recovery starting Wednesday afternoon.

    Market-Wide Revival Ignites XRP Surge

    Bitcoin’s rally on Wednesday appeared to galvanize the broader altcoin market, and XRP was no exception. The token surged from $1.00 to $1.42 within a day or two, reaching a multi-month high. This upward momentum continued through Saturday morning, pushing XRP to $1.70, a remarkable 70% increase in just a few days.

    Rejection and Lingering Questions

    However, the rally faced a sharp rejection at the $1.70 mark, and XRP has since retreated to around $1.40. This volatility has reignited the debate about whether the bear market has concluded. Despite the recent gains, XRP remains in positive territory on weekly and monthly charts.

    AI Insights: A “Huge” Move, But Not Necessarily an End

    Artificial intelligence models offered nuanced perspectives on the recent price action. ChatGPT acknowledged the “huge” move and its impact on the short-term outlook but cautioned that it doesn’t definitively signal the end of the bear cycle. The AI assigned a 55% probability that the $0.98-$0.99 low was the market bottom, a figure lower than its 70% confidence in Bitcoin’s July low. ChatGPT highlighted a 45% chance that the current surge is merely a relief rally within a larger bear market, noting that the $1.60-$1.70 range represents a significant long-term trend resistance, not a conclusive break.

    Grok’s Broader Perspective

    Grok provided a wider view, emphasizing that even with the recent spike, XRP remains approximately 60% below its all-time high from July 2025. While acknowledging the recovery is “not trivial,” Grok pointed out that XRP is still significantly down year-to-date. On a positive note, Grok observed the return of large market participants, or “whales,” who have been acquiring millions of XRP tokens in the past week.

    Gemini’s Technical Analysis and Hurdles

    Gemini also adopted a cautious stance, identifying key technical hurdles that XRP must overcome for a sustained reversal. The 33-month exponential moving average (EMA), situated around $1.60, has proven to be a significant obstacle, with XRP failing to break above it thus far.

    However, Gemini noted a positive development: XRP appears to have reclaimed the 200-day EMA, which is currently around $1.34. A sustained weekly close above this level could signal a shift from a bearish to a bullish narrative.

    Gemini’s conclusion, mirroring that of ChatGPT and Grok, is that the recent rally demonstrates “heavy demand still exists at key psychological levels.” Nevertheless, the AI stated that until XRP can decisively break and hold above the 200-day EMA and the $1.60 structural resistance, the move will be technically classified as a “relief rally” within a broader consolidation phase.

  • Cryptocurrency Market Sees Dip Amid Reports of Wintermute’s Substantial Short Positions

    Cryptocurrency Market Sees Dip Amid Reports of Wintermute’s Substantial Short Positions

    Major cryptocurrencies, including Bitcoin, Ethereum, and XRP, experienced a notable price dip on August 22, 2026. This market movement coincided with reports indicating that Wintermute, a prominent market maker, has been building substantial short positions.

    Bitcoin’s price fell from over $77,000 to approximately $75,500 during the weekend. This correction followed a significant rally where Bitcoin surged from $64,000 to nearly $80,000 in less than 48 hours prior to the dip. Other major altcoins also saw considerable losses, with Ethereum dropping by 5% to below $2,400 and XRP declining by 6.5% to under $1.50.

    Reports suggest that Wintermute has been active in the derivatives market, particularly on the Hyperliquid platform. According to Onchain Lens, the firm reportedly sent nearly $60 million worth of BTC and SOL to exchanges like Binance and Coinbase, potentially signaling a move to sell these assets. Further analysis from Onchain Lens indicates that Wintermute has established a significant futures position on Hyperliquid, with the majority of this leveraged trade being short positions. Current data shows Wintermute holding $160.03 million in open positions on Hyperliquid, comprising $146.19 million in shorts and $13.85 million in longs. These positions are reportedly sitting at an unrealized loss of $3.66 million while earning $2.14 million in funding.

    The market downturn was accompanied by substantial liquidations. CoinGlass data shows that almost $100 million in long positions were liquidated in the past hour, with Bitcoin and Ethereum liquidations each accounting for around $41.5 million. On a daily scale, total liquidations exceeded $350 million, impacting over 90,000 traders, which is noted as a significant number for a weekend.

    While the timing of Wintermute’s reported short positions aligns with the market dip, the exact causality remains uncertain. The price correction could be attributed to a combination of factors, including profit-taking after a rapid ascent and the reported institutional trading activity. It is important to note that the extent to which Wintermute’s actions directly influenced the price drop, and whether other market factors were at play, are subjects of ongoing observation.

    This market event highlights the dynamic interplay between institutional trading strategies and cryptocurrency price action, alongside the significant impact of liquidations on overall market volatility. Further developments and official statements from involved parties may provide more clarity on the situation.

    Why This Matters

    The materials describe a narrow update: Bitcoin’s price fell from over $77,000 to $75,500, with altcoins like Ethereum and XRP also experiencing significant losses. The exact timing of Wintermute building its short positions relative to the price dip.

    Broader Context

    Source materials place the factual news in this context: Bitcoin’s price suddenly dipped to $75,500 after it failed to remain above $77,000 during the weekend.

  • XRP Surges: Breakout Confirmed, What’s Next?

    XRP Surges: Breakout Confirmed, What’s Next?

    XRP Surges in Bullish Breakout After Months of Downtrend

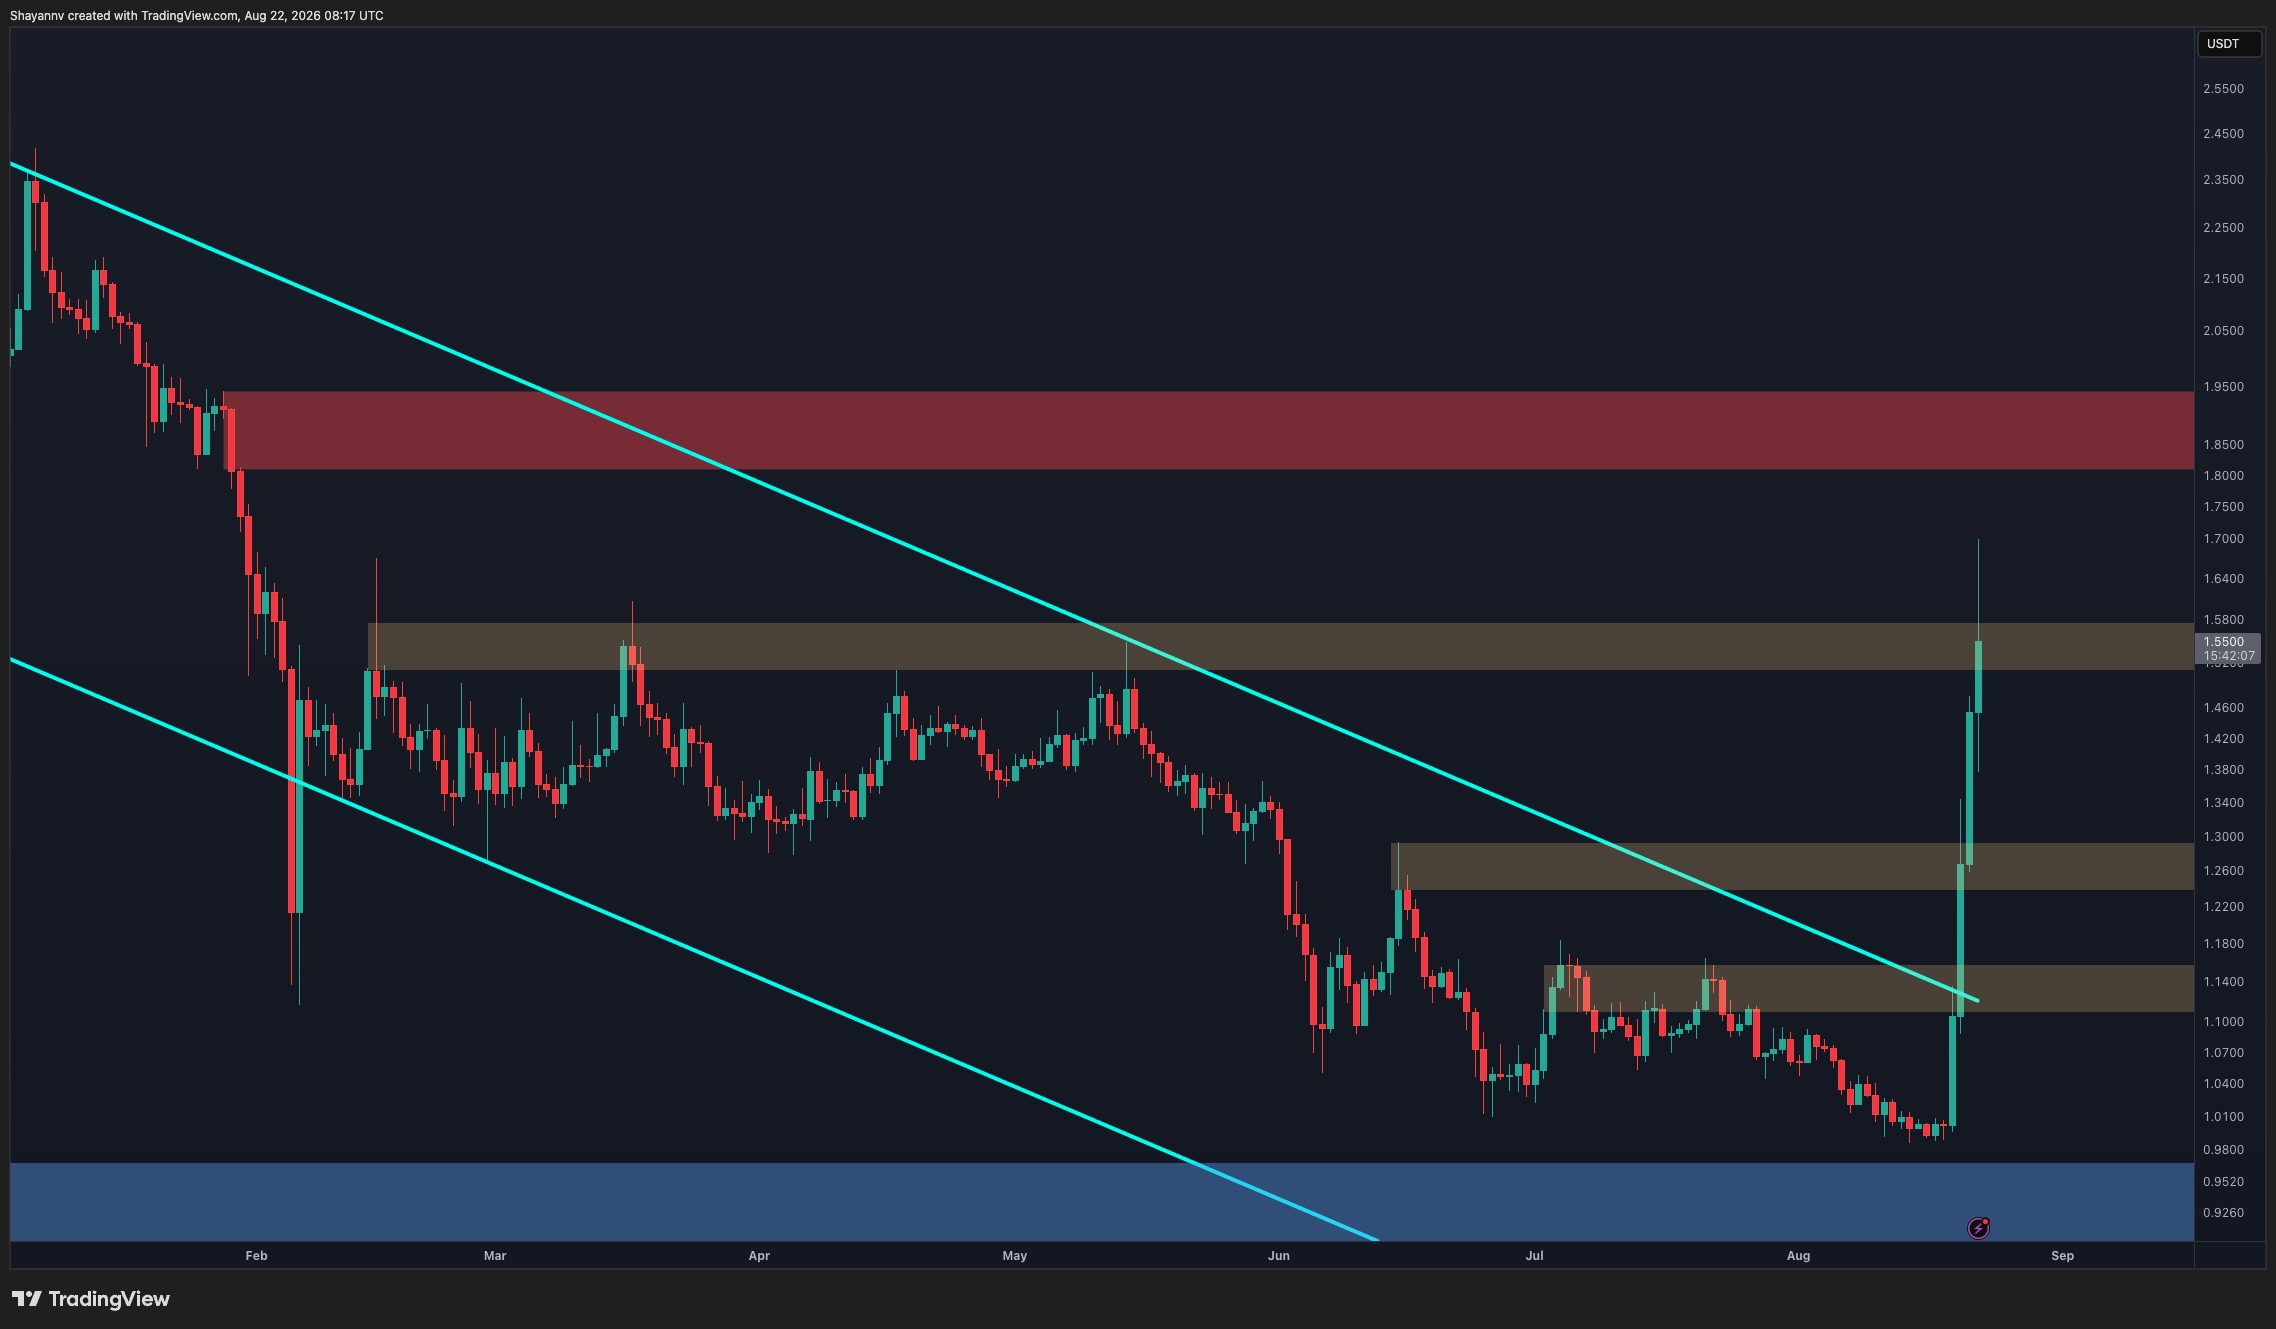
    XRP has experienced a significant bullish breakout, emerging from a prolonged period of decline. This impulsive move has markedly improved the cryptocurrency’s short-term technical structure, though it is now confronting a key resistance area after a rapid ascent.

    On the daily chart, XRP has decisively broken free from a descending channel that had dictated its price action for several months. The breakout, which originated from the support region between approximately $0.98 and $1, propelled the asset through multiple resistance levels, including the channel’s boundary and the $1.10-$1.15 zone.

    The rally has since extended towards $1.55, bringing XRP directly into the critical resistance zone of $1.50-$1.58. The long upper wick, reaching close to $1.70, indicates that sellers have already entered the market at higher price points, suggesting some short-term profit-taking following the near-vertical advance.

    Despite this, the broader structural shift is substantial. Maintaining a position above the former $1.50 region would solidify the breakout and could potentially bring the major resistance zone of $1.82-$1.94 into focus. Conversely, a failure to establish support at current levels could initiate a corrective phase, with the former resistance area between $1.22 and $1.30 serving as an important level to watch.

    Aggressive Rally and Potential Retracement

    The 4-hour timeframe underscores the aggressive nature of XRP’s recent surge. The token broke out from around the $1 mark and climbed as high as $1.70 with minimal consolidation, leaving the market susceptible to a retracement as initial momentum wanes.

    Fibonacci retracement levels highlight several potential support areas should a correction occur. The first significant zone is around the 0.5 level at $1.34, which aligns with the upper boundary of the identified support area between $1.22 and $1.34. Below this, the 0.618 retracement is situated at $1.26, followed by the 0.702 level at $1.20. A deeper pullback could bring the 0.786 level near $1.14 into play, close to another former resistance zone.

    For now, the rejection from $1.70 suggests that the market may need time to consolidate the explosive rally. As long as XRP holds the $1.22-$1.34 zone during any correction, the breakout structure appears constructive, and another attempt at the $1.70 level could follow. However, a sustained loss of this area would increase the likelihood of a deeper retracement towards $1.14-$1.10 before buyers potentially regain control.

  • XRP Surges Over 65%, Outperforming Bitcoin as Altcoins Lead Market Gains

    XRP Surges Over 65%, Outperforming Bitcoin as Altcoins Lead Market Gains

    The cryptocurrency market is experiencing a notable surge in altcoin performance, with XRP leading the gains. XRP has seen a price increase of over 65% since Wednesday, surpassing BNB in market capitalization and outperforming Bitcoin and other major cryptocurrencies. This trend highlights a significant shift in recent market dynamics.

    According to CryptoPotato, XRP’s impressive rise saw it trade above $1.65, a level not seen in many months. This surge followed a period where XRP dipped below the $1.00 support level less than a week prior. The broader market’s rebound on Wednesday is credited with aiding XRP’s recovery, which initially flew to $1.40 before breaking out further.

    BNB also experienced a substantial gain, soaring by 10% today. However, XRP’s performance allowed it to overtake BNB in market capitalization. Other altcoins such as SOL, HYPE, DOGE, ADA, LINK, XLM, BCH, CC, and LTC have also posted double-digit gains. ZEC notably surged by 40% to reach $820, while ETH reclaimed the $2,500 level after a 7% increase. The official Trump (TRUMP) coin also saw a significant rise, skyrocketing by over 60% in the past day and re-entering the top 100 altcoins by market cap.

    Bitcoin has also shown resilience, rebounding from a recent dip to $76,200 and trading above $78,000. The primary cryptocurrency had previously reached near $80,000 on Friday, marking a gain of $15,000 in the preceding 48 hours. Despite this rebound, Bitcoin’s market dominance has seen a slight decrease, moving from 57.9% to 57.1%.

    The overall cryptocurrency market capitalization has experienced substantial growth, adding $100 billion in a single day and $500 billion since Wednesday, bringing the total market cap to $2.760 trillion on CoinGecko. This broad market recovery and growth across various digital assets underscore a dynamic period in the cryptocurrency space.

    Minor uncertainties remain regarding the data, including the mention of ‘CC’ as an entity with double-digit gains, which is not a commonly recognized cryptocurrency ticker, and the precise definition of the ‘Weekend Watch’ period.

    Why This Matters

    The materials describe a narrow update: Several altcoins, led by XRP which surged over 65% and surpassed BNB in market cap, experienced significant price increases. The exact duration of the ‘Weekend Watch’ period is not precisely defined.

    Broader Context

    Source materials place the factual news in this context: The cryptocurrency market is on the move again, but this time the altcoins have taken the spotlight.

  • Analyst Predicts Potential Altcoin Gains, Citing Historical Parallels Amid Market Uncertainty

    Analyst Predicts Potential Altcoin Gains, Citing Historical Parallels Amid Market Uncertainty

    Analyst Matthew Hyland has put forth predictions of substantial returns for altcoins, potentially ranging from 10x to 1000x, drawing comparisons between the recent market pullback and historical events such as the March 2020 market collapse. However, these forecasts are accompanied by significant uncertainty, and the extent to which past performance can reliably predict future outcomes remains a key question.

    Hyland argued that many altcoins could experience a recovery within months, a sentiment echoed by other traders who expressed bullish outlooks for Bitcoin and Ethereum. This perspective is partly based on the observed speed of previous market recoveries. According to Hyland, the June sell-off is being viewed by some as an altcoin equivalent of the March 2020 market collapse, suggesting a potential for rapid recovery. Hyland’s reasoning for altcoin recovery rests partly on the speed of previous market recoveries rather than a specific price target.

    CrediBULL Crypto claimed that the latest market move had indicated a potential macro bottom, with Bitcoin potentially heading above $100,000 and ETH above $3,500. Sykodelic stated that Bitcoin had “sliced through the 200-day Simple Moving Average (SMA) like butter” on its way toward $75,000. Sykodelic pointed to previous Bitcoin moves after similar breaks, citing gains of 124% in 2019, 724% in 2020, and 511% in 2023. Hyland noted, however, that a fall below $65,000 would weaken the argument that the bottom is in, a condition that must be met for the macro bottom to be considered.

    Current Market Snapshot

    In terms of current market performance, Bitcoin was trading above $76,000, marking an increase of nearly 9% over the preceding 24 hours and more than 19% over the past seven days. Ethereum was priced near $2,400, having gained 5% in 24 hours and 26% over the week. XRP was around $1.32, up almost 18% in one day and approximately 29% on the weekly chart. Bitcoin Cash saw an 18% gain over 24 hours, while Dogecoin rose 12% in the same period. The current market run traces back to a Wednesday rally that propelled BTC from the low $60,000s past $70,000, reaching its highest level since May.

    Influencing Factors and Lingering Uncertainties

    Several factors may be influencing the market. The US Treasury reportedly doubled the size of its liquidity-support buybacks for longer-dated government debt. Additionally, a White House meeting occurred where discussions included the CLARITY Act, with President Donald Trump reportedly pushing for its passage and floating the idea of further government Bitcoin purchases. The impact of these events on future market movements remains uncertain.

    While the historical comparisons and current price action offer a basis for optimistic predictions, it is crucial to acknowledge the inherent uncertainties. The exact timing of any predicted altcoin recovery, the definitive confirmation of a macro bottom, and the realization of specific price targets for major cryptocurrencies are all subject to market volatility and unforeseen events. Therefore, while analysts suggest potential for significant gains, these forecasts should be approached with caution, recognizing the speculative nature of the cryptocurrency market.

    Why This Matters

    Analyst Matthew Hyland predicts that altcoins could experience returns of 10x to 1000x after a recent market pullback, comparing the June sell-off to the March 2020 market collapse. The potential for such returns is contingent on various market factors and historical comparisons, with significant uncertainty surrounding the timing and magnitude of any recovery.

    Broader Context

    This market analysis places potential future returns for altcoins within the context of an analyst’s prediction, historical market events, and current price movements, highlighting the speculative nature of such forecasts.