Tag: Neutral

  • Gemini Partners with Apex for Crypto Event Contracts

    Gemini Partners with Apex for Crypto Event Contracts

    Gemini Strikes Deal with Apex Fintech to Offer Crypto Event Contracts

    Gemini, the cryptocurrency exchange, has inked a non-binding letter of intent with Apex Fintech Solutions, a move that would position its subsidiary, Gemini Titan, as the exclusive regulated venue for crypto event contracts.

    Under the proposed arrangement, these contracts will be distributed to Apex’s brokerage customers through its futures commission merchant (FCM). Brokerages utilizing the Apex FCM to offer these contracts will rely on Gemini for execution and clearing services. The agreement also grants Gemini the flexibility to collaborate with Apex on sports, economic, and financial market contracts on a non-exclusive basis. Both companies expressed anticipation for finalizing the details in the coming weeks.

    Gemini’s forward-looking statements acknowledged the non-binding nature of the letter of intent, cautioning investors about the possibility that a definitive agreement may not be reached.

    The path to this agreement involved regulatory approvals from the Commodity Futures Trading Commission (CFTC). Gemini Titan had previously secured a Designated Contract Market (DCM) license in December 2025, enabling it to offer regulated prediction markets to U.S. customers. Gemini had initially applied for this license in March 2020. In April, Gemini Olympus, another subsidiary, obtained a Derivatives Clearing Organization (DCO) license, bringing derivatives clearing and settlement for Gemini Titan in-house.

    “Leveraging more than a decade of experience building and operating a regulated platform for crypto, a new and emergent asset class, we deliberately chose to build our predictions platform in-house,” stated Gemini CEO Tyler Winklevoss. He further emphasized that predictions represent “the future of markets” and that this approach allows Gemini to “expand our offering and open access to valued partners like Apex as demand for event contracts grows.”

    This is not the first collaboration between the two firms. In July, Gemini launched a 0% commission stock trading service for select U.S. customers, with Apex Clearing Corporation serving as the custodian and clearing broker.

    Travis McGhee, Apex’s Global Head of Digital Markets, highlighted the benefits for brokerage clients, stating they will “get regulated access to crypto event contracts without having to build the plumbing themselves.” Apex’s infrastructure reportedly supports hundreds of clients and tens of millions of end investors, with its Apex Clearing Corporation subsidiary holding licenses in 53 states and territories.

    The burgeoning market for event contracts is evident, with Robinhood reporting $156 million in event contract revenue in the second quarter, a more than tenfold increase year-over-year, driven by a record 13.6 billion contracts traded.

    However, Gemini’s prediction market operations are not without legal challenges. The New York Attorney General, Letitia James, has sued the prediction market arms of both Coinbase and Gemini, alleging they operate unlicensed gambling operations without the necessary approval from the New York State Gaming Commission.

    “Gambling by another name is still gambling, and it is not exempt from regulation under our state laws and Constitution,” James asserted.

  • Pelosi Household’s Bloom Energy Investment Sparks Scrutiny Over Timing and Gains

    Pelosi Household’s Bloom Energy Investment Sparks Scrutiny Over Timing and Gains

    A significant investment by Nancy Pelosi’s household in Bloom Energy, disclosed in late August, has drawn scrutiny regarding the timing of the trades and the subsequent financial gains. The transactions, which occurred in late July, involved substantial purchases of Bloom Energy shares and call options, according to financial disclosures.

    According to a report by Barron’s, the accounts belong to Paul Pelosi. The disclosures reveal that 15,000 Bloom Energy shares and 200 call options were purchased on July 24 and July 28. The call options have a $100 strike price and expire in June 2027. These transactions were reported in ranges totaling $3 million to $12 million. The disclosure of these trades did not occur until August 21, weeks after the purchases were made.

    Bloom Energy, based in San Jose, California, develops fuel-cell systems. The company reported record second-quarter revenue exceeding $1 billion after the market closed on July 28, the same day as Pelosi’s second purchase. Following this announcement, Bloom Energy shares rose 26.5% by July 30. The stock traded at $184.89 when 10,000 shares were purchased on July 24, and at $166.84 when an additional 5,000 shares were bought on July 28. Pelosi’s position in Bloom Energy has reportedly netted a 26% gain since the purchases were made.

    Market Reaction and Historical Context

    In the premarket trading on Tuesday following the disclosure, Bloom Energy shares jumped more than 6%. This disclosure adds to years of scrutiny over Pelosi’s financial dealings, with her family’s investments frequently drawing accusations of benefiting from information available through her position in Congress.

    Pelosi has denied insider-trading allegations. A spokesperson for Pelosi’s office told Barron’s, “Speaker Pelosi does not own any stocks and has no knowledge or subsequent involvement in any transactions.” Fact-checkers have also found no evidence supporting several widely circulated claims about her family’s trades.

    Bloom Energy spent $60,000 on federal lobbying in the second quarter, focusing on tax issues related to fuel cells, electrolyzers, hydrogen, and carbon capture, according to investment research platform Quiver Quantitative.

    Regulatory Framework

    The 2012 STOCK Act requires lawmakers to disclose trades over $1,000 within 45 days. While the act subjects lawmakers to insider-trading laws, it does not prohibit them or their spouses from trading individual stocks. Notably, on July 22, Pelosi voted against House bill H.R.700, which proposed tighter restrictions on lawmakers’ and their families’ stock trading. The first Bloom Energy transactions were made two days later.

    Uncertainties remain regarding the exact total value of the Bloom Energy investment, which was reported in ranges, and whether non-public information was known at the time of the trades. However, there is no evidence to suggest that Nancy Pelosi engaged in insider trading or that her investment decisions were directly influenced by her congressional position.

    Why This Matters

    The materials describe a narrow update: Nancy Pelosi’s household disclosed a multimillion-dollar investment in Bloom Energy, including shares and call options purchased in late July. The exact total value of the Bloom Energy investment (reported in ranges of $3 million to $12 million).

    Broader Context

    Source materials place the factual news in this context: Bloom Energy shares jumped more than 6% in premarket trading Tuesday after a financial disclosure from Representative Nancy Pelosi revealed a multimillion-dollar household investment in the fuel-cell company.

  • Blockchain Association Urges Regulators to Limit Stablecoin KYC Scope Under GENIUS Act

    Blockchain Association Urges Regulators to Limit Stablecoin KYC Scope Under GENIUS Act

    The Blockchain Association has urged U.S. federal regulators to narrowly define Know Your Customer (KYC) requirements for stablecoin issuers under proposed rules for the GENIUS Act. The group warned that extending these identity checks beyond direct customer relationships to peer-to-peer transfers could significantly harm the burgeoning stablecoin industry.

    In a comment letter submitted on August 21, the association addressed five federal financial regulators: the Financial Crimes Enforcement Network, the Office of the Comptroller of the Currency, the Federal Reserve, the Federal Deposit Insurance Corporation, and the National Credit Union Administration. The letter responds to proposed rules for customer identification mandated by the GENIUS Act, which establishes a framework for stablecoin issuance and use in the United States.

    The Blockchain Association believes regulators are correct in focusing customer identification on direct customer relationships, particularly in the primary market. The association interprets the GENIUS Act as not extending KYC to downstream, peer-to-peer stablecoin transactions that issuers do not intermediate, facilitate, or approve. They argue that broader requirements could be “nearly impossible” to enforce and would “cripple the industry.”

    Beyond limiting the scope of KYC, the Blockchain Association sought clarity on liability for issuers relying on third-party identity checks. They requested that an issuer who reasonably relies on another institution’s Customer Identification Program should not automatically be held liable if that institution fails to meet its obligations. The association also asked regulators to allow flexibility in adopting modern methods for identity verification.

    The group emphasized that the implementation of these rules should preserve the GENIUS Act’s goals: strong safeguards, workable rules, and room for continued innovation. They also requested coordination with existing anti-money laundering and sanctions requirements, such as those under the Bank Secrecy Act and enforced by the Office of Foreign Assets Control.

    This submission follows recent industry advocacy by the Blockchain Association, including an amicus brief urging the Supreme Court to review a case where a federal appeals court ruled the Federal Reserve could deny a state-chartered crypto bank access to its payment system. Summer K. Mersinger, CEO of the Blockchain Association, is a former CFTC commissioner.

    The exact scope and finalization of the proposed customer identification rules for stablecoin issuers remain uncertain. It is also unclear whether regulators may adopt the Blockchain Association’s recommendations regarding KYC for peer-to-peer transfers.

    Why This Matters

    The materials describe a narrow update: The Blockchain Association urged regulators to limit Know Your Customer (KYC) requirements for stablecoin issuers to direct customer relationships and not extend them to peer-to-peer transfers, warning that broader application could harm the industry. The exact scope and finalization of the proposed customer identification rules for stablecoin issuers.

    Broader Context

    Source materials place the factual news in this context: The GENIUS Act was signed into law in June of last year.

  • XRP’s Momentum Falters After $1.70 Rejection

    XRP’s Momentum Falters After $1.70 Rejection

    XRP Faces Critical Resistance After Sharp Recovery

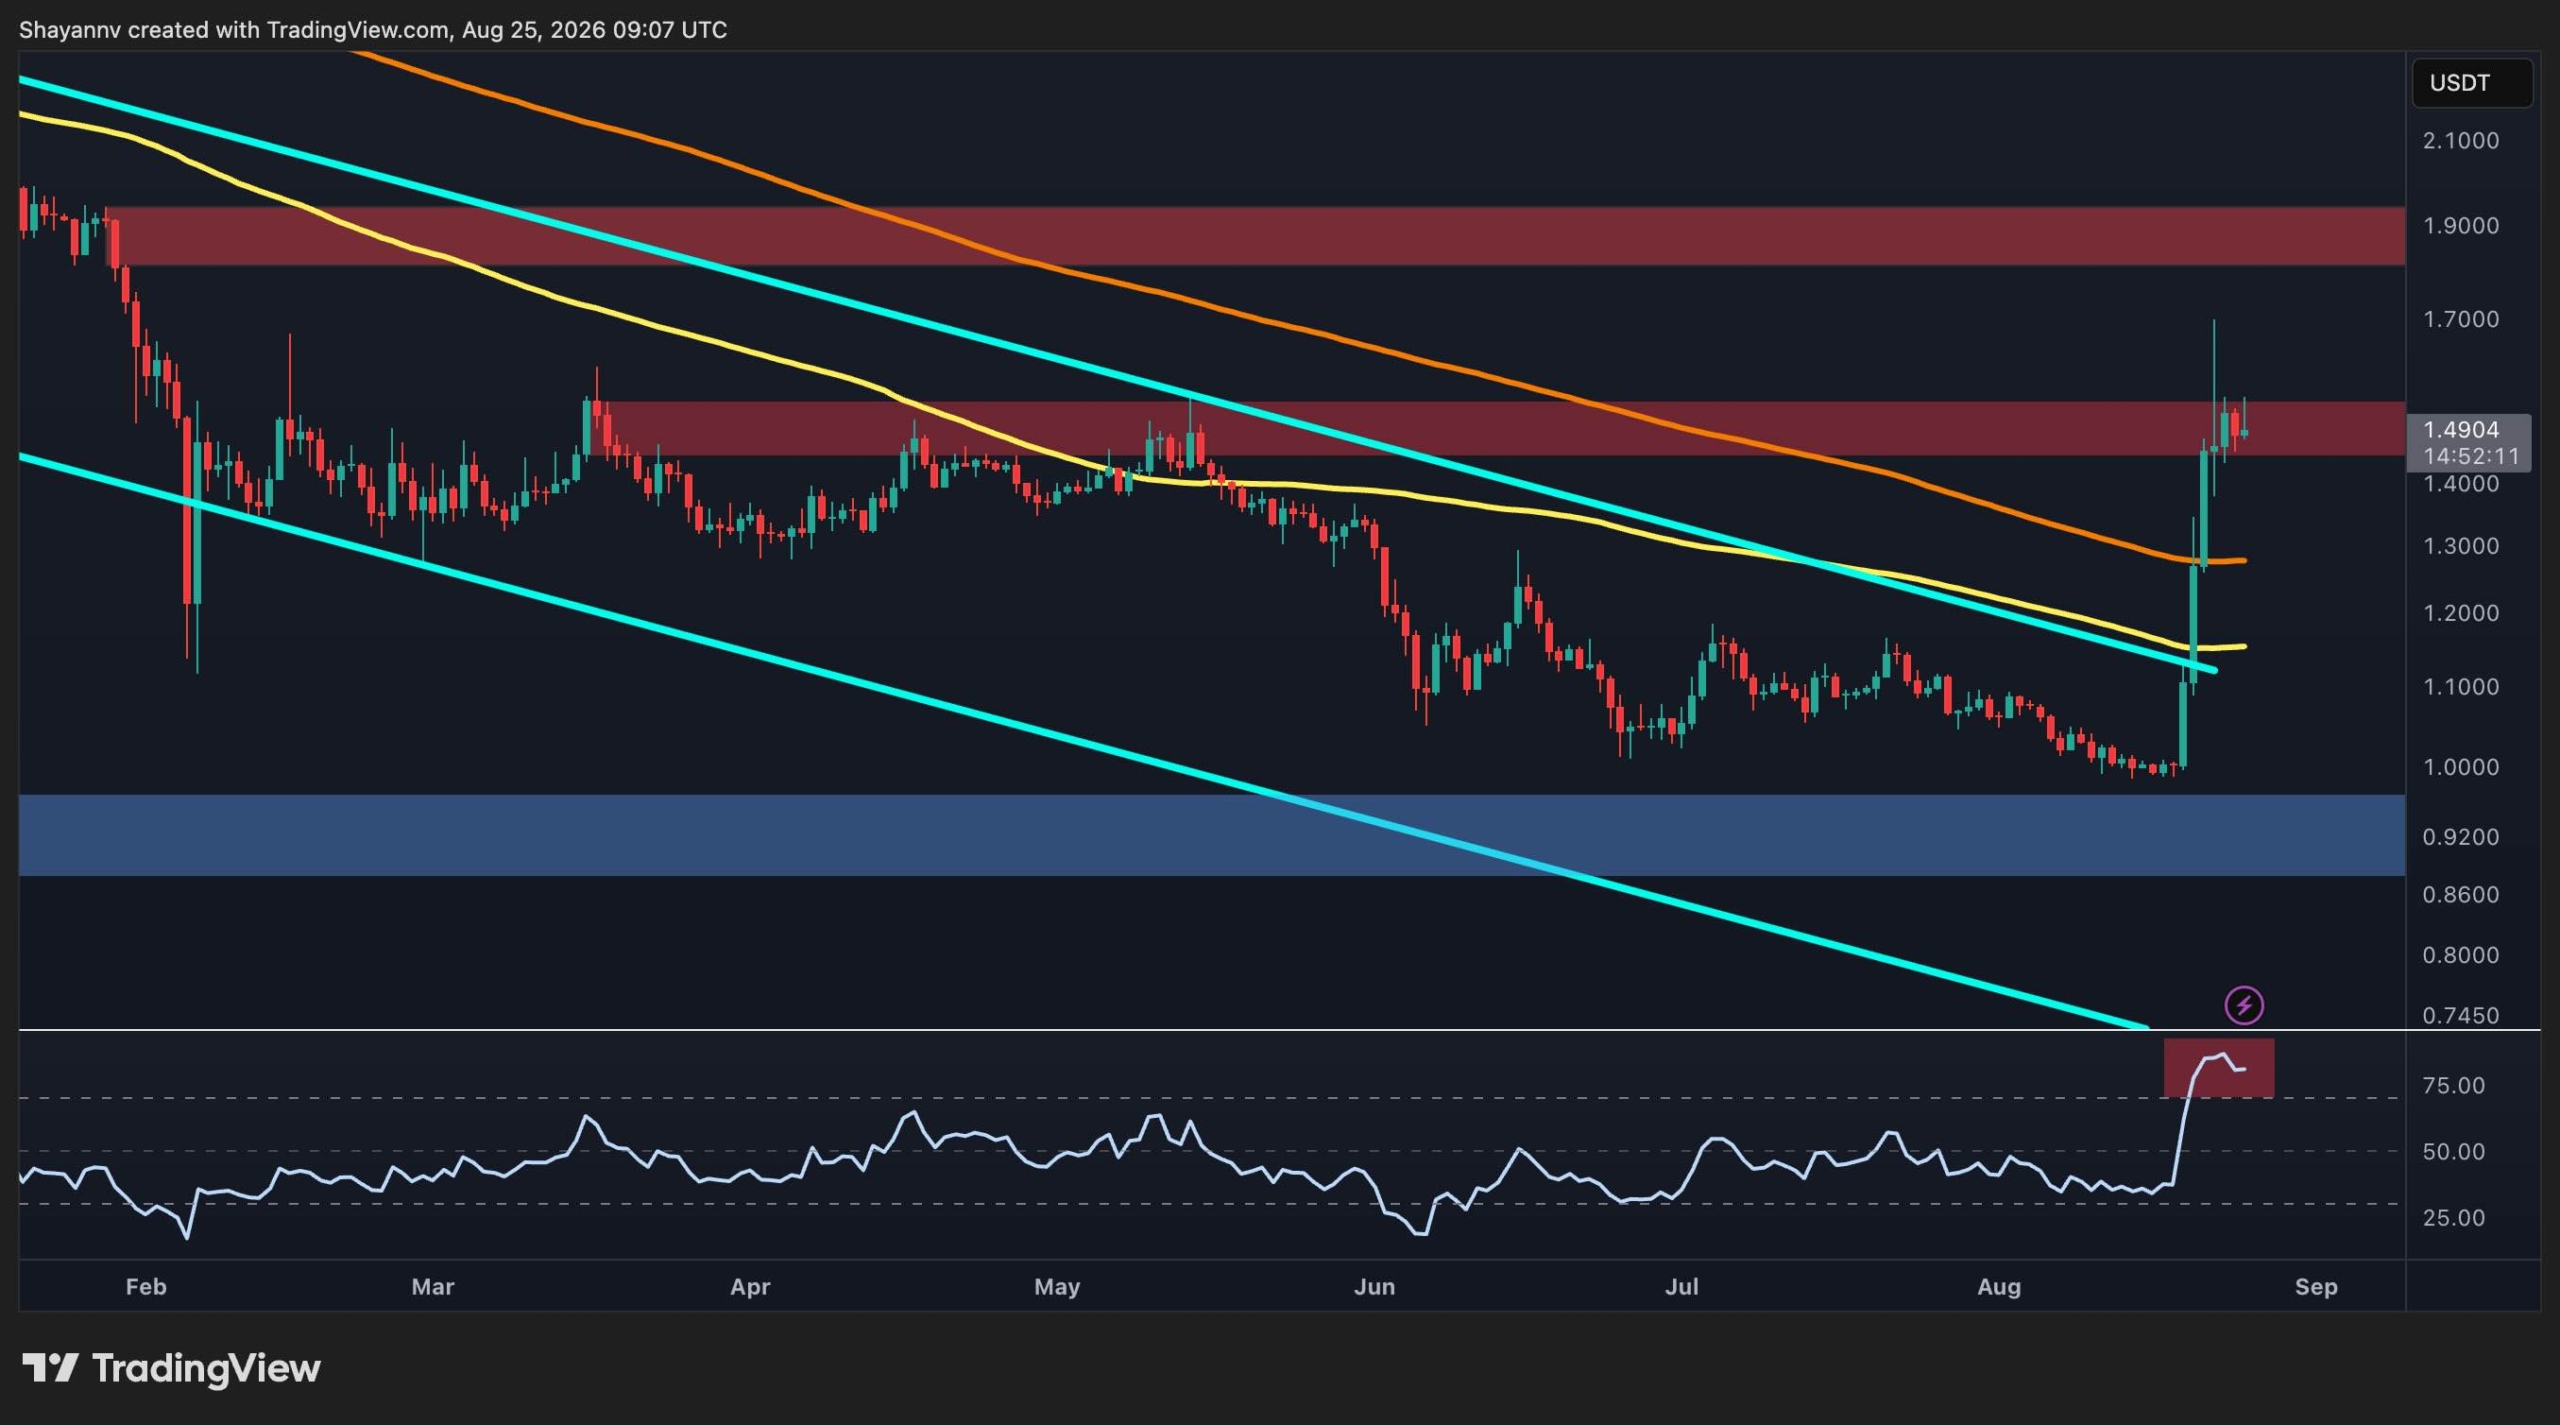
    XRP has experienced a significant rebound, climbing back from the $1.00 mark and successfully breaking through long-standing descending trendlines on both USD and BTC charts. However, the cryptocurrency’s recent rally has now encountered major resistance levels, placing current price action at a crucial juncture for determining its next directional move.

    The digital asset found support around the $1.00 level before breaching its broader descending channel. Subsequently, XRP has re-established its position above both the 100-day and 200-day moving averages, which were previously situated around $1.2 and $1.3, respectively. The move beyond $1.3 has effectively transformed these former resistance points into immediate support zones.

    Currently, XRP is testing the critical $1.50 resistance area, where price consolidation has begun. A decisive daily close above $1.50 could pave the way for a potential advance towards the $1.80-$1.90 range. Conversely, a rejection at this level, followed by a descent below $1.30, would undermine the recent breakout structure and increase the likelihood of a more substantial correction, potentially pushing prices back towards the $1.00 area.

    The Relative Strength Index (RSI) has surged past the 70 mark, remaining in overbought territory. While this indicates strong upward momentum, it also suggests the possibility of a short-term cooldown, which could lead to a retest of the 200-day moving average.

    XRP/BTC Pair Shows Mixed Signals

    On the XRP/BTC daily chart, the price has attempted to break out of its descending channel after reaching a low near 1,500 satoshis. However, unlike its USDT counterpart, this breakout has so far been unsuccessful. The pair briefly traded above the channel’s upper boundary before experiencing a significant rejection wick, indicating persistent selling pressure around this resistance level.

    XRP/BTC is now retracing towards the previously breached 200-day moving average, which is currently serving as a potential support level. The price action around this moving average will be a key determinant for the pair’s next move. If XRP/BTC can maintain its position above this average and solidify the former breakout area as support, another attempt at the 2,000 satoshis resistance zone may follow.

    A successful breach above 2,000 satoshis would bolster the relative strength outlook for XRP against Bitcoin. Conversely, a decisive failure to hold the 200-day moving average would suggest that the recent breakout attempt was a false signal, potentially exposing the pair to further downward pressure. The RSI has also pulled back after a brief stint above 70, reflecting a loss of momentum following the failed breakout and hinting at potential consolidation or correction in the coming weeks.

  • CLARITY Act Faces Critical 60-Vote Senate Hurdle, Shaping Crypto Regulatory Future

    CLARITY Act Faces Critical 60-Vote Senate Hurdle, Shaping Crypto Regulatory Future

    The CLARITY Act, a pivotal piece of legislation designed to clarify the regulatory framework for digital assets, is approaching a critical procedural vote in the U.S. Senate. The bill requires a cloture motion, which necessitates 60 votes, to advance to floor debate. This vote, tentatively targeted for mid-September, could determine whether the future of digital asset regulation is shaped by durable legislation or by the more reversible actions of administrative agencies.

    The CLARITY Act, formally H.R. 3633 or the Digital Asset Market Clarity Act, passed the House of Representatives in July 2025 with a vote of 294-134. Its primary aim is to delineate regulatory responsibilities between the Securities and Exchange Commission (SEC) and the Commodity Futures Trading Commission (CFTC), addressing a long-standing jurisdictional question that has fueled years of enforcement uncertainty and ambiguity for token issuers.

    A cloture motion was filed on August 8, marking the next significant procedural step. However, securing the required 60 votes for cloture remains uncertain. Political considerations, particularly concerning potential conflicts of interest related to President Donald Trump’s cryptocurrency holdings, have emerged as a significant obstacle. Reuters reported that President Trump has earned over $1.4 billion from family crypto ventures since taking office, and a Reuters/Ipsos poll indicated that a majority of Americans believe these holdings have inappropriately influenced policy.

    President Trump hosted crypto executives, including the CEOs of Coinbase, Robinhood, and Kraken, at the White House on August 19. During the meeting, he urged Congress to pass a “fair version” of the CLARITY Act. Despite this high-profile engagement, analysts suggest that such optics may not alter the fundamental vote count in the Senate. Democrats and some Republicans have expressed reservations, citing concerns over conflict-of-interest language within the bill.

    Legislative Path vs. Agency Rulemaking

    If the CLARITY Act fails to achieve cloture, the legislative path forward within the current Congress narrows sharply, given the limited legislative calendar and competing priorities. This outcome would likely shift the regulatory center of gravity towards agency rulemaking. The CFTC has signaled it may leverage existing authority to establish a market-structure regime, and the SEC has separately proposed new rules, such as “Regulation Crypto Assets,” aimed at providing a framework for certain crypto asset investment contracts. While agency actions can offer some clarity, they are inherently more reversible than statutory law, potentially creating instability with future administrations or commission leadership.

    The Substitute Text and Outlook

    The CLARITY Act substitute text, a roughly 600-page revision that merged work from the Senate Banking and Agriculture committees, would move to floor debate if cloture is successful. The passage of the bill, or its failure, is expected to resolve a multi-year overhang on token classification, a key issue for the digital asset industry.

    Reporting has pointed to mid-September, with September 15 discussed as a tentative target for the cloture vote, though this date is not reported in the congressional record and should be treated as a planning window. Regardless of the vote’s outcome, it represents a pivotal moment that may either establish legislative clarity or shift the regulatory focus to agency discretion, impacting the future structure and stability of the digital asset market.

    Why This Matters

    The materials describe a narrow update: The CLARITY Act, which aims to clarify regulatory oversight of digital assets by splitting responsibilities between the SEC and CFTC, has passed the House and is now awaiting a procedural cloture vote in the Senate. Whether the CLARITY Act will secure the necessary 60 votes for cloture in the Senate.

    Broader Context

    Source materials place the factual news in this context: The CLARITY Act cleared a Senate Banking Committee vote and now sits on the chamber’s legislative calendar after a cloture motion was filed on August 8, according to congressional records.

  • XRP Stuck: Analyst Cites Coinbase Trading Walls

    XRP Stuck: Analyst Cites Coinbase Trading Walls

    Analyst Attributes XRP Price Stagnation to Large Coinbase Holders

    An analyst has suggested that substantial holders linked to Coinbase are manipulating XRP’s price through significant buy and sell orders on both sides of the market.

    This theory emerged as the Ripple token traded near $1.51, maintaining a narrow range following a rally that more than doubled its value from early August lows.

    A chart shared by the analyst, identified as CW, depicted XRP consolidating between approximately $1.52 and $1.53. The data indicated substantial sell orders positioned above $1.70 and $2.00, while buy orders were clustered just below $1.52.

    “It is Coinbase whales that are controlling the price of XRP,” the account stated, asserting that these order walls are not intended to drive the price up or down but rather to keep it stable. The analyst further linked this price standoff to U.S. trading desks not yet being prepared for a significant price increase.

    Later, CW provided data on futures positioning, suggesting that conditions for a rally are developing despite the lack of price movement.

    The data revealed that whale long/short ratios on Binance and OKX were both leaning bullish, with OKX’s whale position ratio at 8.16. However, sentiment among sophisticated investors remained divided: extremely bullish on OKX, extremely bearish on Bybit, and mildly bearish on Binance, which represented an improvement from a more bearish outlook the previous day. Taker volume was nearly balanced, with 48.74% of trades indicating long positions and 51.26% indicating short positions.

    In a separate post, CW noted that XRP had surpassed its point of control and a key resistance zone, with the sell wall now positioned above the current price appearing relatively small.

    Exchange-Traded Fund (ETF) flows offered another perspective, showing a net inflow of $13.82 million across XRP ETFs. This was distributed as $8.25 million into Bitwise’s fund, bringing its cumulative assets under management to $551 million; $4.01 million into Franklin’s XRPZ, reaching $438 million cumulatively; and $1.57 million into Canary’s XRPC fund.

    Combined assets under management for XRP ETFs stand at $1.441 billion, with total XRP ETF volume, including spot and other forms, exceeding $207 million for the day.

    CryptoPotato reported that XRP experienced a surge of over 65%, pushing its market capitalization above $94 billion and briefly positioning it as the fourth-largest cryptocurrency, ahead of BNB, before later falling back to fifth.

    The token saw a rapid ascent from below $1.00 to nearly $1.70 in less than 72 hours, reaching its highest level since January, before retracing. Market observers, including EGRAG CRYPTO, identified the $1.65 to $1.70 range as a critical level for determining XRP’s future trajectory.

    Diana, another active trader on X, presented a wave count analysis suggesting $1.79 as the initial target if XRP breaks through resistance between $1.53 and $1.64. Subsequent targets were projected at $2.58 and $2.89, following a potential pullback to the $1.27 to $1.30 range.

    At the time of reporting, XRP was trading around $1.51, representing a more than 50% increase over the past seven days. The token’s trading volume also rose by over 11% from Monday’s figures, reaching $5.9 billion. However, it remains approximately 59% below its all-time high of $3.65, recorded in July 2025.

  • Pi Network’s App Studio Shifts Pricing to Cost-Reflective Model, Prioritizing App Utility

    Pi Network’s App Studio Shifts Pricing to Cost-Reflective Model, Prioritizing App Utility

    The Pi Network Core Team has implemented a significant change to its AI-powered App Studio pricing structure, moving away from heavily subsidized rates to a model that better reflects the actual costs of AI services. This adjustment, effective August 24, aims to ensure that network resources are allocated to applications demonstrating genuine utility, rather than experimental or spam content.

    Previously, developers paid a flat rate of 0.25 PI for both creating and editing an application within the App Studio. The Core Team stated that these previous prices did not accurately represent the underlying expenses of the AI services utilized. The new pricing model will see costs vary based on the AI resources consumed, aligning more closely with actual network expenditures. The team emphasized that this new structure will not include a markup on top of the AI costs.

    Developers whose applications attract a substantial number of real and distinct users will be eligible to continue paying the old subsidized rates. The Pi Network Core Team indicated that eligibility for these subsidized rates is determined by existing App Studio data and is subject to evolution over time, with the qualification criteria potentially changing.

    The primary objective behind this pricing recalibration, as explained by the team, is to prevent the depletion of network resources on non-essential activities. By incentivizing the creation of products that users actively engage with and value, the Pi Network seeks to cultivate a more sustainable and utility-focused ecosystem. This strategic shift aims to redirect subsidies towards applications that exhibit tangible utility, based on data gathered regarding Pioneer platform usage.

    This evolution in the App Studio’s economic model introduces a new dynamic for Pi Network developers. While the move towards cost-reflectivity and utility-based incentives could foster the development of more robust and user-centric applications, it also introduces certain uncertainties. The precise nature of the variable pricing, dependent on consumed resources, and the specific, evolving criteria for qualifying for subsidized rates remain areas where clarity is still developing.

    In the broader cryptocurrency market, Pi Network’s native token (PI) is currently trading around $0.09. This period has seen Bitcoin (BTC) and many other altcoins experience notable gains, a rally that PI has not fully mirrored. The adjustments to the App Studio pricing represent a strategic initiative by the Pi Network Core Team to manage resources effectively and encourage development that aligns with the network’s long-term objectives.

    Why This Matters

    The materials describe a narrow update: The Pi Network Core Team has changed the pricing for its AI-powered App Studio. The exact new pricing model, as it can vary depending on consumed resources.

    Broader Context

    Source materials place the factual news in this context: The Core Team behind the popular yet controversial project has officially implemented a major change to the pricing structure of its AI-powered App Studio, as they announced last week.

  • USDⓈ-M Perpetual Contracts Margin Tiers Updated

    USDⓈ-M Perpetual Contracts Margin Tiers Updated

    Binance Futures Adjusts Leverage and Margin Tiers for Multiple Perpetual Contracts

    Binance Futures announced an upcoming adjustment to the leverage and margin tiers for several USDⓈ-M Perpetual Contracts. The update, scheduled to be completed within approximately one hour, will affect existing positions and may impact futures running grid strategies.

    Key Considerations for Traders

    Users are advised to note that existing positions opened before the update will be subject to the new leverage and margin tiers. Furthermore, futures running grid strategies might expire due to these changes, and traders are encouraged to adjust their positions accordingly before the update takes effect.

    FILUSDT Contract Update

    On August 28, 2026, at 06:30 (UTC), the FILUSDT USDⓈ-M Perpetual Contract will undergo changes to its leverage and margin tiers.

    Previous Leverage and Margin Tiers for FILUSDT:

    | Leverage Before Change | Position Before Change (Notional Value in USDT) | Maintenance Margin Rate Before Change |
    | :——————— | :———————————————- | :———————————- |
    | 51 – 75x | 0 < Position ≤ 50,000 | 0.60% |
    | 41 – 50x | 50,000 < Position ≤ 250,000 | 1.00% |
    | 26 – 40x | 250,000 < Position ≤ 350,000 | 1.50% |
    | 21 – 25x | 350,000 < Position ≤ 600,000 | 2.00% |
    | 11 – 20x | 600,000 < Position ≤ 1,000,000 | 2.50% |
    | 6 – 10x | 1,000,000 < Position ≤ 5,000,000 | 5.00% |
    | 5x | 5,000,000 < Position ≤ 10,000,000 | 10.00% |
    | 3 – 4x | 10,000,000 < Position ≤ 12,500,000 | 12.50% |
    | 2x | 12,500,000 < Position ≤ 25,000,000 | 25.00% |
    | 1x | 25,000,000 < Position ≤ 50,000,000 | 50.00% |

    New Leverage and Margin Tiers for FILUSDT:

    | Leverage After Change | Position After Change (Notional Value in USDT) | Maintenance Margin Rate After Change |
    | :——————– | :——————————————— | :——————————— |
    | 51 – 75x | 0 < Position ≤ 20,000 | 1.00% |
    | 41 – 50x | 20,000 < Position ≤ 200,000 | 1.50% |
    | 26 – 40x | 200,000 < Position ≤ 400,000 | 2.00% |
    | 21 – 25x | 400,000 < Position ≤ 800,000 | 2.50% |
    | 11 – 20x | 800,000 < Position ≤ 3,000,000 | 5.00% |
    | 6 – 10x | 3,000,000 < Position ≤ 7,500,000 | 10.00% |
    | 5x | 7,500,000 < Position ≤ 10,000,000 | 12.50% |
    | 3 – 4x | 10,000,000 < Position ≤ 12,500,000 | 25.00% |
    | 2x | 12,500,000 < Position ≤ 15,000,000 | 50.00% |
    | 1x | NA | NA |

    ROBOUSDT Contract Update

    The ROBOUSDT USDⓈ-M Perpetual Contract will also see adjustments to its leverage and margin tiers on August 28, 2026, at 06:30 (UTC).

    Previous Leverage and Margin Tiers for ROBOUSDT:

    | Leverage Before Change | Position Before Change (Notional Value in USDT) | Maintenance Margin Rate Before Change |
    | :——————— | :———————————————- | :———————————- |
    | 26 – 50x | 0 < Position ≤ 5,000 | 1.50% |
    | 21 – 25x | 5,000 < Position ≤ 10,000 | 2.00% |
    | 11 – 20x | 10,000 < Position ≤ 25,000 | 2.50% |
    | 6 – 10x | 25,000 < Position ≤ 62,500 | 5.00% |
    | 5x | 62,500 < Position ≤ 125,000 | 10.00% |
    | 4x | 125,000 < Position ≤ 250,000 | 12.50% |
    | 3x | 250,000 < Position ≤ 500,000 | 16.67% |
    | 2x | 500,000 < Position ≤ 7,500,000 | 25.00% |
    | 1x | 7,500,000 < Position ≤ 12,500,000 | 50.00% |

    New Leverage and Margin Tiers for ROBOUSDT:

    | Leverage After Change | Position After Change (Notional Value in USDT) | Maintenance Margin Rate After Change |
    | :——————– | :——————————————— | :——————————— |
    | 21 – 25x | 0 < Position ≤ 5,000 | 2.00% |
    | 11 – 20x | 5,000 < Position ≤ 10,000 | 2.50% |
    | 6 – 10x | 10,000 < Position ≤ 20,000 | 5.00% |
    | 5x | 20,000 < Position ≤ 50,000 | 10.00% |
    | 4x | 50,000 < Position ≤ 100,000 | 12.50% |
    | 3x | 100,000 < Position ≤ 250,000 | 16.67% |
    | 2x | 250,000 < Position ≤ 2,500,000 | 25.00% |
    | 1x | 2,500,000 < Position ≤ 5,000,000 | 50.00% |
    | NA | NA | NA |

    LPTUSDT and ZRXUSDT Contract Updates

    The LPTUSDT and ZRXUSDT USDⓈ-M Perpetual Contracts will also be subject to leverage and margin tier adjustments on August 28, 2026, at 06:30 (UTC).

    Previous Leverage and Margin Tiers for LPTUSDT and ZRXUSDT:

    | Leverage Before Change | Position Before Change (Notional Value in USDT) | Maintenance Margin Rate Before Change |
    | :——————— | :———————————————- | :———————————- |
    | 51 – 75x | 0 < Position ≤ 5,000 | 1.00% |
    | 26 – 50x | 5,000 < Position ≤ 10,000 | 1.50% |
    | 21 – 25x | 10,000 < Position ≤ 25,000 | 2.00% |
    | 11 – 20x | 25,000 < Position ≤ 50,000 | 2.50% |
    | 6 – 10x | 50,000 < Position ≤ 125,000 | 5.00% |
    | 5x | 125,000 < Position ≤ 250,000 | 10.00% |
    | 4x | 250,000 < Position ≤ 500,000 | 12.50% |
    | 3x | 500,000 < Position ≤ 1,000,000 | 16.67% |
    | 2x | 1,000,000 < Position ≤ 7,500,000 | 25.00% |
    | 1x | 7,500,000 < Position ≤ 12,500,000 | 50.00% |

    New Leverage and Margin Tiers for LPTUSDT and ZRXUSDT:

    | Leverage After Change | Position After Change (Notional Value in USDT) | Maintenance Margin Rate After Change |
    | :——————– | :——————————————— | :——————————— |
    | 21 – 50x | 0 < Position ≤ 5,000 | 1.50% |
    | 11 – 20x | 5,000 < Position ≤ 10,000 | 2.50% |
    | 6 – 10x | 10,000 < Position ≤ 20,000 | 5.00% |
    | 5x | 20,000 < Position ≤ 50,000 | 10.00% |
    | 4x | 50,000 < Position ≤ 250,000 | 12.50% |
    | 3x | 250,000 < Position ≤ 500,000 | 16.67% |
    | 2x | 500,000 < Position ≤ 7,500,000 | 25.00% |
    | 1x | 7,500,000 < Position ≤ 12,500,000 | 50.00% |
    | NA | NA | NA |

    SPORTFUNUSDT Contract Update

    The SPORTFUNUSDT USDⓈ-M Perpetual Contract will also see changes to its leverage and margin tiers on August 28, 2026, at 06:30 (UTC).

    Previous Leverage and Margin Tiers for SPORTFUNUSDT:

    | Leverage Before Change | Position Before Change (Notional Value in USDT) | Maintenance Margin Rate Before Change |
    | :——————— | :———————————————- | :———————————- |
    | 11 – 20x | 0 < Position ≤ 5,000 | 2.50% |
    | 6 – 10x | 5,000 < Position ≤ 10,000 | 5.00% |
    | 5x | 10,000 < Position ≤ 50,000 | 10.00% |
    | 4x | 50,000 < Position ≤ 100,000 | 12.50% |
    | 3x | 100,000 < Position ≤ 250,000 | 16.67% |
    | 2x | 250,000 < Position ≤ 2,500,000 | 25.00% |
    | 1x | 2,500,000 < Position ≤ 5,000,000 | 50.00% |

    New Leverage and Margin Tiers for SPORTFUNUSDT:

    | Leverage After Change | Position After Change (Notional Value in USDT) | Maintenance Margin Rate After Change |
    | :——————– | :——————————————— | :——————————— |
    | 6 – 10x | 0 < Position ≤ 10,000 | 5.00% |
    | 5x | 10,000 < Position ≤ 60,000 | 10.00% |
    | 4x | 60,000 < Position ≤ 70,000 | 12.50% |
    | 3x | 70,000 < Position ≤ 250,000 | 16.67% |
    | 2x | 250,000 < Position ≤ 2,500,000 | 25.00% |
    | 1x | 2,500,000 < Position ≤ 5,000,000 | 50.00% |
    | NA | NA | NA |

    NOMUSDT Contract Update

    The NOMUSDT USDⓈ-M Perpetual Contract will also see adjustments to its leverage and margin tiers on August 28, 2026, at 06:30 (UTC).

    Previous Leverage and Margin Tiers for NOMUSDT:

    | Leverage Before Change | Position Before Change (Notional Value in USDT) | Maintenance Margin Rate Before Change |
    | :——————— | :———————————————- | :———————————- |
    | 11 – 20x | 0 < Position ≤ 5,000 | 2.50% |
    | 6 – 10x | 5,000 < Position ≤ 10,000 | 5.00% |
    | 5x | 10,000 < Position ≤ 60,000 | 10.00% |
    | 4x | 60,000 < Position ≤ 70,000 | 12.50% |
    | 3x | 70,000 < Position ≤ 250,000 | 16.67% |
    | 2x | 250,000 < Position ≤ 2,500,000 | 25.00% |
    | 1x | 2,500,000 < Position ≤ 5,000,000 | 50.00% |

    New Leverage and Margin Tiers for NOMUSDT:

    | Leverage After Change | Position After Change (Notional Value in USDT) | Maintenance Margin Rate After Change |
    | :——————– | :——————————————— | :——————————— |
    | 6 – 10x | 0 < Position ≤ 10,000 | 5.00% |
    | 5x | 10,000 < Position ≤ 60,000 | 10.00% |
    | 4x | 60,000 < Position ≤ 70,000 | 12.50% |
    | 3x | 70,000 < Position ≤ 250,000 | 16.67% |
    | 2x | 250,000 < Position ≤ 2,500,000 | 25.00% |
    | 1x | 2,500,000 < Position ≤ 5,000,000 | 50.00% |
    | NA | NA | NA |

    SAGAUSDT Contract Update

    The SAGAUSDT USDⓈ-M Perpetual Contract will also see adjustments to its leverage and margin tiers on August 28, 2026, at 06:30 (UTC).

    Previous Leverage and Margin Tiers for SAGAUSDT:

    | Leverage Before Change | Position Before Change (Notional Value in USDT) | Maintenance Margin Rate Before Change |
    | :——————— | :———————————————- | :———————————- |
    | 11 – 20x | 0 < Position ≤ 5,000 | 2.50% |
    | 6 – 10x | 5,000 < Position ≤ 10,000 | 5.00% |
    | 5x | 10,000 < Position ≤ 60,000 | 10.00% |
    | 4x | 60,000 < Position ≤ 70,000 | 12.50% |
    | 3x | 70,000 < Position ≤ 250,000 | 16.67% |
    | 2x | 250,000 < Position ≤ 2,500,000 | 25.00% |
    | 1x | 2,500,000 < Position ≤ 5,000,000 | 50.00% |

    New Leverage and Margin Tiers for SAGAUSDT:

    | Leverage After Change | Position After Change (Notional Value in USDT) | Maintenance Margin Rate After Change |
    | :——————– | :——————————————— | :——————————— |
    | 6 – 10x | 0 < Position ≤ 10,000 | 5.00% |
    | 5x | 10,000 < Position ≤ 60,000 | 10.00% |
    | 4x | 60,000 < Position ≤ 70,000 | 12.50% |
    | 3x | 70,000 < Position ≤ 250,000 | 16.67% |
    | 2x | 250,000 < Position ≤ 2,500,000 | 25.00% |
    | 1x | 2,500,000 < Position ≤ 5,000,000 | 50.00% |
    | N/A | N/A | N/A |

    QNTXUSDT and SHAZUSDT Contract Updates

    The QNTXUSDT and SHAZUSDT USDⓈ-M Perpetual Contracts will also be subject to leverage and margin tier adjustments on August 28, 2026, at 06:30 (UTC).

    Previous Leverage and Margin Tiers for QNTXUSDT and SHAZUSDT:

    | Leverage Before Change | Position Before Change (Notional Value in USDT) | Maintenance Margin Rate Before Change |
    | :——————— | :———————————————- | :———————————- |
    | 16 – 20x | 0 < Position ≤ 100,000 | 2.50% |
    | 11 – 15x | 100,000 < Position ≤ 500,000 | 3.33% |
    | 6 – 10x | 500,000 < Position ≤ 2,000,000 | 5.00% |
    | 5x | 2,000,000 < Position ≤ 5,000,000 | 10.00% |
    | 4x | 5,000,000 < Position ≤ 10,000,000 | 12.50% |
    | 3x | 10,000,000 < Position ≤ 25,000,000 | 16.67% |
    | 2x | 25,000,000 < Position ≤ 50,000,000 | 25.00% |
    | 1x | 50,000,000 < Position ≤ 100,000,000 | 50.00% |

    New Leverage and Margin Tiers for QNTXUSDT and SHAZUSDT:

    | Leverage After Change | Position After Change (Notional Value in USDT) | Maintenance Margin Rate After Change |
    | :——————– | :——————————————— | :——————————— |
    | 6 – 10x | 0 < Position ≤ 200,000 | 5.00% |
    | 5x | 200,000 < Position ≤ 2,000,000 | 10.00% |
    | 4x | 2,000,000 < Position ≤ 3,000,000 | 12.50% |
    | 3x | 3,000,000 < Position ≤ 5,000,000 | 16.67% |
    | 2x | 5,000,000 < Position ≤ 7,500,000 | 25.00% |
    | 1x | 7,500,000 < Position ≤ 12,000,000 | 50.00% |
    | NA | NA | NA |

    STRCUSDT and BSPUSDT Contract Updates

    The STRCUSDT and BSPUSDT USDⓈ-M Perpetual Contracts will also see adjustments to their leverage and margin tiers on August 28, 2026, at 06:30 (UTC).

    Previous Leverage and Margin Tiers for STRCUSDT and BSPUSDT:

    | Leverage Before Change | Position Before Change (Notional Value in USDT) | Maintenance Margin Rate Before Change |
    | :——————— | :———————————————- | :———————————- |
    | 21 – 25x | 0 < Position ≤ 250,000 | 2.00% |
    | 16 – 20x | 250,000 < Position ≤ 1,000,000 | 2.50% |
    | 11 – 15x | 1,000,000 < Position ≤ 2,000,000 | 3.33% |
    | 6 – 10x | 2,000,000 < Position ≤ 5,000,000 | 5.00% |
    | 5x | 5,000,000 < Position ≤ 8,000,000 | 10.00% |
    | 4x | 8,000,000 < Position ≤ 15,000,000 | 12.50% |
    | 3x | 15,000,000 < Position ≤ 25,000,000 | 16.67% |
    | 2x | 25,000,000 < Position ≤ 50,000,000 | 25.00% |
    | 1x | 50,000,000 < Position ≤ 200,000,000 | 50.00% |

    New Leverage and Margin Tiers for STRCUSDT and BSPUSDT:

    | Leverage After Change | Position After Change (Notional Value in USDT) | Maintenance Margin Rate After Change |
    | :——————– | :——————————————— | :——————————— |
    | 6 – 10x | 0 < Position ≤ 200,000 | 5.00% |
    | 5x | 200,000 < Position ≤ 2,000,000 | 10.00% |
    | 4x | 2,000,000 < Position ≤ 3,000,000 | 12.50% |
    | 3x | 3,000,000 < Position ≤ 5,000,000 | 16.67% |
    | 2x | 5,000,000 < Position ≤ 7,500,000 | 25.00% |
    | 1x | 7,500,000 < Position ≤ 12,000,000 | 50.00% |
    | NA | NA | NA |

    Important Note on Collateral Ratio

    Users are reminded that the collateral ratio will influence the Unified Maintenance Margin Ratio (uniMMR). Traders should closely monitor their uniMMR to mitigate any potential liquidations or losses that may arise from these changes.

  • Shiba Inu Price Jumps 22% Amid Divergent Analyst Views and Declining Burn Rate

    Shiba Inu Price Jumps 22% Amid Divergent Analyst Views and Declining Burn Rate

    Shiba Inu (SHIB) has seen a significant price increase of 22% over the past week, reaching a three-month high. However, the sustainability of this rally is uncertain, with on-chain metrics like the coin burn rate showing a substantial decline and activity on its Shibarium network remaining subdued.

    The meme coin, often referred to as the ‘Dogecoin killer,’ is currently trading around $0.000005455, boasting a market capitalization that has surpassed $3.2 billion. This recent surge has prompted a wide array of price predictions from market analysts, underscoring a clear divergence in expert opinions.

    Technical Optimism and Bullish Forecasts

    Some analysts highlight technical formations and historical patterns as indicators of potential future growth. According to Crypto Patel, SHIB has completed a 95% macro correction over the years and is now trading within a historical accumulation zone, suggesting the current weekly structure is mirroring fractals that preceded previous price explosions. Crypto With Gopal opined that SHIB has formed a textbook falling wedge pattern and is consolidating within a long-term descending structure, noting that sellers appear to be losing momentum as the price compresses near the lower boundary.

    These technical observations have fueled optimistic price targets. Crypto With Gopal suggested that a clear break above the upper trendline could lead to a significant rally, potentially reaching $0.00025, which would represent an increase of nearly 5,000% from current levels. Crypto Patel claimed the coin could be gearing up for a 2,200% rally. David Gokhshtein commented on the broader meme coin market, stating that those dismissing Dogecoin (DOGE), SHIB, and PEPE might face a “rude awakening.” Whale News Daily suggested that Shiba Inu’s ignition could be “epic” and signal the start of a broader altcoin season.

    Cautionary On-Chain Metrics

    Conversely, other data points raise concerns about the longevity of SHIB’s current momentum. The coin burn rate has seen a significant decline, dropping by over 91% in the past month. This substantial decrease indicates that only a negligible amount of SHIB tokens have been burned, leaving the overall supply enormous. Furthermore, daily transactions processed on Shibarium, Shiba Inu’s layer-2 scaling solution, are reportedly in the mere thousands. This low level of network activity signals weak user engagement and could potentially undermine investor confidence in the ecosystem’s growth and utility.

    Market Context and Uncertain Outlook

    The current market context sees meme coins benefiting from a general market pump, with Shiba Inu being a prominent example. While some participants believe there is ample room for further growth, the aforementioned on-chain metrics suggest that the rally may not be as sustainable as bulls might hope.

    The uncertainty surrounding SHIB’s future trajectory is a key takeaway. While technical indicators and some analyst predictions suggest potential for significant gains, the declining burn rate and low network activity on Shibarium present considerable headwinds. Investors are left to weigh the optimistic technical outlook against the cautionary on-chain data, making the sustainability of the current rally a significant question mark.

    Why This Matters

    The materials describe a narrow update: The price of Shiba Inu (SHIB) has risen significantly over the past week, reaching a notable high. Whether the current rally is sustainable.

  • Analyzing the Factors and Uncertainties Behind Microsoft Copilot AI’s XRP Price Prediction

    Analyzing the Factors and Uncertainties Behind Microsoft Copilot AI’s XRP Price Prediction

    Microsoft Copilot AI has issued a price prediction for Ripple’s XRP, forecasting a potential rise to between $4 and $7 by the end of 2026, with a base case scenario near $5. However, this prediction is framed by significant uncertainties and relies on a complex interplay of market factors, rather than offering a not assured outcome.

    Why This Matters

    The materials describe a narrow update: Microsoft Copilot AI has issued a price prediction for XRP, forecasting a potential rise to $4-$7 by the end of 2026, with $5 as a base case. Whether RLUSD adoption will slow.

    Broader Context

    Source materials place the factual news in this context: A rally of a few days has repriced an entire year of drift.

    Key Drivers and Market Dynamics

    The AI model’s outlook is influenced by several key developments. Recent accumulation by large holders, often referred to as ‘whales,’ has seen over 300 million XRP acquired, tightening the available supply. This was followed by a substantial short squeeze, reportedly valued at $1.25 billion, which forced liquidations and contributed to a rapid price increase. These events have shifted market dynamics, with XRP currently trading around $1.50.

    Further bolstering the bullish perspective are indicators of growing utility and institutional interest. Ripple’s RLUSD stablecoin has surpassed a $2 billion market capitalization, suggesting increased genuine usage on the XRP Ledger. Additionally, institutional investors have shown renewed interest, with ETF inflows reportedly jumping by nearly $40 million in a single week. Microsoft Copilot AI interprets these catalysts as reinforcing momentum that could sustain price expansion into 2026.

    Historical Context and Technical Indicators

    To contextualize the current situation, XRP’s price history reveals significant volatility. The asset traded above $3.40 last September, but subsequently experienced a decline, reaching a capitulation point around $1.13 in February 2026. Following this, XRP traded within a range of approximately $1.30 to $1.60 for six months before a notable move in June coincided with a price consolidation near $1.00. This $1.00 level acted as support through July and most of August, until a recent spike last week saw XRP reach $1.68 before pulling back.

    Currently, XRP closed at $1.50054, marking a 2.63% gain for the session, with trading occurring between $1.43474 and $1.55082. Technical analysis indicates resistance levels at $1.55082, the recent spike high of $1.68, and an older shelf at $1.80. Support is observed around $1.43474 and $1.30, with a structural base at $1.00.

    The Relative Strength Index (RSI) currently reads 86.45, significantly above its signal line of 51.64. This high RSI reading suggests that buyers are in strong control, but also indicates that the indicator has moved to an extreme, often demanding a period of rest or consolidation. While the current momentum is strong, its sustainability at face value is questionable without further market digestion.

    Uncertainties and Potential Risks

    Despite the positive signals, several uncertainties loom. The AI model’s bear case scenario suggests that a slowdown in RLUSD adoption or unforeseen regulatory setbacks could lead to XRP retracing towards the $1.20-$1.30 range. The long-term trajectory also depends on whether fresh demand continues to absorb supply effectively. These factors highlight that the AI’s prediction is a projection based on current trends, not a certainty.

    In conclusion, while Microsoft Copilot AI’s prediction offers a bullish outlook for XRP by the end of 2026, it is crucial to interpret this within the context of significant underlying uncertainties and market dynamics. The growth of stablecoin adoption, institutional inflows, and whale accumulation are key drivers, but potential regulatory challenges and adoption rates remain critical variables. As the market digests recent price movements, the sustainability of XRP’s upward trend will depend on these evolving factors, underscoring the importance of evidence-based analysis over speculative forecasts.