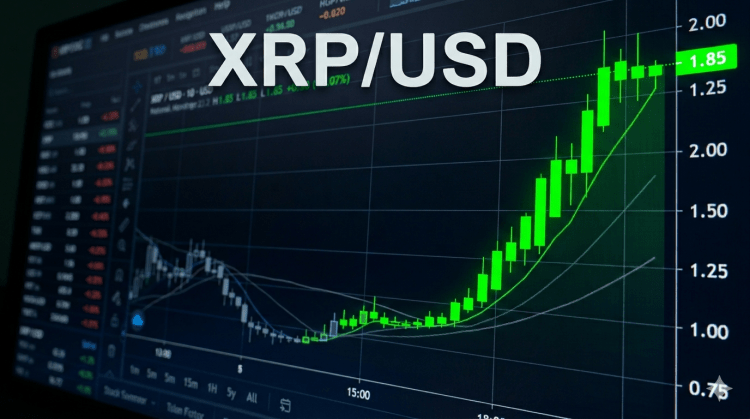
XRP Eyes Potential Surge as Rare Technical Signal Repeats
XRP may be on the cusp of a significant price recovery, driven by a rare technical indicator that has historically preceded substantial rallies for the cryptocurrency. This signal, observed across multiple market cycles, is currently flashing again, prompting close attention from analysts.
A Pattern Decades in the Making
Analysis reveals that XRP’s price has been guided by a long-term ascending channel since 2017. The token is currently positioned just above the lower support boundary of this channel. This confluence of factors, coupled with a deeply oversold momentum reading, has captured the interest of market observers.
The monthly Relative Strength Index (RSI) for XRP has dipped to 42.7, according to market commentator Celal Kucuker. This level is nearing the lowest points recorded in XRP’s trading history, a condition that has occurred only three times previously: in November 2015, March 2020, and August 2022. Each of these instances was followed by a notable upward price movement.
Kucuker highlighted on social media that the monthly momentum indicator for XRP has reached similar extreme low zones before each major rally. The 2015 occurrence coincided with XRP trading within a symmetrical triangle pattern, with the price pulling back to around $0.0040 and the monthly RSI at 46.7, preceding the broad 2017 rally. In March 2020, amidst widespread market selling, the monthly RSI fell to 43.7, and XRP saw a low near $0.104 before climbing to $1.97 by April 2021. The third instance in August 2022 saw prices drop to $0.31 with the RSI at 43.9, ultimately leading to a rise to $3.40 by January 2025.
What the Chart is Showing Now
XRP has experienced a decline of over 10% in June alone, with the first four days of the month pushing the token to multi-month lows around $1.18. The past week saw a 9% decrease. Despite this selling pressure, reports indicate that XRP has maintained its position above the lower boundary of the ascending channel that has contained its price movements for nearly a decade.
Kucuker’s analysis emphasizes that the current setup is distinguished by the simultaneous occurrence of two key conditions: the price holding at long-term structural support while the monthly momentum indicator has retreated to historically low levels. In previous cycles, momentum reached these depths either concurrently with the price bottom or just before a sustained recovery began.
The Channel’s Upper End in Sight
If historical patterns hold true, the initial price target would be the upper resistance line of the ascending channel. Reports suggest that each time XRP has tested the channel’s lower support, it has eventually trended towards the upper boundary.
Leave a Reply