Author: Admin_Up

  • ‏جمینی گوگل: پیش‌بینی جهش بیت‌کوین در ۹۰ روز آینده

    ‏جمینی گوگل: پیش‌بینی جهش بیت‌کوین در ۹۰ روز آینده

    ‏گوگل جمنای هوش مصنوعی، پنجره پیش‌بینی قیمت بیت‌کوین را به سه ماهه آینده محدود کرده و این دوره را به جای پایان سال، آزمون واقعی می‌داند. این مدل، هدف ۹۰ روزه را بین ۷۸ تا ۸۲ هزار دلار پیش‌بینی می‌کند که جهشی قابل توجه نسبت به قیمت فعلی است.

    سناریوی صعودی

    تحقق این پیش‌بینی صعودی، به بازگشت سرمایه به سمت بیت‌کوین پس از جذب شدن توسط دارایی‌های جذاب دیگر بستگی دارد. در حال حاضر، بیت‌کوین در حدود ۵۹,۵۰۰ دلار معامله می‌شود و این فرضیه بر چرخش تهاجمی سرمایه به سمت دارایی‌های دیجیتال پس از فروکش کردن هیجان اولیه ناشی از عرضه‌های اولیه بزرگ در سه ماهه دوم، از جمله شرکت‌هایی مانند SpaceX، متمرکز است.

    با کمرنگ شدن این هیجان، سرمایه‌گذاران نهادی که به دنبال بهره‌برداری از انحرافات کلان اقتصادی هستند، می‌توانند سرمایه تازه را مستقیماً به سمت بیت‌کوین هدایت کنند.

    این مدل، سطح ۵۹,۵۰۰ دلار را به عنوان یک حمایت روانی حیاتی معرفی می‌کند؛ سطحی که پیش از این، خروج سنگین موقعیت‌های خرید بیش از حد اهرم‌دار را جذب کرده است.

    با تکمیل شدن این تخلیه، تثبیت نوسانات در بازار اختیار معامله همراه با افزایش مجدد جریان سرمایه نهادی به صندوق‌های قابل معامله در بورس (ETF) اسپات، می‌تواند به راحتی باعث ایجاد فشار خرید (short squeeze) شود. این مدل استدلال می‌کند که چنین فشاری دقیقاً می‌تواند قیمت را در سه ماه آینده به سمت محدوده ۷۸ تا ۸۲ هزار دلار سوق دهد.

    سناریوی نزولی

    سناریوی نزولی بر موانع کلان اقتصادی بنا شده است که هیچ ارتباطی با خود بیت‌کوین ندارد. اگر نقدینگی جهانی به دلیل سیاست‌های انقباضی فدرال رزرو در واکنش به تورم هسته‌ای پایدار، محدود بماند، این نوع انقباض معمولاً به شدت بر دارایی‌های پرریسک مانند بیت‌کوین تأثیر می‌گذارد.

    تأخیرهای بیشتر در تصویب قانون CLARITY در سنای آمریکا، یکی از معدود کاتالیزورهای کوتاه‌مدتی را که سرمایه‌گذاران صعودی به آن دل بسته‌اند، از بین می‌برد. اگر هر دو این فشارها همزمان رخ دهند، شکست پایدار زیر سطح حمایتی حیاتی ۵۸,۰۰۰ دلار می‌تواند منجر به یک اصلاح فنی عمیق‌تر شود و به طور بالقوه بیت‌کوین را تا سطح حمایتی کلان ۴۸,۰۰۰ دلار پایین بکشد.

    نمودار روزانه نشان می‌دهد که بیت‌کوین در حال حاضر در قیمت ۵۹,۳۶۵ دلار قرار دارد و از اوج‌های نزدیک به ۱۲۷,۰۰۰ دلار که در اکتبر گذشته ثبت شده بود، کاهش یافته است. این روند نزولی، شیب‌دار و پایدار بوده و یک رالی کوتاه‌مدت تسکینی در ماه مه که تا نزدیکی ۸۳,۰۰۰ دلار اوج گرفت، پیش از بازگشت مجدد به روند فعلی ضعف، رخ داد.

    قیمت در چند جلسه اخیر در حال تلاش برای عبور از ۶۰,۰۰۰ دلار بوده و دقیقاً در سطح روانی قرار گرفته است که پیش‌بینی، آن را به عنوان حمایت حیاتی معرفی می‌کند.

    این نوع تثبیت فشرده درست در یک عدد گرد کلیدی، اغلب نشان‌دهنده نبرد واقعی بین خریدارانی است که از سطح دفاع می‌کنند و فروشندگانی که در حال آزمایش شکست آن هستند.

    مقاومت فوری در نزدیکی ۶۴,۰۰۰ دلار قرار دارد؛ سطحی که قیمت در طول این دوره اخیر بارها از آن رد شده است. سقف سنگین‌تری در نزدیکی ۷۲,۰۰۰ دلار وجود دارد که رالی ماه مه در نهایت در آنجا متوقف شد.

    حمایت در ۵۸,۰۰۰ دلار قرار دارد؛ آستانه‌ای که در سناریوی نزولی به عنوان خطی که در را به سوی زیان‌های عمیق‌تر باز می‌کند، مشخص شده است. الگوی گسترده‌تر از اکتبر، شامل سقف‌های پایین‌تر و کف‌های پایین‌تر است؛ یک روند نزولی واضح که هنوز هیچ نشانه واقعی از معکوس شدن نشان نداده است.

    شتاب در کندل‌های روزانه ضعیف به نظر می‌رسد و همچنان به سمت نزولی متمایل است، با کندل‌های قرمز که در جلسات اخیر غالب هستند و پاسخ خرید محدودی در رالی‌ها دیده می‌شود.

    با توجه به دقت قیمت در آزمایش سطح حمایتی دقیقی که در این پیش‌بینی نام برده شده است، حرکت بعدی از ۵۸,۰۰۰ تا ۵۹,۵۰۰ دلار به نظر می‌رسد که کدام یک از این دو سناریو در هفته‌های آینده واقعاً رخ خواهد داد را تعیین کند.

    چرخش سرمایه در حال حاضر در حال وقوع است. اکثر مردم آن را تنها در نگاه به گذشته خواهند دید.

    دارایی‌های بزرگ در بازار ارزهای دیجیتال شکست نمی‌خورند، بلکه سقف دارند. بیت‌کوین، اتریوم و XRP هفته‌هاست که در برابر باندهای مقاومتی یکسان فشار می‌آورند. بادهای موافق کلان همچنان به تعویق می‌افتند.

    جریان سرمایه نهادی به سه ماهه آینده موکول می‌شود. نگهداری دارایی‌هایی که سود آنها به کاتالیزورهایی بستگی دارد که نمی‌توانید کنترل کنید، استراتژی نیست؛ بلکه انتظار کشیدن است.

    سرمایه‌ای که چرخه‌های کافی را پشت سر گذاشته است، در مقاومت منتظر نمی‌ماند؛ بلکه قبل از آشکار شدن مقصد، حرکت می‌کند.

    پروژه‌های زیرساختی در مراحل اولیه، بر اساس ریاضیات متفاوتی عمل می‌کنند. ارزش بازار به اندازه کافی کوچک، به این معنی است که یک چرخش سرمایه ناچیز، منجر به حرکت قیمتی چشمگیر می‌شود. عدم تقارن وجود دارد زیرا بازار آنچه در حال ساخته شدن است را هنوز قیمت‌گذاری نکرده است. این شکاف بین ارزش‌گذاری فعلی و ارزش واقعی پروژه، جایی است که بازده از آنجا حاصل می‌شود.

    تجزیه و تکه شدن چند زنجیره‌ای، روزانه هزینه‌های واقعی را به امور مالی غیرمتمرکز (DeFi) تحمیل می‌کند. بیت‌کوین، اتریوم و سولانا سیستم‌های نقدینگی کاملاً ایزوله را بدون راهی بومی برای اتصال آنها اجرا می‌کنند. هر کاربری که ارزش را بین اکوسیستم‌ها منتقل می‌کند، مستقیماً این هزینه را در قالب کارمزد، لغزش قیمت و تراکنش‌های ناموفق متحمل می‌شود.

    LiquidChain هر سه شبکه را به یک لایه اجرایی واحد فرو می‌ریزد. یک استقرار. دسترسی کامل به اکوسیستم. بدون مالیات بین زنجیره‌ای بر روی هر تعامل.

    بازار هنوز این را پیدا نکرده است. این نکته اصلی است.

    پیش‌فروش با قیمت ۰.۰۱۴۵۴ دلار و بیش از ۸۴۰,۰۰۰ دلار جمع‌آوری شده است. “طبقه همکف” در اینجا یک عبارت بازاریابی نیست؛ بلکه توصیفی از موقعیت واقعی آن در چرخه عمر پروژه است.

    اجرا اثبات نشده است. پذیرش ناشناخته است. این ریسک‌ها واقعی هستند و ارزش نام بردن مستقیم را دارند. دارایی‌های تثبیت شده، مسیری هموارتر به سمت سقفی که از قبل قابل مشاهده است، ارائه می‌دهند. این پروژه، صندلی زودتری را در جدولی که هنوز چیده نشده است، ارائه می‌دهد.

    پیش‌فروش LiquidChain را بررسی کنید.

    گوگل جمنای هوش مصنوعی، قیمت خیره‌کننده بیت‌کوین را برای ۹۰ روز آینده پیش‌بینی کرد. این مقاله اولین بار در Cryptonews منتشر شد.

  • ‏کوین‌اکس؛ دروازه حیاتی اقتصاد رمزارزی ایران

    ‏کوین‌اکس؛ دروازه حیاتی اقتصاد رمزارزی ایران

    ‏بیش از ۳.۸۴ میلیارد دلار تراکنش بلاک‌چین بین صرافی ارز دیجیتال CoinEx و نهادهای تحریم‌شده ایرانی در بازه‌ای بیش از هفت سال ردیابی شده است.

    این یافته‌ها اندکی پس از آن منتشر می‌شود که دفتر کنترل دارایی‌های خارجی وزارت خزانه‌داری آمریکا (OFAC) چهار صرافی ایرانی، شامل Nobitex، BitPin، Wallex و Ramzinex را تحت فرمان‌های اجرایی ۱۳۲۲۴ و ۱۳۹۰۲ تحریم کرد.

    بر اساس آخرین گزارش TRM Labs، این چهار صرافی حدود ۷.۷ میلیارد دلار یا ۷۸ درصد از ۱۰ میلیارد دلار فعالیت تخمینی ارز دیجیتال ایران در سال ۲۰۲۵ را به خود اختصاص داده‌اند. با وجود اقدامات اجرایی مکرر، حجم سالانه ارز دیجیتال ایران همچنان بالا بوده است. CoinEx که در سال ۲۰۱۷ توسط هایپو یانگ تأسیس شد و از طریق نهادهایی در حوزه‌های قضایی مختلف فعالیت می‌کند، بیش از ۷۹ میلیارد دلار حجم معاملات را پردازش کرده است.

    این صرافی همچنین با اقدامات نظارتی در چندین کشور مواجه شده است. یافته‌های TRM نشان می‌دهد که CoinEx بزرگترین طرف خارجی صرافی ارز دیجیتال ایران، Nobitex، است. از اواخر سال ۲۰۱۸، بیش از ۲.۷ میلیارد دلار از طریق حدود ۶.۲ میلیون انتقال بلاک‌چین بین این دو پلتفرم جابجا شده است که به طور متوسط روزانه حدود ۱ میلیون دلار است. Nobitex حدود ۳۶۰ میلیون دلار بیشتر از آنچه دریافت کرده، به CoinEx ارسال کرده است که نشان‌دهنده انتقال مداوم وجوه از ایران به بازارهای بین‌المللی از طریق CoinEx است.

    فعالیت بین این دو صرافی از حدود ۱۳ میلیون دلار در سال ۲۰۲۰ به ۵۷۵ میلیون دلار در سال ۲۰۲۱ افزایش یافت. پس از کاهش در سال‌های ۲۰۲۲ و ۲۰۲۳، حجم معاملات در سال ۲۰۲۴ به ۷۱۴ میلیون دلار و در سال ۲۰۲۵ به ۷۶۳ میلیون دلار بازگشت. در واقع، CoinEx بیش از ۱۶ درصد از فعالیت تراکنشی سالانه Nobitex را به خود اختصاص داده است.

    TRM همچنین ارتباطات مستقیمی بین CoinEx و بیش از ۶۰ کسب‌وکار ارز دیجیتال ایرانی، از جمله Wallex، Ramzinex، BitPin، Aban Tether، Excoino، Bit24، Ompfinex، Sarmayex و Exir شناسایی کرده است. این گزارش حاکی از آن است که سهم مشابهی از حجم تراکنش‌ها از طریق CoinEx در چندین صرافی ایرانی هدایت شده است، همراه با ورود تدریجی پلتفرم‌ها در طول چندین سال، که نشان‌دهنده یک رابطه سازمان‌یافته است تا رفتار مستقل بازار.

    این شرکت اطلاعات بلاک‌چین همچنین دریافت که حدود ۶۷ میلیون دلار که منشأ آن بانک مرکزی ایران بوده، از طریق یک ساختار پیچیده پولشویی بین ژوئن ۲۰۲۵ و ژوئن ۲۰۲۶ به CoinEx رسیده است. گزارش شده است که وجوه از طریق چندین بلاک‌چین، پل‌های بین‌زنجیره‌ای، قراردادهای Gnosis Safe و توکن‌های Aave منتقل شده‌اند تا در نهایت به CoinEx برسند. همچنین ادعا شده است که این صرافی هزینه‌های تراکنش را که به پشتیبانی از این انتقالات کمک کرده، فراهم کرده است.

    ViaBTC، یک استخر استخراج که توسط شرکت مادر CoinEx اداره می‌شود، نیز ارتباط نزدیکی با ایران داشته است. TRM بیش از ۱۵۴ میلیون دلار بین ViaBTC و کیف پول‌های مرتبط با Nobitex ردیابی کرده است و بیشتر انتقالات از استخر استخراج به کیف پول‌های ایرانی جریان داشته است. پس از حمله سایبری سال ۲۰۲۵ به Nobitex، کیف پول‌های استخراج که قبلاً غیرفعال بودند، حدود ۲.۷ میلیون دلار به یک کیف پول جدید Nobitex منتقل کردند. ViaBTC نیز در زنجیره تراکنش‌ها ظاهر شد که نشان‌دهنده استفاده از ذخایر استخراج برای بازیابی نقدینگی است.

    همچنین TRM قرار گرفتن CoinEx در معرض کیف پول‌های مرتبط با سپاه پاسداران انقلاب اسلامی، جهاد اسلامی فلسطین، حزب‌الله، Garantex، Bitzlato، هک CoinEx، باج‌افزار BlackSuit و سرویس اختلاط Wasabi را کشف کرد. الگوهای تراکنش پس از تشدید درگیری بین آمریکا، ایران و اسرائیل در اوایل سال ۲۰۲۶ تغییر کرد. میانگین اندازه انتقالات به شدت افزایش یافت و تراکنش‌های بزرگتر رایج‌تر شدند.

    پس از تحریم چندین صرافی ایرانی توسط OFAC در اوایل ماه جاری، حجم تراکنش‌ها بین CoinEx و نهادهای ایرانی به طور قابل توجهی کاهش یافت، اگرچه این شرکت خاطرنشان کرد که حساب‌های صرافی خصوصی همچنان می‌توانند فعالیت را خارج از دید عموم بلاک‌چین ادامه دهند.

    در همین حال، CoinEx هرگونه رابطه با دولت ایران یا نهادهای تحریم‌شده را رد کرد و گفت که هرگز به آنها کمک مالی یا حمایتی ارائه نکرده است. این صرافی همچنین تأکید کرد که تراکنش‌های بلاک‌چین، دخالت در فعالیت‌های غیرقانونی را اثبات نمی‌کنند.

  • Q2 2026: Crypto Hacks Hit Record High

    Q2 2026: Crypto Hacks Hit Record High

    Q2 2026 Sees Record High in Crypto Hacks, Losses Mount

    Decentralized finance (DeFi) platforms have been hit by 121 hacks this year, resulting in approximately $942 million in losses, according to a report released this week by crypto market tracker CryptoRank.

    The second quarter of 2026 proved to be the most volatile period on record for the crypto sector, with 85 incidents and an estimated $775 million stolen. This surge in attacks coincides with a broader struggle in the cryptocurrency market, marked by declining investor confidence. The total value locked (TVL) in DeFi protocols has seen a consistent monthly decrease throughout the year, falling from around $115 billion in January to $70 billion by late June.

    CryptoRank’s data indicates that the 85 incidents in Q2 2026 represent a significant increase, exceeding the second-highest frequency of exploits—which occurred in Q1 2026—by 49. However, the total dollar value of losses in the second quarter did not reach previous peaks. The data provider noted that two major attacks in April accounted for the majority of the quarter’s losses.

    Major Heists Fuel Q2 Losses

    Drift Protocol and KelpDAO collectively lost $590 million, a sum that represents more than half of all DeFi losses recorded in 2026. Drift Protocol reported that attackers made off with approximately $285 million in user assets. Investigations by blockchain intelligence firm TRM Labs have linked this operation to hacking groups with ties to North Korea.

    According to TRM, the preparatory stages of the attack began on-chain as early as March 11 with a 10 ETH withdrawal from Tornado Cash. This transaction followed months of in-person meetings between proxies of the Pyongyang regime and Drift employees. TRM Labs stated in a report published April 30 that “the attacker used social engineering to induce Drift Security Council multisig signers into pre-signing transactions that appeared routine but carried hidden authorizations for critical admin actions.”

    Just over two weeks later, North Korea’s Lazarus Group targeted KelpDAO, a liquid restaking protocol, exploiting its LayerZero bridge infrastructure and stealing roughly $290 million worth of rsETH. Chainalysis reported at the time that the attackers forged a cross-chain message on April 18 after compromising two remote procedure call nodes utilized by LayerZero’s Decentralized Verifier Network. Concurrently, the criminals launched a distributed denial-of-service attack on a third node, manipulating the system to rely on compromised verifiers. This compromised verification process allowed for the creation of rsETH tokens on Ethereum without the corresponding assets being burned on Unichain.

    Broader Market Impact and Shifting Landscape

    In the immediate aftermath of these attacks, the lending protocol Aave experienced a sharp decline in its TVL, dropping from $26.4 billion to $14.3 billion, with $12 billion in funds withdrawn, representing a decrease of approximately 46%.

    This significant dip in Aave’s TVL was not an isolated incident. CryptoRank’s data confirms that the value locked across all of DeFi declined every month in 2026, falling from $115.3 billion in January to just over $70 billion in June. While hacks were not the sole driver of this decline, the firm suggested that the increased frequency of such incidents likely eroded user confidence, leading to a broader shift away from the sector.

    However, the current downturn is less severe than the one experienced during the 2021-2022 cycle, when DeFi TVL plummeted by more than 70% in seven months. CryptoQuant notes that the current decline has been more gradual, and the market structure has evolved. The stablecoin supply has grown to approximately $300 billion, real-world asset tokenization is expanding, and capital is now more dispersed across various sectors, including derivatives, infrastructure, and lending, rather than being concentrated in a few automated market makers (AMMs) and yield farms.

    Among the largest ecosystems by TVL, only Tron and Hyperliquid have shown growth this year, with Tron gaining 5% and Hyperliquid adding nearly 7%, solidifying its position as a dominant venue for on-chain perpetuals. The remaining top 10 chains have experienced significant declines, with Plasma and Arbitrum being the hardest hit, seeing their TVL plunge by 74.6% and 55%, respectively.

  • ETH RSI Divergence Signals Potential Bottom

    ETH RSI Divergence Signals Potential Bottom

    Ethereum Faces Selling Pressure, But Signs of Weakening Bearish Momentum Emerge

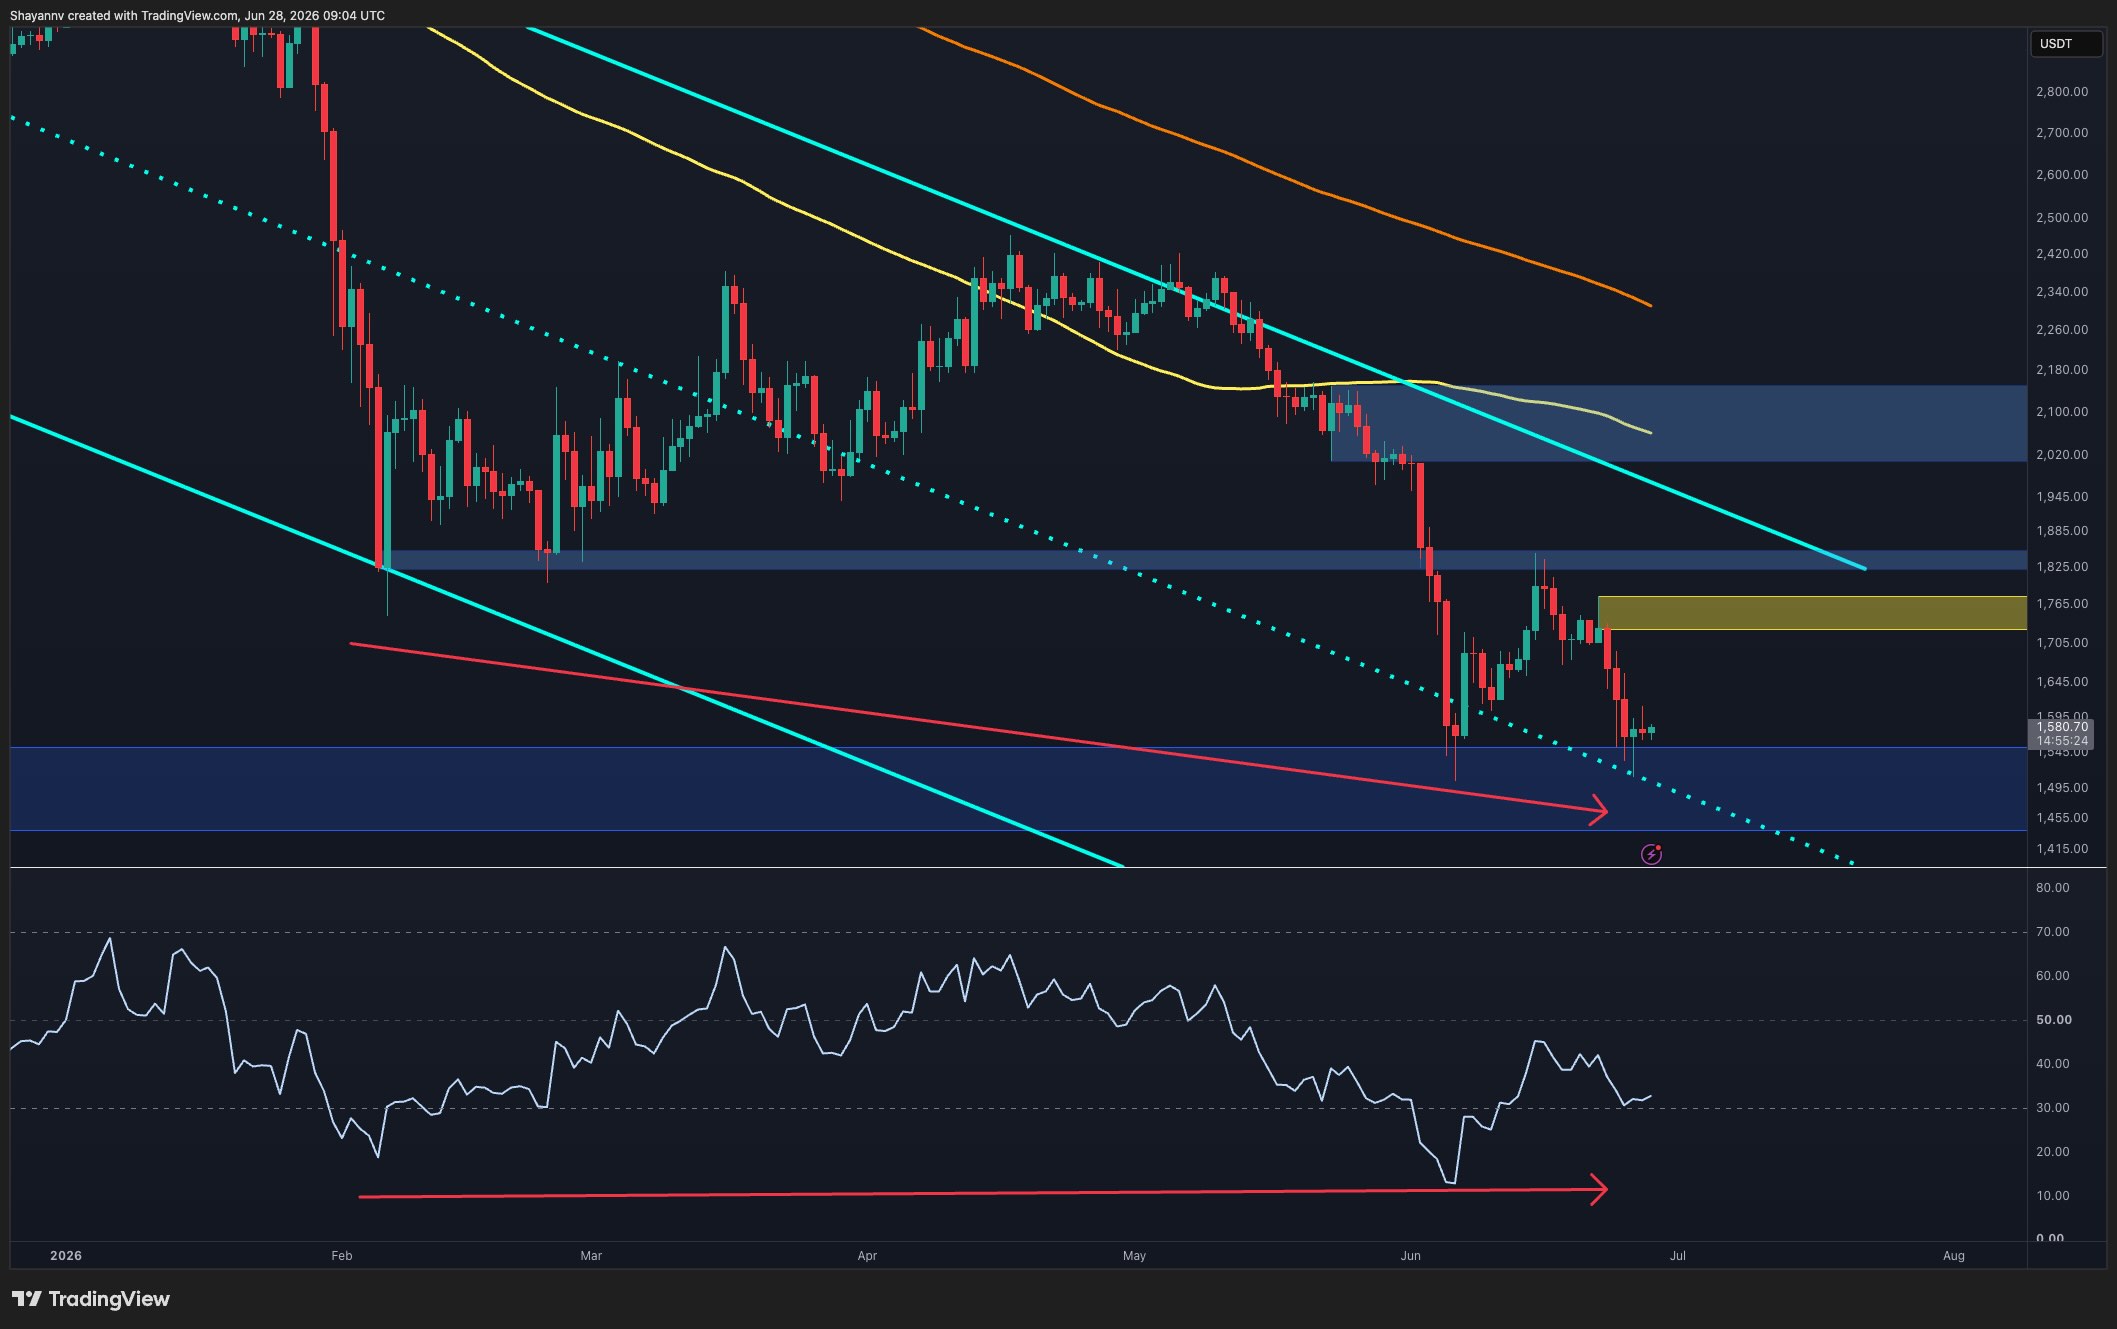
    Ethereum continues to grapple with downward pressure on higher timeframes, though recent price action suggests that bearish momentum may be losing steam. While the overarching trend remains decidedly negative, current movements indicate that sellers could be nearing exhaustion after weeks of consistent declines.

    Demand Zone Holds Firm

    Ethereum’s recent retreat from the $1.72K-$1.78K supply zone initiated another downward move, pushing the cryptocurrency back into the critical $1.46K-$1.53K demand region. This area has repeatedly served as support throughout June and continues to attract buyers whenever the price approaches it.

    Bullish Divergence on Daily Chart

    A significant development on the daily timeframe is the emergence of bullish divergence on the Relative Strength Index (RSI). While Ethereum has consistently made lower lows during June, the RSI has been forming higher lows near oversold territory. This divergence signals a weakening of downside momentum, even as ETH hovers near cycle lows.

    Although a bullish divergence alone does not guarantee a reversal, it often appears in the later stages of bearish trends and can serve as an early indicator that sellers are losing control. As long as ETH maintains its position above the $1.46K-$1.53K support area, the divergence remains valid, increasing the likelihood of a relief rally.

    Confirmation of a potential reversal would necessitate a break above key resistance zones, particularly the $1.72K-$1.78K supply area. Until then, the broader trend remains bearish, despite the improving momentum indicators.

    Consolidation and Trendline Resistance

    On the 4-hour timeframe, Ethereum has spent recent sessions consolidating above the lower demand zone following a sharp sell-off from resistance. A descending trendline has capped every recovery attempt since the rejection on June 22. However, the asset is now compressing directly beneath this trendline, with contracting volatility. This setup presents the possibility of a short-term breakout if buyers can overcome the trendline resistance.

    A successful breakout could target the $1.72K-$1.78K supply zone, which was the origin of the latest decline. Such a move would align with the bullish RSI divergence observed on the daily chart and could signal the first meaningful recovery rally in several weeks.

    On the downside, the $1.52K area remains a critical level to monitor. A loss of this support would invalidate the short-term bullish outlook and shift focus back toward further downside continuation within the broader downtrend. For now, Ethereum appears caught between support and descending resistance, with the next directional move likely determined by which side breaks first.

    Liquidity Heatmap Reveals Potential Upside Sweep

    The liquidation heatmap indicates an interesting shift in liquidity positioning. While liquidity remains concentrated above the current price, particularly between approximately $1.68K and $1.80K, Ethereum is currently trading below these significant clusters. Markets often gravitate toward areas with substantial leveraged positions, making these overhead liquidity pools attractive short-term targets.

    This scenario suggests that ETH could stage an upside liquidity sweep before any larger directional move develops. A breakout above the 4-hour descending trendline would increase the probability of price moving into these overhead liquidity pockets, triggering short liquidations and fueling a squeeze toward the $1.7K-$1.8K region.

    Simultaneously, the heatmap also shows notable liquidity beneath the market around the lower support region, indicating that both sides of the current range remain vulnerable to liquidation-driven volatility.

    Combined with the bullish daily RSI divergence and the compression beneath the 4-hour trendline resistance, the current setup suggests Ethereum may first attempt an upside liquidity grab before the market determines whether a more sustainable recovery can materialize. The reaction around the $1.72K-$1.80K liquidity cluster will likely offer crucial insights into Ethereum’s next major trend.

  • XRP Plunge Expected: Will Ripple Shock the Market?

    XRP Plunge Expected: Will Ripple Shock the Market?

    XRP Faces Steep Declines, But History Suggests a Potential Rebound

    The cryptocurrency XRP has endured a challenging period in recent months. Following a peak in mid-July 2025, the asset has seen a significant downturn, shedding over 70% of its value and falling towards the $1.00 mark. It has also been overtaken by BNB and USDC in market capitalization and experienced a six-month losing streak.

    Bearish Outlook Amidst Declines

    This adverse performance has led some analysts to adopt a bearish stance on XRP. While many believe the asset is at a critical juncture in the current cycle, figures like Ali Martinez have warned of potential drops to support levels at $0.80, $0.62, or even $0.51 if the $1.00 threshold fails to hold.

    Data from Glassnode indicates that XRP holders are realizing more losses than profits, suggesting sustained selling pressure even from investors currently at a deficit. Artificial intelligence platform ChatGPT has also issued cautionary predictions should XRP lose the $1.00 level, flipping it from support to resistance. However, such widespread pessimism could paradoxically set the stage for a recovery.

    Historical Precedents for Market Turns

    Market history often shows that extreme consensus, particularly widespread pessimism, can precede significant reversals. As investor Warren Buffett famously advised, “Be fearful when others are greedy, and be greedy when others are fearful.”

    Periods of extreme pessimism have frequently coincided with crucial turning points in the cryptocurrency market. Bitcoin (BTC), Ethereum (ETH), and XRP have all experienced phases where sentiment plummeted before major recoveries began. This pattern often occurs as less committed investors exit the market, allowing long-term holders to accumulate assets at lower prices.

    Signs of Accumulation and Oversold Conditions

    For XRP, evidence of such accumulation appears to be emerging from exchange-traded fund (ETF) investors. Funds tracking XRP’s performance have recorded eight consecutive weeks of inflows, a stark contrast to the significant outflows experienced by BTC and ETH ETFs.

    The recent sell-off has also pushed several on-chain and technical indicators into historically oversold territory. Some analysts suggest that XRP may be approaching a zone where the risk-reward profile becomes more favorable, despite the potential for continued short-term volatility.

    History offers a compelling parallel for XRP. In mid-June, the asset’s sentiment had similarly plunged, only to surge by double digits within 24 hours. Analytics firm Santiment attributed that rally to deteriorating investor behavior.

    June’s Weakness and July’s Potential

    Current data indicates XRP is on track to finish June with a decline exceeding 20%, marking its worst monthly performance since February 2025. CryptoRank data suggests this aligns with historical trends, as June has historically been a predominantly bearish month for XRP.

    In contrast, July has historically been a strong month for XRP. The asset has closed each of the past six Julys in positive territory, often with significant gains. Five of those six months saw double-digit price increases, including substantial rallies of over 45% in 2020 and 2023. The median gain for July stands at nearly 11%.

  • California’s DFAL Deadline Looms: XRP Fate Uncertain

    California’s DFAL Deadline Looms: XRP Fate Uncertain

    California’s Digital Financial Assets Law Looms, Impacting Ripple and XRP

    California’s Digital Financial Assets Law (DFAL) is set to take effect on July 1, mandating that any firm conducting digital asset business with state residents must obtain a DFAL license or have a pending application with the Department of Financial Protection and Innovation (DFPI). Failure to comply will require cessation of such operations. Public records currently show no Ripple entities among the applicants, a development that coincides with XRP’s price falling below the $1.10 mark amid this regulatory uncertainty.

    The DFAL encompasses a broad range of digital asset activities, including exchanges for fiat or other digital assets, transfers between individuals, custody services, and the issuance of reserve-backed instruments. These provisions directly align with Ripple’s existing operations in California, which include its payments infrastructure, custody services, and the issuance and redemption of RLUSD, its dollar-pegged stablecoin.

    Regulatory Landscape and Ripple’s Position

    Ripple’s existing portfolio of over 40 U.S. money transmitter licenses does not automatically satisfy the DFAL requirements. The new law establishes a distinct regulatory framework managed by the DFPI through the Nationwide Multistate Licensing System.

    By the July 1 deadline, companies have three avenues for legal compliance: securing a DFAL license, submitting a complete application to the DFPI, or qualifying for a limited statutory exemption. This exemption is primarily available to banks, certain trust companies, and entities already registered with the SEC or CFTC that operate within their existing regulated activities.

    Ripple has engaged with the DFPI, submitting a formal comment letter advocating for the elimination of redundant money transmitter license requirements for DFAL-licensed firms. However, this engagement does not equate to a filed license application. Law firms, including those recognized by Chambers, have characterized the DFAL as one of the most comprehensive state-level digital asset licensing regimes in the United States.

    XRP Price Dynamics Amidst Regulatory Scrutiny

    XRP is currently trading near $1.10, a significant drop from the $2.50 price point many had anticipated. Recent price action indicates weak momentum, with sellers consistently capping rallies in the $1.15 to $1.20 range. Despite ongoing attention on Ripple’s regulatory developments, the market has not yet factored in a decisively positive outcome.

    Investors remain keenly focused on several legal and regulatory milestones involving Ripple. While a previous court finding that XRP itself is not inherently a security removed a major source of uncertainty, the outstanding penalty and injunction issues remain significant as they could influence Ripple’s future business operations and market sentiment.

    From a technical standpoint, XRP must first reclaim the $1.15 to $1.20 zone before a stronger trend reversal can be discussed. Should buyers regain control and regulatory developments continue to be favorable, the next resistance level could emerge between $1.30 and $1.50. A sustained move above these levels would likely necessitate a substantial catalyst.

    On the downside, support is currently clustered around $1.05 and $1.00. A weakening of regulatory expectations or a downturn in the broader cryptocurrency markets could place pressure on these levels. The $1.00 mark represents an important psychological threshold, as a decisive breach could trigger further selling.

    For the time being, the market appears to be awaiting confirmation rather than trading on speculation. While regulatory progress could improve sentiment, XRP’s longer-term trajectory will likely be shaped by both legal clarity and a resurgence of stronger market demand.

  • Bitcoin Holds Steady at $60K Amid US-Iran Tensions

    Bitcoin Holds Steady at $60K Amid US-Iran Tensions

    Bitcoin Holds Steady Around $60,000 Amid Geopolitical Tensions

    Bitcoin’s price maintained a relatively stable position around the $60,000 mark over the weekend, weathering new escalations in the Middle East and a broken ceasefire.

    Most altcoins experienced minor losses on a 24-hour basis, with ZEC seeing the steepest decline among larger-cap cryptocurrencies. AAVE also slipped below $90 following a significant correction.

    The primary cryptocurrency began the business week with a strong surge to $65,500, having reclaimed the $64,000 support level over the weekend. However, this upward momentum proved short-lived, leading to a challenging few days. Initially, sellers pushed the price below $62,400, followed by two further declines that brought Bitcoin to multi-year lows.

    On Wednesday, the cryptocurrency plummeted to $59,000 as concerns surrounding Strategy intensified. After a brief rebound to $62,000 on Thursday, often referred to as a “dead-cat bounce,” Bitcoin experienced another substantial drop, plunging to $58,000 – its lowest point since late 2024.

    At this juncture, bulls finally intervened, preventing a further breakdown. Bitcoin subsequently rebounded by a couple of thousand dollars and has largely hovered around $60,000 for the past 36 hours.

    This period of calm is particularly noteworthy given the recent developments in the Middle East, where the United States and Iran have engaged in retaliatory actions and accused each other of violating the ceasefire.

    Bitcoin’s market capitalization currently exceeds $1.2 trillion, according to CoinGecko, with its dominance over altcoins nearing 56% once again.

    While most altcoins are trading in negative territory today, their declines are relatively minor compared to the volatility seen throughout the week. Ethereum remains just below $1,600, XRP is trading at $1.05, SOL is above $70, and HYPE is at $63. BNB has seen a slightly larger drop, while DOGE is down by over 2.3%.

    ZEC has suffered the most significant losses among larger-cap altcoins today, struggling at $385. AAVE has lost much of its recent gains, falling back below $90. M continues to set new lows, with an additional 13% decline pushing it to $0.68. In contrast, VELVET has surged by 30%, entering the top 100 altcoins by market capitalization, and PUMP has followed suit with a 15% increase.

    The total cryptocurrency market capitalization has decreased by approximately $20 billion daily, now standing below $2.160 trillion, according to CoinGecko.

  • XRP’s July Plunge Risk: ChatGPT Warns of Sub-$1 Drop

    XRP’s July Plunge Risk: ChatGPT Warns of Sub-$1 Drop

    Bears Tighten Grip as XRP Nears Psychological $1.00 Mark

    The cryptocurrency market, once a beacon of optimism, now appears firmly in the grip of bearish sentiment, with the psychological $1.00 level for XRP coming into sharp focus. What seemed improbable just months ago, or even weeks, has become a distinct possibility in the current landscape.

    Just eleven months ago, XRP commanded a price of $3.65. Even subsequent corrections that pushed it below $3.00 and then $2.00 felt significant at the time. However, a sustained breakdown below the $1.00 threshold was largely considered unthinkable. Now, with Bitcoin struggling to maintain its $60,000 support, such a scenario for XRP is highly anticipated.

    On Thursday, as the broader market experienced a significant downturn, XRP plummeted to $1.01. This raises a critical question: how low could the token fall if this crucial support level falters? To explore this, we turned to ChatGPT for its insights.

    The popular AI model cautioned that a clean break below $1.00, particularly by the end of June or in July, might not see the price stabilize at $0.99. Instead, a decisive daily close beneath this round-numbered support could transform it into a resistance level. In such a scenario, the initial downside target is projected to be between $0.96 and $0.94. While this could signal the “first wave of damage,” it may not necessarily mark the ultimate bottom.

    The true danger, according to ChatGPT’s analysis, emerges if XRP loses the $0.94 level. This would reportedly open a clear path for the asset to descend towards $0.90. Should panic accelerate, further downside targets are identified at $0.87, $0.82, and $0.78, levels that align with projections from several prominent analysts regarding XRP’s potential floor.

    In a worst-case scenario for XRP in July, ChatGPT predicted a potential crash to $0.65. The AI explained that this level is significant because it lies sufficiently below immediate support to shake out late buyers, liquidate leveraged long positions, and fundamentally reset market sentiment. Such a drop would represent a 35% decline from $1.00 and a nearly 40% fall from the current approximate price of $1.05.

    However, OpenAI’s solution also outlined an alternative scenario. If XRP bulls manage to defend the $1.00 support and the overall market environment improves or at least ceases to deteriorate, Ripple’s token could see a recovery. To achieve this, XRP would need to reclaim key resistance levels at $1.08 and $1.10. A sustained move beyond $1.10 would invalidate the bearish thesis of a plunge below $1.00.

    Nevertheless, until XRP decisively breaks above $1.10 and maintains that position, any upward movements are likely to be viewed with skepticism. Instead of signaling a genuine recovery, these bounces may be perceived as opportunities for sellers to re-enter the market and push the price back below the critical $1.00 territory.

  • Assets Plummet: Where’s the Capital Flowing?

    Assets Plummet: Where’s the Capital Flowing?

    Bitcoin’s Downturn Continues, Investors Shift Billions from Crypto and Gold to Semiconductors

    Bitcoin has experienced a significant decline since the beginning of the year, falling below the $60,000 mark for the first time since late 2024. The largest funds tracking its performance have collectively shed over $8 billion in recent weeks.

    Gold, which started the year with a positive surge to a new all-time high, has also seen its trajectory reverse and is now trading in negative territory. This raises the question of where investors are reallocating their capital.

    ETF Outflows and Inflows

    The exodus from Bitcoin Exchange Traded Funds (ETFs) began in November, following a substantial market correction in October. Investors withdrew $3.5 billion in November, with billions more pulled out in December and January. The trend showed a brief recovery in March and April, with net inflows of $1.32 billion and $1.97 billion, respectively.

    However, May marked a renewed downturn, with $2.43 billion withdrawn. June is currently on pace to set a record for the highest net outflows, with over $4 billion already withdrawn. The cumulative net inflows for Bitcoin ETFs have decreased from a peak of $61.19 billion in October to $51.61 billion as of last week, representing a reduction of nearly $10 billion. In the past seven weeks alone, these funds have seen approximately $8 billion in outflows.

    The performance of gold ETFs mirrors this trend. While these funds initially attracted significant capital at the start of the year, coinciding with gold’s record high, recent data indicates a shift. According to The Kobeissi Letter, ETFs tracking both Bitcoin and gold have experienced a combined $12 billion in cumulative outflows since April.

    “The largest US gold-backed ETF, $GLD, is down -13% since the start of April, while the largest Bitcoin ETF, $IBIT, is down -12%,” the analysis noted.

    A Broader Market Perspective

    This pattern of withdrawals is not universal across all investment assets. Data from the same analysts reveals that US-listed ETFs, in general, have attracted over $1 trillion in net inflows in 2026, positioning them to set a new annual record.

    The significant capital leaving Bitcoin and gold appears to be flowing into US semiconductor ETFs. The Kobeissi Letter reported that these semiconductor-focused ETFs have attracted $20 billion in cumulative inflows within the same timeframe that gold and Bitcoin funds lost $12 billion. This trend reportedly accelerated in mid-May and has continued into June.

    Analysts concluded that semiconductor ETFs, such as $SOXX and $SMH, have seen substantial gains of 81% and 60%, respectively, over the period during which $GLD and $IBIT have declined by 13% and 12%. This suggests a rotation by retail investors out of gold and Bitcoin and into semiconductor stocks.

    The data highlights a clear divergence:

    • Since April, US gold and Bitcoin ETFs have recorded cumulative outflows totaling -$12 billion.
    • Concurrently, US semiconductor ETFs have attracted cumulative inflows of +$20 billion.
  • XRP, HYPE Lead ETF Race as SOL Joins BTC, ETH

    XRP, HYPE Lead ETF Race as SOL Joins BTC, ETH

    ETF Investors Favor Smaller Cryptocurrencies Over Bitcoin and Ethereum

    Investor sentiment towards cryptocurrency exchange-traded funds (ETFs) continues to show a stark divergence, with funds tracking smaller digital assets outperforming those focused on the market leaders. Last week saw record outflows from Bitcoin ETFs, while funds dedicated to HYPE and XRP maintained their positive momentum. Solana (SOL) ETFs, however, reversed their previous week’s gains, turning negative.

    CryptoPotato previously reported that spot ETFs tracking HYPE, XRP, and SOL had bucked the trend set by Bitcoin and Ethereum, attracting significant capital. This trend persisted for two of those assets over the past week, with HYPE funds experiencing a particularly strong Thursday.

    Data from SoSoValue indicates that Thursday was a standout day for HYPE ETFs, with net inflows exceeding $108 million, marking the funds’ best single-day performance by a considerable margin. Modest inflows of $1.46 million on Tuesday and $1.82 million on Friday brought the weekly total to $111.36 million in net inflows. This figure also set a new record for the largest weekly inflows, surpassing the previous high of $72.38 million recorded during the funds’ second week of operation.

    Spot XRP ETFs also concluded the week on a strong note, though not reaching the scale of HYPE’s Thursday surge. These funds attracted $15.63 million on Friday, building on $5.31 million on Monday and $2.05 million on Wednesday. With zero net inflows on Tuesday and Thursday, the week closed with $23 million in net inflows for XRP ETFs, their strongest performance in six weeks.

    The cumulative net flows for these ETFs have now reached an all-time high of $1.47 billion. Furthermore, both XRP and HYPE ETFs have maintained an unbroken streak of positive weekly inflows for eight and seven consecutive weeks, respectively.

    While HYPE and XRP products have sustained their impressive performance, SOL ETFs have seen a reversal, experiencing a net outflow of $3.8 million. This places Solana ETFs in the same category as Bitcoin and Ethereum, which have also seen outflows.

    Spot Bitcoin ETFs experienced another substantial withdrawal last week, with nearly $1.8 billion exiting the funds. This marks their second-worst weekly performance in their 2.5-year history. Ethereum ETFs also ended the week in negative territory, with more than $273 million withdrawn.