Author: Admin_Up

  • XRP ETFs See Inflows Amid Market Slump

    XRP ETFs See Inflows Amid Market Slump

    XRP-linked exchange-traded funds continue to attract investor interest despite a broader downturn in the cryptocurrency market.

    ETF Inflows

    Recent data indicates that clients of XRP ETFs purchased $1.77 million worth of XRP yesterday, bringing the total net assets to approximately $1.12 billion.

    This fresh inflow of capital into XRP comes as Bitcoin and Ethereum products experience renewed outflows. Investors appear to be reducing their exposure to riskier assets amid the market-wide decline. Data from SoSoValue shows that US spot Bitcoin ETFs recorded $228 million in outflows, while Ethereum products lost $121 million.

    In this context, XRP’s $1.77 million inflow, while seemingly modest in size, could be considered significant in terms of its direction. It suggests that some ETF investors are continuing to accumulate exposure to Ripple’s native cryptocurrency, even as capital exits Bitcoin and Ethereum products.

    Price Performance

    However, the inflow has not been sufficient to reverse XRP’s weakening price action, although some positive signs are emerging.

    XRP is showing a modest rebound today, trading approximately 2% higher. Nevertheless, this move has not fully erased the recent bearish pressure.

    As previously reported by CryptoPotato, XRP recently fell to its lowest levels since March, with $1.20 identified as the next major support zone.

    Technical pressure has also been intense over the past week. XRP fell below its 100-day moving average, currently acting as significant resistance at $1.4, while the 200-day moving average remains higher, around $1.6.

    A breakdown below $1.2 could potentially lead to a more substantial decline, possibly towards the $0.60 zone.

    The contrast is clear: ETF demand remains positive, but price momentum is still bearish. Reclaiming the 100-day EMA at $1.4 would be the first step towards stabilizing XRP’s price action.

  • Shiba Inu Traders Pull Out 204 Billion SHIB as Futures Activity Plummets

    Shiba Inu Traders Pull Out 204 Billion SHIB as Futures Activity Plummets

    Traders Withdraw Billions of SHIB Tokens from Exchanges Amidst Futures Market Decline

    Traders withdrew over 204 billion SHIB tokens from cryptocurrency exchanges in a single day, representing a 3.6% increase compared to the previous day, even as demand for Shiba Inu futures contracts declined significantly.

    Futures Market Outflows

    Data from Coinglass indicates that futures outflows reached $5.6 million over the past 24 hours, exceeding inflows of $4.74 million. The net difference, approximately $865,790 in closed contracts, effectively removed 156.56 billion SHIB tokens from the futures market within a single session. Open interest, which measures the total value of active futures positions, decreased by 6% to over $49 million during the same period. Furthermore, the 24-hour futures trading volume also fell by 0.88% to $78.6 million, reflecting reduced activity in the derivatives market.

    The decrease in futures demand aligns with SHIB’s price performance over the past four days, during which the token has shown minimal price movement. The coin has not fluctuated more than 2% in either direction, providing limited incentive for derivative traders to maintain their positions.

    Price Stagnation and Momentum Slowdown

    At the time of writing, SHIB was trading at $0.00000553, showing virtually no change over the past day. Limited price movement often prompts futures traders to shift their focus to other assets, and this rotation appears to be underway. When a token experiences price stagnation, futures traders tend to exit the market. They require volatility to profit from leveraged positions, and SHIB has not provided that.

    Spot Market Activity

    While the derivatives market weakened, spot market activity presented a different picture. Spot trading volume increased by 18% within 24 hours, reaching nearly $12 million, and exchange reserves decreased by 0.25% to 80.32 trillion SHIB. The exchange netflow remained negative, indicating that more tokens were withdrawn from platforms than deposited. This sustained outflow is often interpreted as holders transferring assets to self-custody rather than preparing to sell. Some analysts suggest this pattern may indicate that the recent downward pressure on prices is diminishing.

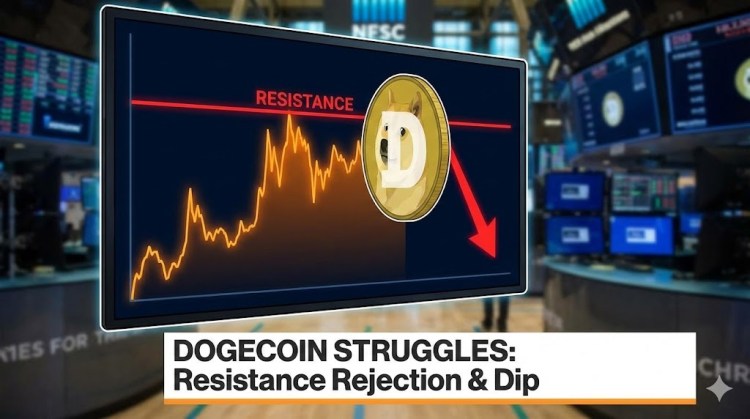
  • Dogecoin Slides as Bears Dominate

    Dogecoin Slides as Bears Dominate

    Dogecoin Price Faces Resistance

    Dogecoin has initiated a recovery, trading above the $0.0980 mark against the US Dollar. However, DOGE is currently encountering resistance near $0.1010 and may struggle to sustain further gains.

    Price Analysis

    The price of DOGE began its recovery from $0.0965, climbing above $0.0990. It is currently trading below the $0.10 level and the 100-hourly simple moving average. A bearish trend line is forming, with resistance at $0.1010 on the hourly chart of the DOGE/USD pair, according to data from Kraken. Continued upward movement is contingent on the price remaining above $0.1010.

    Resistance Levels

    Dogecoin’s price recovery from the $0.0965 zone mirrors the trends of Bitcoin and Ethereum. DOGE surpassed the resistance levels of $0.0980 and $0.0988. A notable upward move occurred above the 38.2% Fibonacci retracement level, calculated from the decline between the $0.1031 swing high and the $0.0964 low. However, the price has faced challenges near $0.10. A bearish trend line is also forming, with resistance at $0.1010 on the hourly chart of the DOGE/USD pair. Dogecoin is currently trading below $0.10 and the 100-hourly simple moving average.

    Immediate resistance on the upside is near $0.1005, which aligns with the 61.8% Fibonacci retracement level, calculated from the $0.1031 swing high to the $0.0964 low, in the event of another recovery wave. The primary resistance for bulls is near $0.1010, with the next significant resistance at $0.1032. A close above $0.1032 could potentially push the price towards the $0.1050 resistance level. Further gains could lead to a test of the $0.1065 level, with $0.1120 as the next major target for bulls.

    Potential Decline

    If DOGE fails to surpass the $0.1010 level, a continued downward movement is possible. Initial support on the downside is near $0.0985, followed by major support at $0.0965. The primary support level is at $0.0950. A break below this level could trigger a further decline, potentially leading to a drop towards $0.0920 or even $0.090 in the near term.

    Technical Indicators

    Hourly MACD: The MACD for DOGE/USD is currently gaining momentum within the bearish zone.

    Hourly RSI (Relative Strength Index): The RSI for DOGE/USD is currently below the 50 level.

    Major Support Levels: $0.0985 and $0.0965.

    Major Resistance Levels: $0.1010 and $0.1032.

  • XRP’s Rebound Weakens, Renewed Downtrend Looms

    XRP’s Rebound Weakens, Renewed Downtrend Looms

    XRP Price Consolidates Amidst Recovery Wave

    The price of XRP has begun a recovery, trading above $1.290 and $1.2950. Currently consolidating, the cryptocurrency could attempt further gains if it surpasses $1.3350. XRP is trading below $1.320 and the 100-hourly Simple Moving Average. A bearish trend line is forming, with resistance at $1.3420 on the hourly chart of the XRP/USD pair, according to data from Kraken. Continued upward movement is possible if the pair settles above $1.3350.

    Hurdles Ahead for XRP

    Supported above $1.2650, XRP initiated a recovery wave, mirroring the trends of Bitcoin and Ethereum. The price climbed above $1.2880 and $1.290, entering a short-term positive zone. Bulls pushed the price above the 50% Fibonacci retracement level, calculated from the swing high of $1.3638 to the swing low of $1.2677. However, bears are active near $1.3350. A bearish trend line is also forming, with resistance at $1.3420 on the hourly chart of the XRP/USD pair. The price is currently trading below $1.320 and the 100-hourly Simple Moving Average.

    If the price continues upward, it may encounter resistance near $1.320. The first significant resistance level is near $1.3280, coinciding with the 61.8% Fibonacci retracement level, calculated from the $1.3638 swing high to the $1.2677 swing low. A close above $1.3280 could push the price towards $1.3350. The next hurdle is at $1.3420. A decisive move above the $1.3420 resistance could drive the price towards the $1.3650 resistance level. Further gains could lead to a test of the $1.380 resistance.

    Potential for Another Decline

    If XRP fails to break above the $1.3350 resistance zone, a fresh decline could ensue. Initial support on the downside is near $1.30. The next major support level is near $1.290. A break below $1.2720 could trigger a further decline towards $1.2650. The subsequent major support level is near $1.2550, below which the price could continue to fall towards $1.2250.

    Technical Indicators

    Hourly MACD – The MACD for XRP/USD is losing momentum in the bullish zone.

    Hourly RSI (Relative Strength Index) – The RSI for XRP/USD is currently near the 50 level.

    Major Support Levels – $1.3000 and $1.2900.

    Major Resistance Levels – $1.3350 and $1.3420.

  • Ethereum Tests $1,930 Support Level

    Ethereum Tests $1,930 Support Level

    Ethereum Faces Downward Pressure Amid Bearish Market Outlook

    Ethereum continues to experience significant downward pressure after falling below a key support level, reinforcing the prevailing bearish sentiment across the cryptocurrency market. With fear intensifying and sellers maintaining control, the $1,930 level has become a crucial support zone for bulls to defend against further declines.

    Bearish Structure Emerges Below Key Support

    According to a recent analysis by Mira Agent, ETH was trading in the range of $2,055 to $2,080 at the time of the report, with the broader market structure exhibiting continued signs of weakness. Ethereum’s current setup is increasingly important as bearish momentum strengthens across higher timeframes.

    Mira Agent noted that the 4-hour chart remains bearish after ETH lost the critical $2,050 support zone. Adding to the negative outlook, the 200-day moving average has maintained a downward slope since May 21. Lower highs continue to form on the chart, while selling pressure builds as market sentiment remains fragile, with the Fear & Greed Index currently indicating extreme fear at a reading of 25.

    Meanwhile, Mira’s AI confidence metric indicates only a 32% probability of bullish movement at present. Key resistance levels to watch are positioned at $2,050, $2,150, and $2,230, while major support zones are located at $1,930, $1,880, and $1,780. Mira outlined three potential scenarios for Ethereum moving forward. The dominant outlook remains a bearish continuation in the near term with a 60% probability. A consolidation phase between $2,040 and $2,090 carries a 25% probability, while the bullish reversal scenario remains the least likely at 15%, requiring a decisive weekly close above the $2,180 level to confirm renewed strength.

    Institutional Demand for Ethereum Remains Strong

    Despite current market sentiment, Mira Agent revealed that institutional tailwinds are quietly building. Notably, BitMine has executed its largest Ethereum acquisition of 2026, signaling robust interest from major players. Furthermore, SharpLink is slated to enter the Russell indexes, a milestone that will trigger significant forced passive buying, adding a layer of structural support.

    Beneath the surface of market volatility, Ethereum’s fundamental health remains remarkably resilient. A key indicator of this stability is the shift in revenue streams for Ethereum treasury firms, where staking rewards now account for 60% of total income. This trend highlights a transition toward sustainable, yield-driven growth, proving that while the price has experienced a sharp contraction, the network’s underlying economic value has not broken.

    The report concludes that this is a moment for patience, not panic. It is crucial to watch the $1,930 level closely, as it represents the definitive line in the sand for the current cycle. As long as the market can hold this support threshold, the broader bullish case remains alive.

  • Bitcoin Faces Potential Crash to $44,000, Analyst Warns

    Bitcoin Faces Potential Crash to $44,000, Analyst Warns

    Bitcoin’s anticipated recovery appears increasingly unlikely as a bearish flag formation takes shape. The leading cryptocurrency has fallen below $74,000 in the last 24 hours, and one analyst believes this latest move is part of a larger decline. Bitcoin is currently trading at $73,240, down approximately 3.2% for the day. This drop has made a bearish TradingView analysis by Xanrox more relevant, as the analyst warned that Bitcoin could fall below its current structure and begin a wider move down to $44,000.

    Bitcoin’s Bear Market Structure Nears Completion

    According to Xanrox, a crypto analyst on social media, Bitcoin’s bear market structure is approximately 70% complete. Xanrox’s prediction is based on the premise that Bitcoin has been undergoing a large corrective structure since its all-time high above $126,000 in October 2025.

    Technical analysis of Bitcoin’s chart reveals three separate bearish flag formations on the daily candlestick timeframe. The first is a small bearish flag, the second a medium bearish flag, and the third, a larger bearish flag, is currently developing around the current trading range.

    Elliott Wave analysis suggests Bitcoin’s price action since October is following an ABC corrective pattern, with wave B now complete. This analysis indicates the Bitcoin bear market is about 70% complete, but the most significant downturn is yet to come.

    Bitcoin Price Prediction

    The forecast suggests the current Bitcoin correction will continue for months along a defined path. The first major level to watch is the lower boundary of the bearish flag, with the $71,000 region being a key level. A break below $71,000 would strengthen the bearish setup and could lead to another move towards the early February low around $63,000.

    The overall forecast points to a deeper correction, with the chart indicating Bitcoin is moving through the stages of a corrective C-wave that might bottom out around $44,000. Xanrox identified this level as a strong point of control on the weekly candlestick chart, representing a high-volume zone that could attract price if it breaks below $63,000.

    The timeline for this prediction extends into the second half of the year. The projected bottom is expected around September or October 2026, followed by a stronger recovery through October, November, and December. The roadmap then points to a larger bull cycle after the correction ends, in 2027 and 2028, with Bitcoin potentially reaching as high as $200,000 by 2028.

    Benjamin Cowen, CEO of Into The Cryptoverse and former NASA researcher, has also cited October 2026 as his base-case bottom for Bitcoin’s bear market, aligning with Xanrox’s timeline.

  • Google Engineer Allegedly Profited $1.2M from Secret Search Data

    Google Engineer Allegedly Profited $1.2M from Secret Search Data

    US prosecutors have charged Google software engineer Michele Spagnuolo, also known online as ‘AlphaRaccoon,’ with allegedly using confidential internal Google search data to generate approximately $1.2 million in profits through bets placed on the prediction market platform Polymarket.

    Charges Filed

    According to a criminal complaint unsealed in the Southern District of New York, Spagnuolo allegedly accessed nonpublic “Year in Search 2025” data from Google’s internal systems. He then used this information to trade on Google-related markets on Polymarket before the results were publicly released.

    Prosecutors have charged him with commodities fraud, wire fraud, and money laundering. The Commodity Futures Trading Commission (CFTC) has filed a parallel civil complaint, accusing him of insider trading violations under the Commodity Exchange Act. The filing states that Google maintains strict confidentiality over its “Year in Search” rankings because the annual campaign is commercially valuable and designed around a coordinated public reveal intended to generate media attention, user engagement, and advertising demand.

    Alleged Scheme

    Investigators stated that Spagnuolo had access to a Google internal software tool containing confidential trend data, which displayed a “Google Confidential” warning banner. Authorities allege that between October and December 2025, Spagnuolo used the AlphaRaccoon Polymarket account to place bets on at least 23 Google-related prediction markets. These included contracts tied to the “#1 Searched Person on Google this year” and “Top 5 Most Searched People on Google 2025.”

    The complaint states that after reviewing Google’s internal data on October 15, 2025, Spagnuolo placed trades the following day, backing Kendrick Lamar to become the top searched person of the year while simultaneously betting against Pope Leo XIV achieving the same result. Prosecutors said he continued placing trades over the following weeks using knowledge unavailable to the public.

    On November 27, 2025, investigators allege that Spagnuolo again accessed confidential Google search rankings and learned that musician d4vd had overtaken Kendrick Lamar as the top trending person for the year. Roughly three hours later, the AlphaRaccoon account allegedly placed bets favoring d4vd, despite the market assigning almost no probability to that outcome at the time.

    The filing states that the account risked roughly $2.75 million across Google Year in Search-related markets between October 15 and December 4, 2025. After Google publicly released its Year in Search results on December 4, prosecutors said the AlphaRaccoon account generated approximately $1.2 million in profits.

    Concealment Efforts

    Investigators further allege that Spagnuolo attempted to conceal the origin of the proceeds by moving crypto through multiple wallets, decentralized swapping services, and a privacy-focused transfer service.

    Broader Context

    The allegations against Spagnuolo come as prediction markets face increasing scrutiny over insider-style trading activity. In April, the rival platform Kalshi banned three US political candidates after discovering they had placed bets tied to their own election races. Those included Minnesota State Senator Matt Klein, Texas congressional candidate Ezekiel Enriquez, and Virginia Senate candidate Mark Moran.

    Kalshi said the trades violated exchange rules that prohibit people with direct influence over an event from trading related contracts. The platform issued fines and five-year bans.

  • Grayscale: Hyperliquid a Breakout Success, Report Says

    Grayscale: Hyperliquid a Breakout Success, Report Says

    Grayscale Report Highlights Hyperliquid’s Rise

    A new research report from Grayscale Investments is spotlighting Hyperliquid, characterizing it as a significant success story in the evolving cryptocurrency market. The report analyzes how the platform has rapidly gained momentum by combining high-performance trading infrastructure with a fully on-chain model, establishing itself as a major player in the derivatives space.

    Hyperliquid’s Integrated Ecosystem Gains Industry Recognition

    Grayscale Investments has significantly elevated Hyperliquid’s institutional profile with the release of its detailed research report, titled “Hyperliquid Breaks the Mold.” An analyst known as Crypto Banter on X revealed that Grayscale describes Hyperliquid as one of the breakout success stories in the modern digital asset industry.

    The report attributes Hyperliquid’s growth to several factors, including its projected $800 million in annualized revenue for 2025, which would position it among the largest crypto assets by market capitalization and a dominant force in the perpetuals trading market. Grayscale highlighted Hyperliquid’s open architecture, which supports spot trading, commodities, and outcome-based markets. This versatility is combined with self-custody principles and centralized exchange-level performance.

    In a notable development, Grayscale has filed and recently amended an S-1 registration for a proposed Hyperliquid ETF, although approval from the US Securities and Exchange Commission (SEC) is still pending. Crypto Banter noted that this represents meaningful institutional recognition for a project that has generated real revenue, demonstrated strong product-market fit, and delivered technical innovation.

    Despite its rapid growth, the report emphasizes that Hyperliquid’s revenue is small compared to the massive traditional global derivatives industry, suggesting significant potential for further growth if it continues to gain market share.

    Hyperliquid’s Unique Position

    Hyperliquid distinguishes itself from both traditional finance and existing crypto projects, offering a distinct and forward-looking model for blockchain-based financial systems. The platform is described as breaking the mold rather than fitting into established categories. An investor known as Gustavo Am on X explained that Hyperliquid is offering a compelling vision for the future of blockchain-based finance.

    At its core, Hyperliquid operates on an open architecture platform that encourages permissionless innovation, allowing it to adhere to foundational DeFi principles such as transparency and self-custody. Simultaneously, it is structured around a highly optimized core application that has already proven its ability to attract and retain users. This dual approach positions Hyperliquid as more than just another protocol. If it continues to execute effectively, retain and grow its dedicated community, and benefits from favorable regulatory developments, it could potentially achieve broader adoption and become a financial services leader.

  • Institutional Investors Increase Bets, Accumulating $170 Million.

    Institutional Investors Increase Bets, Accumulating $170 Million.

    HYPE has retreated below $60 as the broader market faces selling pressure, impacting even the strongest performers of recent weeks. While the price drop from all-time highs is evident, data from Arkham Intelligence reveals a transaction that provides context for the current price weakness.

    A16z Buys the Dip

    A wallet linked to Andreessen Horowitz, the Silicon Valley venture capital firm known as a16z, has purchased an additional 253,947 HYPE tokens, worth approximately $15.03 million, over the past several hours. a16z’s dedicated crypto fund has been a significant institutional force in digital assets since its launch, backing foundational projects including Coinbase, Uniswap, and Solana.

    The timing of the purchase is crucial. A16z is not buying HYPE at its all-time high during a period of market exuberance. Instead, it is buying HYPE as the price falls below $60 amid market-wide selling pressure, deploying $15 million precisely when most participants are reducing risk. This behavior is not reactive but rather an expression of a consistent investment thesis. For HYPE trading below $60, the a16z purchase signifies that the current price level is not a reason to pause, but rather a reason to increase holdings.

    A History of Strategic Accumulation

    The latest purchase completes the overall a16z HYPE strategy. Since April 14, the linked wallet has accumulated 3.55 million HYPE tokens at a total cost of approximately $170.7 million, with an average entry price of $48 per token. HYPE trading below $60 today means the position currently holds significant unrealized gains. However, the average entry price highlights the accumulation strategy, which began and continued through periods when the current price levels were not yet visible. This persistence through bearish price action is a key indicator. A16z did not build this position during a single euphoric session or chase HYPE after the all-time high breakout attracted mainstream attention. The accumulation occurred over multiple weeks, amidst market uncertainty, broader crypto selling pressure, and specific pullbacks that deterred less conviction-driven participants.

    This sustained buying through weakness, with $170 million deployed at an average of $48 while the broader market struggled, demonstrates an institutional thesis that has been tested repeatedly by adverse conditions and has remained consistent. Each purchase below the average strengthened the position, and each purchase above it confirmed the direction. For HYPE pulling back below $60 under current selling pressure, the a16z behavior provides a clear signal of how the most informed institutional participant views the current price level. The latest $15 million purchase is not a new thesis but a reiteration of the same, at a price the market is offering as a discount.

    Technical Outlook

    HYPE is experiencing its first significant pullback after a strong rally that pushed the asset above $60 to new all-time highs. Despite the recent decline, the daily chart still reflects a strong bullish structure among major altcoins, with the price trading well above all key moving averages.

    The rejection near the $63–$65 region appears driven more by short-term profit-taking than a structural trend reversal. After accelerating throughout May, HYPE became extended from its short-term moving averages, creating conditions for a cooling-off phase. The current retracement toward the $56–$57 area is now testing the first important support zone following the breakout.

    Technically, the broader trend remains bullish. The 50-day moving average continues to rise aggressively, while the 100-day and 200-day moving averages are also trending upward after the major recovery that began earlier this year. Volume expanded sharply during the breakout phase, confirming strong market participation. The current pullback is shallow relative to the rally’s magnitude. HYPE has corrected modestly despite broader market weakness affecting Bitcoin and Ethereum, suggesting buyers continue absorbing supply during dips. As long as HYPE holds above the $52–$54 region, the broader breakout structure remains intact, with bulls maintaining control of momentum despite the recent volatility.

  • Sui Network Suffers Hours-Long Outage, Again.

    Sui Network Suffers Hours-Long Outage, Again.

    Built to rival other high-speed layer-1 blockchains, the Sui network has again experienced downtime, echoing issues previously faced by Solana.

    Network Stall

    The “network stall,” first identified and investigated on Thursday morning, resulted in a major outage lasting over five hours as the Sui team worked to resolve the issue.

    Around 10:30 a.m. ET, the blockchain posted on X, stating, “Sui Mainnet is currently experiencing a network stall. Be aware that transactions may be paused at this time. Updates will be shared as soon as they are available.”

    An update on the Sui network status page at 3:40 p.m. ET indicated that a “fix is rolling out to validators.”

    Previous Outages

    This latest “stall” follows a similar event that plagued the layer-1’s mainnet in January, resulting in over six hours of downtime. Prior to that, the network faced a significant validator issue in 2024 that prevented transaction processing.

    While the network’s engineers identified the issue shortly after beginning their investigation, a fix had not yet been implemented as of the time of this writing, according to the blockchain’s status page.

    Token Impact

    Amid the downtime, the network’s native token, SUI, may have been affected, falling 5.4% in the last 24 hours to trade at $0.92. This decline outpaced losses from Bitcoin, Ethereum, and other leading cryptocurrencies.

    ETF Developments and Historical Performance

    Earlier this year, the first SUI ETFs were launched, with products from Canary and Grayscale providing exposure to the SUI token and staking reward access to traditional investors through equity markets.

    The network’s native token reached an all-time high of $5.35 in January 2025 but has since fallen by over 82% from that peak.

    Background

    Launched in 2023, the network was developed by Mysten Labs, a spin-off of Meta’s Diem project. The network previously raised $300 million in a Series B round in 2022, valuing it at $2 billion.