Category: Uncategorized

  • Stablecoin Market Cap Drops Amidst Memecoin Rotation; CLARITY Act Advances

    Stablecoin Market Cap Drops Amidst Memecoin Rotation; CLARITY Act Advances

    The cryptocurrency market is experiencing a significant rotation, with the stablecoin market capitalization decreasing by over $10 billion since May, according to reports. This outflow is reportedly fueling a rotation into memecoins as investors seek higher returns. Concurrently, regulatory developments are progressing, with the CLARITY Act expected to advance, potentially clarifying digital asset classifications.

    Bitcoin and Ethereum have demonstrated resilience amidst these market dynamics. Bitcoin’s price, which dipped below $63,000 over the weekend and triggered over $14 million in long liquidations, has since settled back into the $63,000 to $64,000 range. Verified facts indicate that spot Bitcoin ETFs have recorded net inflows after nine weeks of withdrawals, and the Coinbase Premium Index has climbed back toward neutral after 55 consecutive days in negative territory, suggesting increased activity from U.S. buyers.

    Ethereum’s price has been trading around $1,800. Institutional interest in Ethereum as a potential settlement layer for the AI economy is growing, a narrative supported by analysts like Tom Lee. His firm, Bitmine, holds 5.74 million ETH, representing approximately 4.8% of the total supply, and plans to increase this stake. In recent days, Ethereum whales have purchased an additional $20.6 million worth of ETH.

    Regulatory progress is a key focus, with lawmakers expected to unveil an updated version of the CLARITY Act next week. The bill could reach Congress as early as July 17, marking a significant moment for the crypto industry. Supporters believe the act will define which digital assets fall under securities laws and which are commodities, potentially removing a major obstacle for the sector.

    Further supporting the ecosystem, Japan has pledged increased support for Web3 startups through funding and friendlier policies, as stated by Prime Minister Sanae Takaichi at WebX 2026. Meanwhile, on the development front, the Ethereum Foundation reported that one of its AI agents detected a validator crashing bug, highlighting advancements in network security. A separate Cambridge study found that Ethereum’s transition to Proof of Stake reduced its electricity consumption by over 99.9%, strengthening its appeal for sustainability-focused institutions.

    Despite these developments, uncertainties remain. The precise impact of the CLARITY Act on digital asset classification is yet to be determined. Analysts like Jurrien Timmer anticipate a potential market shakeout before a rally, with $60,000 seen as a possible bottom for Bitcoin. The long-term implications of proposals like BIP 110, which aims to limit arbitrary data in Bitcoin transactions, are also a point of discussion, with some critics arguing it could divide the community.

    The current market sentiment, characterized by a rotation out of stablecoins into assets with higher upside potential, suggests a cautious but engaged investor base. The upcoming days will be crucial for observing regulatory progress on the CLARITY Act and tracking institutional buying trends in Bitcoin and Ethereum, which could influence future market resilience.

    Why This Matters

    The materials describe a narrow update: The stablecoin market cap has decreased by over $10 billion since May, with funds reportedly rotating into memecoins. The exact impact of the CLARITY Act on digital asset classification.

    Broader Context

    Source materials place the factual news in this context: The article is dated July 12 and discusses recent events and potential future developments in the cryptocurrency market.

  • Legend Awakes Concludes Teaser Campaign, Unveils Alberich Token as ‘Musical Meme Coin’

    Legend Awakes Concludes Teaser Campaign, Unveils Alberich Token as ‘Musical Meme Coin’

    Legend Awakes has concluded its multi-week mystery-driven teaser campaign with a cinematic reveal video, introducing the Alberich Token. The project is described as the world’s first “Musical Meme Coin,” integrating mythology, music, artificial intelligence, and blockchain technology through a narrative-first approach.

    The reveal video, which premiered on July 13th, 2026, marks the culmination of a campaign that employed cinematic visuals, cryptic messages, and hidden clues across platforms like X. According to Legend Awakes, this campaign garnered over 300 million views across its content, sparking significant community discussion. The video reportedly synthesizes the campaign’s various elements while introducing the Alberich Token.

    Inspired by Alberich, a figure from Richard Wagner’s “The Ring of the Nibelung,” the Alberich Token project aims to reinterpret this epic legend for the Web3 era. Legend Awakes states that the project merges mythology, culture, and innovation to create a distinctive digital asset ecosystem. Developed under the Nibelungen Foundation, the initiative is presented as a story-driven endeavor.

    Instead of a conventional token launch, Legend Awakes emphasizes a story-first strategy, encouraging audiences to engage with the project’s unfolding narrative before exploring its underlying technology. This approach is designed to foster a community around the project’s lore and themes.

    Further details and continued engagement with the project’s narrative are available on the official website, LegendAwakes.com. The cinematic reveal video can also be viewed via the official Legend Awakes account on X.

    Why This Matters

    The materials describe a narrow update: Legend Awakes released a cinematic reveal video, ending a multi-week teaser campaign on X. The campaign used cinematic visuals, cryptic messages, and hidden clues to introduce the world behind Legend Awakes.

    Broader Context

    Source materials place the announcement in this context: The campaign used cinematic visuals, cryptic messages, and hidden clues to introduce the world behind Legend Awakes, generating more than 300 million views across campaign content and prompting thousands of comments, reposts, and community discussions.

  • Binance Adjusts KORUUSDT Perpetual Contract Size

    Binance Adjusts KORUUSDT Perpetual Contract Size

    Binance Futures to Adjust KORUUSDT Contract Size Following Stock Dividend

    Binance Futures is set to adjust the contract size for its USDⓈ-Margined KORUUSDT Perpetual Contract on July 15, 2026, commencing at 00:15 UTC. This adjustment is necessitated by forward share splits of the underlying asset issuer’s issued and outstanding shares, structured as a stock dividend. The adjustment process is anticipated to conclude by 13:30 UTC on the same day, with a subsequent “cancel-only” phase that could last up to five minutes.

    Underlying Asset and Split Details

    The underlying asset for the KORUUSDT Perpetual Contract is the Direxion Daily South Korea Bull 3X ETF (NYSE Arca: KORU). The issuer has announced a 20-for-1 forward share split, implemented as a stock dividend. This means the adjustment scale factor will be 20.

    Impact on Open Positions and Trading

    During the adjustment period, all strategy bots, including Grid, DCA, and Snowball, linked to the KORUUSDT perpetual contract will be terminated and their positions automatically closed at 00:05 UTC on July 15, 2026. These positions will not be reinstated after the adjustment.

    Users with open positions will see their positions closed first, with unrealized profits and losses settled and credited to their Cross Margin Futures Account. For users in isolated margin mode, realized profits and all margin balances will be transferred to their Cross Margin Futures Account. Following the adjustment, new positions can be opened, with margin balances transferred to the Isolated Margin Futures Account based on the leverage level selected prior to the adjustment.

    The “cancel-only” phase will permit users to submit, modify, or cancel Post-Only orders. The duration of this phase will be determined by Binance, depending on market liquidity, and may extend up to five minutes.

    Chart and Data Continuity

    The continuous candlestick chart for the KORUUSDT perpetual contract will be retained and updated with the newly adjusted price. For time intervals of 12 hours and below, price charts prior to 00:00 UTC on July 15, 2026, will be corrected within the first week post-adjustment. For daily and longer time intervals, price chart corrections will be completed before the seventh day of the following calendar month.

    Trading Status and Timeline

    Binance Futures will provide real-time updates on the trading status of the contract. Users can check the latest information via API or the designated webpage.

    • Before July 15, 2026, 00:15 UTC: Continuous Trading Session State (TRADING)
    • July 15, 2026, 00:15 UTC to July 15, 2026, 13:30 UTC: Contract Size Adjustment process begins, with a Halt Session State (TRADING_HALT).
    • July 15, 2026, 13:30 UTC to July 15, 2026, 13:35 UTC: Cancel-only phase after adjustment completion, with a Cancel Only Session State (TRADINGCANCELONLY).
    • After July 15, 2026, 13:35 UTC: Trading functions resume under Continuous Trading Session State (TRADING).

    This announcement is made in accordance with relevant exchange and clearing rules. It is important to note that TradFi Perps are not affiliated with, sponsored, endorsed, or approved by the issuer of the underlying shares or the exchange where they are listed.

  • XRP Dips to 10-Day Low Amid Fading Whale Demand and ETF Outflows

    XRP Dips to 10-Day Low Amid Fading Whale Demand and ETF Outflows

    Crypto Market Dips Amid Middle East Tensions, XRP Faces Headwinds

    The cryptocurrency market has experienced another downturn, a move largely anticipated in the wake of escalating tensions in the Middle East. Ripple’s cross-border token, XRP, has not been immune to this broader market correction.

    While the immediate outlook for XRP appears challenging, on-chain data offers glimmers of optimism on a larger, macroeconomic scale.

    Price Volatility and Recent Slump

    At the beginning of the month, XRP’s price fell to $1.01, a level not seen in nearly two years, amidst a widespread market crash. The token saw a swift rebound in the subsequent days, even testing the $1.20 resistance. However, it was pushed back down, dipping below $1.10 within days.

    The past week has been relatively subdued, with XRP trading sideways between $1.09 and $1.12. This stability was disrupted on Monday morning as the market reacted to renewed attacks between the United States and Iran. XRP subsequently slipped to just under $1.07, its lowest point since the earlier monthly low.

    Factors Contributing to XRP’s Retreat

    Beyond the general market weakness, a potential contributor to XRP’s recent decline is activity surrounding Exchange-Traded Funds (ETFs). After nine consecutive weeks of net inflows, this trend was broken last week, with over $7 million exiting these funds.

    Further analysis from on-chain data providers Santiment and Ali Martinez indicates a significant cooling in whale activity on the XRP Ledger. The number of large transactions, exceeding $1 million, has plummeted from 70 to a mere 2 within approximately a week.

    Santiment had previously observed that XRP Ledger activity had become “unusually quiet,” with the creation of new wallets reaching its lowest point in nearly two years.

    Analyst Perspectives on XRP’s Future

    CRYPTOWZRD commented on XRP’s recent price movements, noting that the token closed “indecisively.” The analyst anticipates potential “further upside” if XRP can regain traction against Bitcoin, a scenario that has not materialized for an extended period.

    In contrast, EGRAG CRYPTO maintains a strongly bullish long-term outlook for XRP. In a recent post on X, EGRAG suggested that historical patterns may be repeating for XRP, citing several indicators that point to a potential macro bottom.

    “The macro bottom may already be behind us,” EGRAG stated. “Now we need a bounce toward the 50-MA (about $1.60), a healthy rejection, a retest of the 618 (0.5 Fibonacci zone), and that retest will become the make-or-break accumulation zone before the next impulsive move higher. In my view, this would complete a double-bottom lower low and set the foundation for the next macro rally for XRP.”

    EGRAG outlined ambitious targets for this potential long-term rally, with some extreme projections reaching as high as $31. More conservative estimates include targets of $15, $9, and a range of $5-$6.50.

  • Crypto Markets Face Four Key Influences This Week

    Crypto Markets Face Four Key Influences This Week

    Markets Brace for Volatility Amid Geopolitical Tensions and Inflation Data

    Cryptocurrency markets, which had largely maintained weekend gains, showed signs of fragility Monday morning as traders absorbed fresh developments in the US-Iran conflict.

    The United States initiated a series of strikes against Iran in response to an Iranian attack on a container ship in the Strait of Hormuz. Iran has declared the strait closed, a move contradicted by President Trump.

    Adding to potential market jitters, several significant inflation reports are slated for release this week, which could further unsettle sentiment and exacerbate volatility in the ongoing bear market.

    “Q2 2026 earnings season has arrived, and Strait of Hormuz tensions are mounting again,” noted The Kobeissi Letter.

    US Central Command confirmed Monday morning that forces had commenced further strikes against Iran, aiming “to continue degrading their ability to attack civilian mariners and commercial ships freely transiting the Strait of Hormuz.”

    Crude oil prices saw a notable increase, climbing approximately 4%. West Texas Intermediate (WTI) crude reached $74.50 per barrel, while Brent crude hit $79. US stock futures opened marginally lower.

    Inflation Data Looms Large

    The market’s attention now turns to key economic indicators. June’s Consumer Price Index (CPI) inflation data is scheduled for release on Tuesday, with the Producer Price Index (PPI), which measures wholesale inflation, due on Wednesday.

    Year-on-year projections suggest headline CPI will rise by 3.8% and PPI by 6.2%, according to Yahoo Finance. Elevated inflation figures could intensify pressure on the Federal Reserve to raise interest rates, a development typically unfavorable for risk-sensitive assets like cryptocurrencies. The escalating military action in the Middle East also poses a risk to efforts to curb inflation.

    Further economic data releases this week include June Retail Sales and the July Philly Fed Manufacturing Index on Thursday, followed by July’s Michigan Inflation Expectations and Consumer Sentiment reports on Friday.

    Corporate Earnings and Crypto Performance

    This week also marks a busy period for corporate earnings, with several major Wall Street banks and financial institutions set to report their second-quarter results. JPMorgan Chase, Goldman Sachs, Bank of America, Wells Fargo, and Citibank are scheduled to release their figures on Tuesday, with Morgan Stanley and BlackRock following on Wednesday.

    The total market capitalization for cryptocurrencies remained relatively stable over the weekend, hovering around $2.26 trillion. A minor dip was observed on Monday morning following the latest airstrikes.

    Bitcoin had held its position just above $64,000 for the preceding 12 hours but saw a slight decline to $63,400 in early trading, where it remained at the time of reporting. Ether prices demonstrated more resilience, staying above $1,800 for most of the past day, building on a 15% gain in the previous two weeks. However, analysts caution that further conflict escalation and persistent inflation could lead to significant declines for both major cryptocurrencies.

  • GhostSwap’s Non-Custodial Swap Service: Privacy Focus Meets Third-Party Compliance

    GhostSwap’s Non-Custodial Swap Service: Privacy Focus Meets Third-Party Compliance

    GhostSwap operates a non-custodial instant swap platform supporting over 1,600 cryptocurrencies, prioritizing user privacy and simplicity by foregoing account creation and Know Your Customer (KYC) verification. This approach positions GhostSwap as an alternative to traditional cryptocurrency exchanges, which often require extensive onboarding processes.

    According to GhostSwap, the swap process is designed for ease of use. Users select their desired cryptocurrency pair, provide a destination address for the swapped assets, and then send their source cryptocurrency to a temporary deposit address provided by the platform. GhostSwap states that the swapped coins are typically received at the destination address within 5 to 30 minutes, with completion times influenced by network congestion. The platform aggregates liquidity from multiple sources to secure competitive rates and facilitates cross-chain swaps, enabling exchanges between assets on different blockchains.

    GhostSwap’s extensive token support includes major cryptocurrencies like Bitcoin, Ethereum, Solana, and Polygon, alongside privacy-focused coins such as Monero (XMR) and Zcash (ZEC). The company highlights this support for privacy coins as a key differentiator, particularly as many other platforms have delisted such assets due to regulatory pressures. GhostSwap claims to have facilitated over $750 million in swaps for approximately 1.5 million users.

    The platform charges a flat 2.0% baseline fee on each swap, which is incorporated into the quoted exchange rate. Standard blockchain network fees, commonly known as gas fees, are additional and borne by the user. While GhostSwap’s 2% fee is higher than some competitors—such as Changelly (around 0.25%), Godex (approximately 0.5%), and FixedFloat (1% for fixed-rate, 0.5% for floating-rate swaps)—the company emphasizes the simplicity of its fee structure. GhostSwap offers a single, transparent rate without tiers or hidden charges, appealing to users who value upfront cost clarity.

    Despite its “no KYC” policy, GhostSwap states that it collaborates with licensed crypto processing partners to perform Anti-Money Laundering (AML) and sanctions screening. GhostSwap warns that each transaction may be shared with these partners for automated checks, and that transactions could be flagged, blocked, rejected, or refunded if they do not meet compliance requirements. The platform’s terms of use indicate that transactions may be subject to AML/KYC compliance by these licensed third parties, and in some instances, additional information might be requested.

    Users bear the responsibility for ensuring they send the correct cryptocurrency to the correct address and on the correct network. GhostSwap warns that sending a coin to an address on the wrong network or mistyping an address can lead to the permanent loss of funds. The company advises users to meticulously double-check all transaction details before confirmation and suggests conducting small test swaps for larger amounts to verify the process.

    GhostSwap also provides a Telegram bot, launched in 2025, which enables users to execute swaps directly within the messaging application. Furthermore, a server-to-server API is available for business integrations, featuring rate limits of up to 120 requests per second per IP and 30 requests per second per API key.

    Emphasizing its non-custodial nature, GhostSwap asserts that it never takes long-term control of user assets. Funds are routed directly from the user’s wallet to the intended destination wallet, and the platform never requests private keys. Uncertainties persist regarding the platform’s exact operational start date prior to the Telegram bot’s launch, specific details about the third-party compliance partners, and the precise criteria used for flagging transactions.

    Why This Matters

    GhostSwap provides a platform for users to swap cryptocurrencies without creating an account or undergoing KYC verification. The exact operational start date of GhostSwap prior to the Telegram bot launch in 2025.

    Broader Context

    Traditional crypto exchanges require extensive onboarding processes (account creation, email verification, KYC, 2FA) that can take days. GhostSwap’s model offers an alternative for users prioritizing privacy and simplicity.

  • Gemini AI Forecasts Solana Price for Next 90 Days

    Gemini AI Forecasts Solana Price for Next 90 Days

    Gemini AI Projects $100-$115 Solana Price Target in 90 Days

    Google’s Gemini AI has presented a contrarian outlook for Solana (SOL), suggesting a significant price surge within the next 90 days. The model posits that the current market sentiment, characterized by widespread reluctance to invest in Solana, represents a classic contrarian buying opportunity. Gemini forecasts a price range of $100 to $115, driven by a shift from retail capitulation to institutional accumulation and a potential short squeeze.

    Network Activity Diverges from Price

    The bullish case for Solana, according to Gemini, is rooted in a divergence between its network activity and current price. Despite trading around $79, the prediction highlights that June 2026 marked the busiest month in Solana’s history, processing a record 4 billion transactions. This robust network activity, coupled with stablecoin supply remaining above $16 billion and annualized application revenue pacing at $1.8 billion, suggests a growing underlying economy that the AI deems unsustainable in the face of current price stagnation. Gemini characterizes this decoupling as a “coiled spring,” anticipating a swift and forceful resolution once market sentiment shifts.

    Factors Driving the Bullish Forecast

    The projected 90-day target of $100 to $115 is attributed to several factors: the conclusion of retail capitulation, increased institutional investment filling the void, and the forced closure of crowded short positions in a thinly traded market.

    Bearish Scenario and Support Levels

    While predominantly bullish, Gemini acknowledges a narrower bearish scenario. If liquidity remains scarce and prolonged trader frustration leads to a final market washout, the model anticipates a temporary floor test around $70 to $73. However, even this downside is framed as a floor test rather than a sustained downturn, implying an eventual upward resolution.

    Technical Analysis and Recent Performance

    Solana is currently trading at approximately $79.32, having recovered sharply from a mid-June low of around $62. Over the past three weeks, SOL has gained over 28% from this bottom. This recovery is noted as the most sustained and directional since October highs, characterized by consistent upward price action. Today’s trading saw SOL up 1.71%, reaching intraday highs of $79.60, placing it above the $70-$73 bearish support zone and approaching the $80 level.

    Resistance and Support Zones

    Immediate resistance is identified at $90, a level that previously capped rallies in February and March. A more significant ceiling is observed near $100, which served as the upper boundary of the consolidation range for several months earlier this year. This $100 level aligns with the lower end of Gemini’s 90-day bullish target. Support is firm at $70, the recent cycle low and the upper limit of the bearish floor zone, with $62 representing the absolute recent low should this level falter.

    Technical Reversal Potential

    While the broader chart pattern still indicates lower highs since September, suggesting no confirmed technical reversal yet, the current recovery’s character is described as qualitatively different from previous attempts. Increased volume, consistency, and momentum support the bounce. A sustained push and hold above $90 in the coming weeks would strengthen the short squeeze scenario outlined by Gemini.

    Contrasting with Large-Cap Cryptocurrencies

    The analysis contrasts Solana’s potential with the stagnation observed in major cryptocurrencies like Bitcoin, Ethereum, and XRP, which are reportedly testing similar resistance levels without significant breakthroughs. The article suggests that waiting for macro catalysts or institutional waves in these large-cap assets may not be a viable trading strategy.

    Opportunity in Infrastructure Plays

    The piece highlights that smaller market cap infrastructure projects operate under different dynamics, with the potential for significant repricing once discovered. The opportunity is framed as existing in the gap between a project’s intrinsic value and its current market valuation, a gap that closes upon discovery.

    Multi-Chain Fragmentation and LiquidChain

    The fragmentation of multi-chain ecosystems, where Bitcoin, Ethereum, and Solana operate as isolated systems, is identified as a costly problem in decentralized finance (DeFi) due to fees, slippage, and failed transactions when value crosses boundaries. LiquidChain is presented as a solution that aims to make these crossings free by integrating all three networks into a single execution environment, offering complete ecosystem access without transaction taxes.

    LiquidChain Presale

    The article mentions that LiquidChain’s presale is currently priced at $0.01454, having raised over $890,000, positioning it as an early and undiscovered opportunity.

  • Bitcoin Sees Early July Price Recovery Amidst Seasonality, but Market Uncertainty Remains

    Bitcoin Sees Early July Price Recovery Amidst Seasonality, but Market Uncertainty Remains

    Bitcoin (BTC) has experienced a price recovery in early July, moving from a recent low of $57,700 to approximately $64,000. This represents an 11% increase from its lows. Analysts attribute this movement to historical July seasonality and indications of recovering demand. However, broader market conditions remain predominantly bearish, as highlighted by key on-chain metrics.

    Historically, July has often been a favorable month for Bitcoin. Analysts noted that during previous bear cycles, such as in 2018 and 2022, Bitcoin concluded the month with significant surges of 20% and 17%, respectively. This historical pattern suggests that July’s positive seasonality could be contributing to the current recovery, potentially providing a tailwind even within a generally bearish market.

    Further supporting the recovery narrative are indications of improving demand. According to CryptoQuant, total Bitcoin demand has been recovering and is climbing back towards neutral levels after a sharp contraction in early June, when 30-day total demand metrics fell to -650,000 BTC. Speculative futures demand has turned slightly positive, while spot apparent demand is contracting at its slowest pace since mid-May. Analysts explained that a move back into positive territory for these metrics would suggest that the demand engine is re-igniting, though it has not yet reported a sustained shift.

    Investor demand in the United States also appears to be stabilizing. The Coinbase Premium Index, a measure of U.S. investor demand, has recovered from deeply negative readings to -0.062. This recovery is seen as a signal that selling pressure on U.S. trading platforms is easing and institutional appetite is stabilizing, aiding Bitcoin’s rebound from the $57,700 level.

    Despite these developments, the overall market sentiment remains bearish. The CryptoQuant Bull Score Index is currently hovering at 20, which is considered within the bearish zone. Analysts noted that for a sustainable rally to occur, this index needs to rise above 60. Until then, any price rebounds are likely to be treated as bear-market recoveries rather than definitive trend reversals.

    The current situation presents a mixed picture for Bitcoin. While seasonal trends and recovering demand metrics offer some optimism for the short term, the persistent bearish sentiment indicated by on-chain data suggests that caution is warranted. Whether the current demand engine will re-ignite into positive territory and if this recovery represents a trend reversal remains uncertain, contingent on sustained demand and a shift in broader market sentiment.

    Why This Matters

    The materials describe a narrow update: Bitcoin (BTC) has risen from a low of $57,700 to $64,000 in early July. Whether the current demand engine will re-ignite into positive territory.

    Broader Context

    Source materials place the factual news in this context: Analysts have predicted for July based on historical data.

  • Ethereum’s Path Uncertain as It Tests Key Resistance Zone

    Ethereum’s Path Uncertain as It Tests Key Resistance Zone

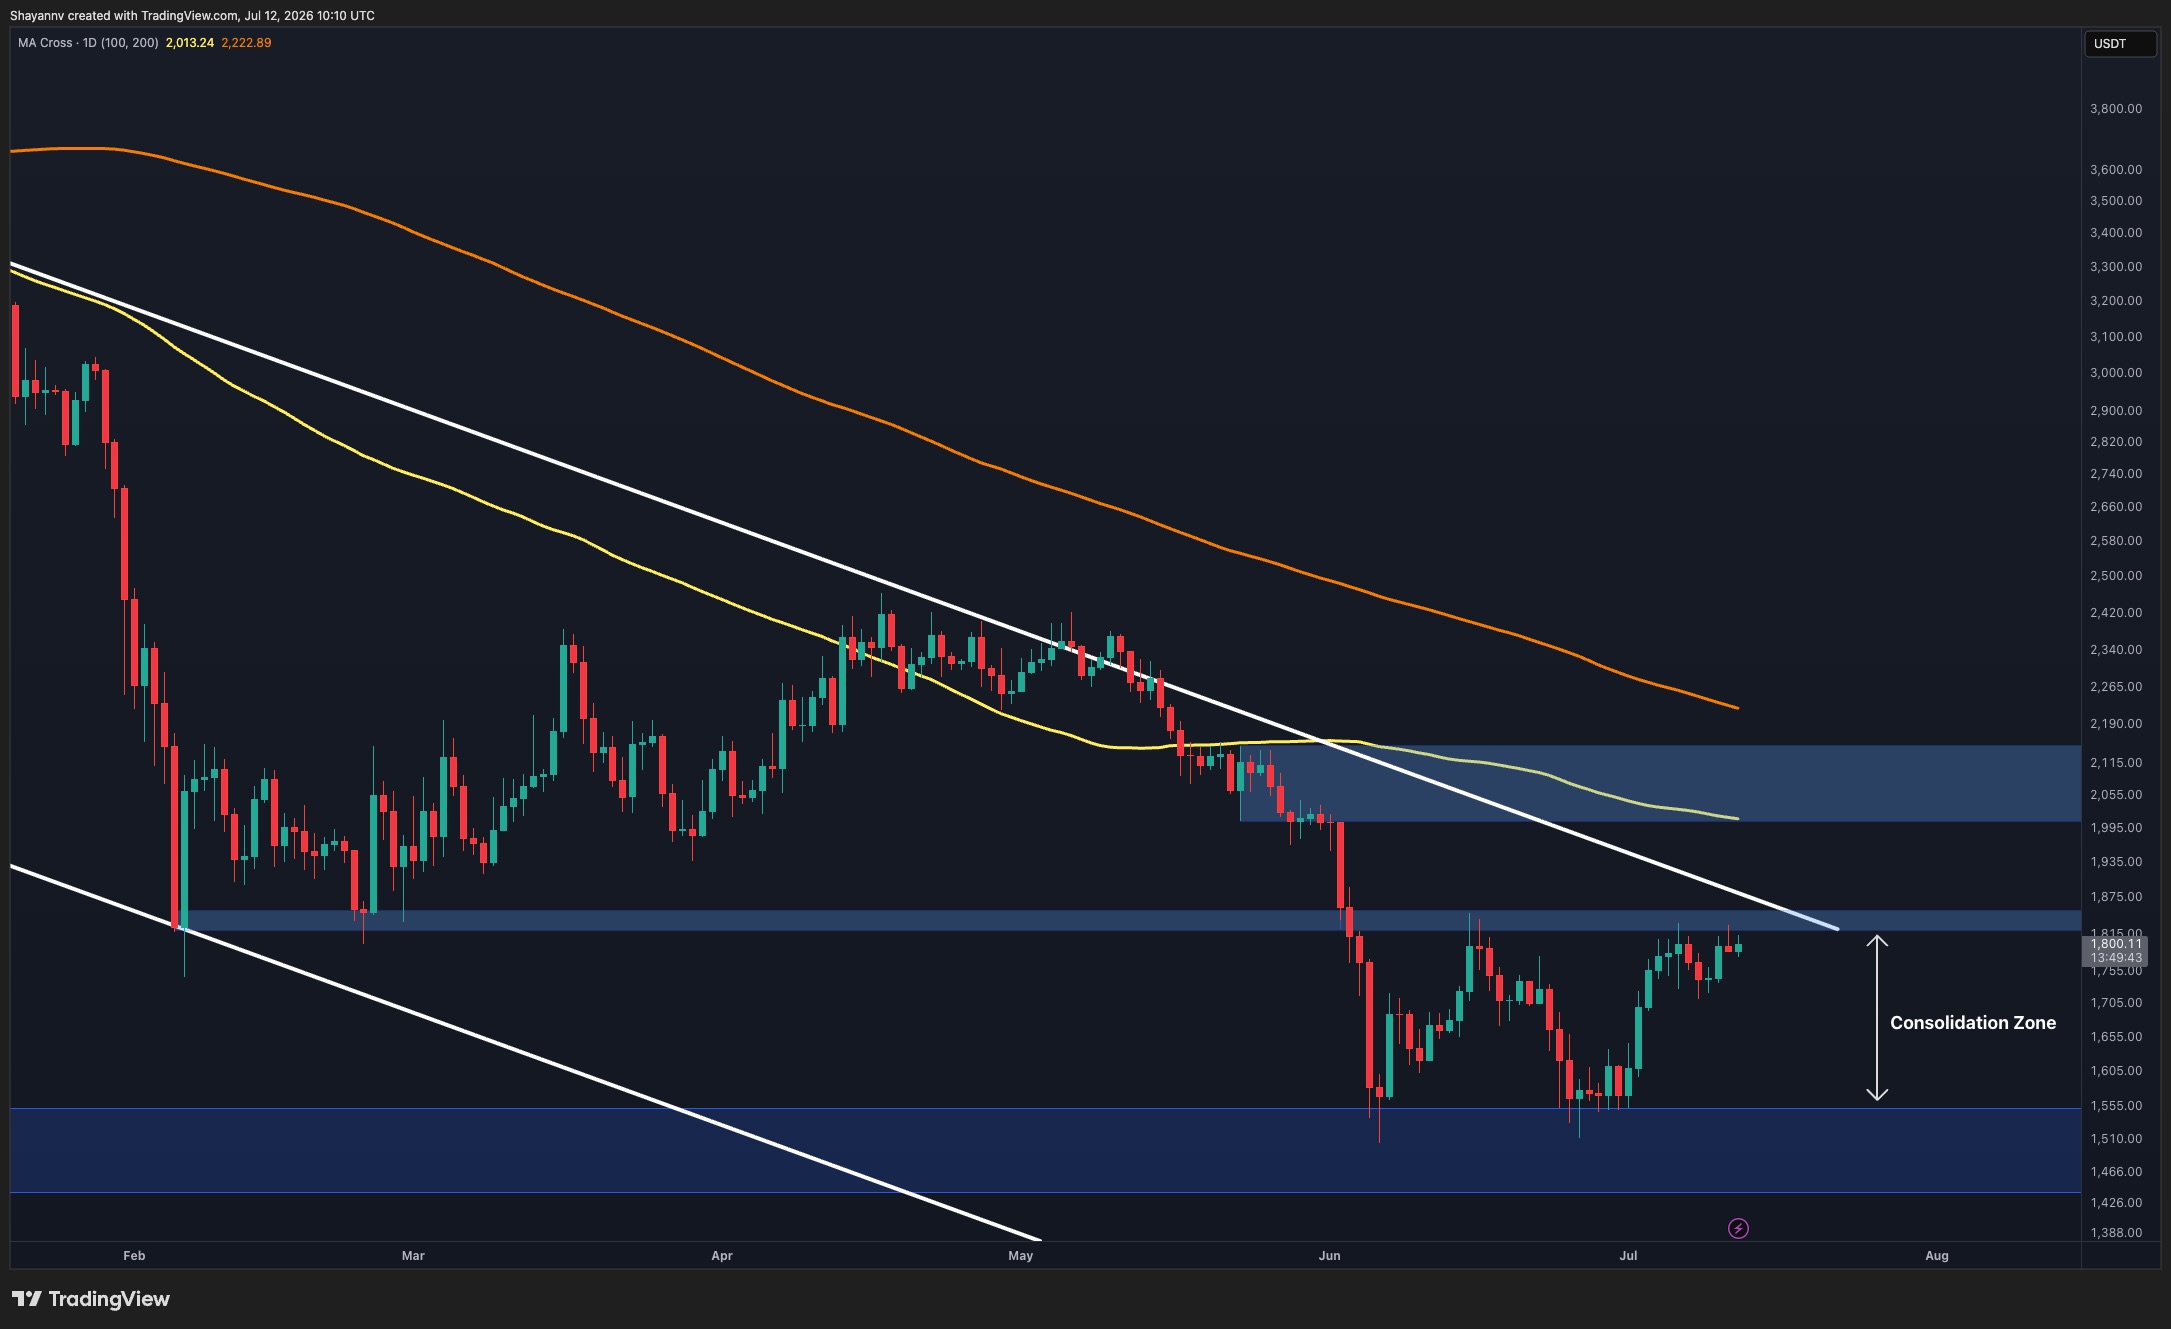
    Ethereum is currently testing a critical technical resistance zone between $1.80K and $1.85K. This area is significant as it aligns with a descending trendline that has capped price action since May, and also represents a former horizontal support level that has now turned into resistance. The current price action is occurring below both the 100-day and 200-day moving averages, which are both trending downwards, indicating a broader bearish market structure.

    The 4-hour chart, however, shows an ascending structure that has been developing since the late-June low. Within this structure, Ethereum has respected the rising channel boundaries, forming higher highs and higher lows, which suggests improving short-term momentum. Key demand zones around $1.62K-$1.64K and $1.72K-$1.74K have been reclaimed and established, respectively, providing support during recent pullbacks.

    Despite this short-term constructive price action, the rally is now approaching the upper boundary of this ascending channel and the major resistance band around $1.80K-$1.85K. This confluence of factors creates a natural area where profit-taking and seller activity could emerge. As long as Ethereum remains below this descending trendline and the $1.80K-$1.85K resistance zone, the current upward movement can still be interpreted as a recovery rally within a larger downtrend.

    Further complicating the outlook is the alignment of technical resistance with liquidity levels. A liquidation heatmap indicates a significant concentration of short-side liquidity situated above the current market price, particularly within the $1.95K-$2.1K region. This area also coincides with the 100-day moving average, which is positioned around $2K-$2.1K, and a broader supply area visible on higher timeframes. Conversely, substantial liquidity pools are noted below the market, around the $1.45K-$1.55K region, which aligns with a major daily demand zone.

    The interplay between the liquidation map and the technical structure suggests that the market may first be drawn towards the overhead liquidity cluster in the $1.95K-$2.1K range. A move into this area would effectively sweep a large concentration of short liquidations while simultaneously testing a significant resistance zone.

    The reaction at the $2K-$2.1K region is expected to be pivotal in determining the next major directional move for Ethereum. If buyers manage to break through and establish acceptance above this resistance area, the recovery could potentially evolve into a broader bullish trend reversal. However, if this liquidity sweep is followed by strong selling pressure and rejection from resistance, Ethereum could enter another notable decline. In such a scenario, the price might target the large liquidity pools resting beneath the market around the $1.45K-$1.55K support zone.

    Ultimately, the path forward for Ethereum remains uncertain. While short-term momentum has shown improvement, the asset is still contending with significant long-term resistance and the potential for liquidity-driven price discovery. A decisive move above the $1.80K-$1.85K zone would shift focus toward the $2K-$2.1K resistance, but rejection could signal a continuation of the broader downtrend.

    Why This Matters

    The current situation presents an uncertain outlook for Ethereum. Whether a larger trend reversal is underway or another corrective leg lower remains ahead, with the market’s next major directional move likely to be determined by the reaction at the $2K-$2.1K region.

    Broader Context

    Ethereum has continued its recovery from the June lows and is now approaching a major technical inflection point. The asset is testing a key resistance region around $1.80K-$1.85K, which coincides with a descending trendline and previous horizontal support turned resistance. The outcome of this test remains uncertain.

  • Senate Democrats Voice Concerns Over Trump’s Crypto Ties Amid Legislative Deliberations

    Senate Democrats Voice Concerns Over Trump’s Crypto Ties Amid Legislative Deliberations

    Top Senate Democrats have voiced criticism regarding President Donald Trump’s increasing engagement with the cryptocurrency industry, citing potential conflicts of interest as Congress deliberates on digital asset legislation. These concerns stem from reported financial interests in crypto assets, which lawmakers believe warrant close examination.

    Five senior Senate Democrats have publicly expressed their reservations. According to Senate Democrats, these disclosures are particularly relevant as lawmakers are currently negotiating key pieces of crypto legislation. Separately, Rep. James Comer has warned that Democrats would pursue investigations into Trump if they regain control of the House.

    Market participants are observing these developments closely. Traders are watching whether policy headlines begin to outweigh macro drivers in influencing market sentiment. While daily crypto trading volume remains healthy, hovering around $80 billion, and Bitcoin dominance is holding above 58%, suggesting a preference for established assets, the political climate introduces a layer of uncertainty.

    Bitcoin has seen some price movement this week, climbing more than 6% and briefly trading around the $63,000 to $64,000 range before easing slightly. The cryptocurrency is currently trading between $62,000 and $63,000. Meanwhile, Ethereum has outperformed on the week, while Solana continues to trade sideways.

    Markets have largely priced in expectations for regulatory progress, with investors continuing to watch for stablecoin legislation and a clearer market structure framework, both viewed as long-term positives for the industry. However, the path forward for digital asset legislation is fraught with uncertainty. The final text of the broader market structure bill has yet to be released, and several policy issues remain unresolved. Disagreements over unrelated measures in the House have also slowed legislative momentum, making the legislative timetable uncertain.

    The bullish case for Bitcoin, according to market analysis, is straightforward: tangible progress on digital asset legislation could see Bitcoin challenge the $65,000 region. However, the base case suggests political wrangling could drag on without derailing the legislation, potentially leaving Bitcoin trading between roughly $61,000 and $65,000 for the next few weeks. The bearish scenario hinges on politics rather than charts; a loss of the support area around $61,000 to $62,000 could lead to a significant downturn. Traders positioned in large-cap assets at current levels are essentially buying a policy lottery ticket, with meaningful upside if the bill clears but limited near-term edge if it stalls.

    For traders seeking asymmetric setups, the early-stage presale market is also being explored. The presale for Maxi Doge ($MAXI) is currently priced at $0.0002828, with $4.8 million raised to date. This project is described as a meme token built on Ethereum, focusing on a meme-first marketing engine and dynamic APY staking.

    Why This Matters

    The materials describe a narrow update: Five senior Senate Democrats have publicly criticized President Trump’s increasing involvement with the crypto industry, expressing concerns about potential conflicts of interest due to his reported financial interests in crypto. The final text of the broader market structure bill has yet to be released.

    Broader Context

    Source materials place the factual news in this context: Bitcoin price remains constructive as it trades around $62,000 to $63,000, while Trump and crypto legislation continue to shape market expectations.