Category: Uncategorized

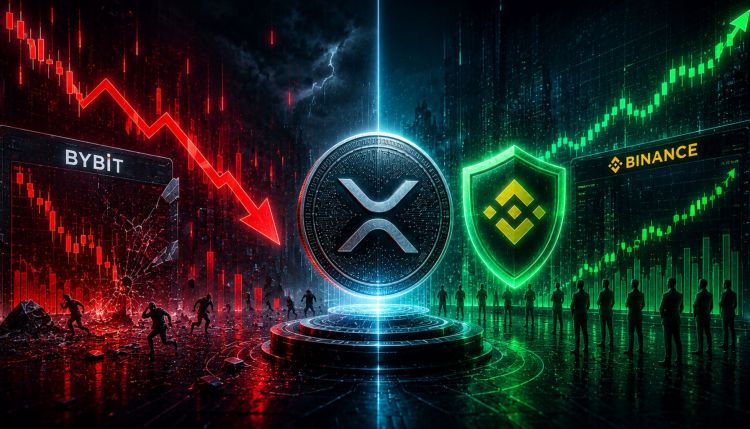
  • Bybit XRP Leverage Liquidations Surge as Binance Holds Firm

    Bybit XRP Leverage Liquidations Surge as Binance Holds Firm

    XRP Struggles Near $1.15 Amidst Divergent Market Signals

    XRP is currently navigating a challenging market environment, hovering around the $1.15 mark as fear and uncertainty dominate investor sentiment. Holders are keenly observing whether this level will solidify as support or signal a temporary reprieve before further declines. The cryptocurrency’s price is under considerable pressure, and a recent analysis by CryptoQuant has highlighted a significant divergence in derivatives activity between two of the world’s largest XRP trading platforms during the latest sell-off.

    Derivatives Reset on Bybit Contrasts with Binance Stability

    The recent market downturn triggered a forced deleveraging event on Bybit, a phenomenon that the data suggests is impossible to ignore. XRP’s open interest on Bybit plummeted to approximately $181 million, its lowest point since February 13, when it stood near $180 million. This current figure represents a substantial 36% decrease from Bybit’s recent peak of $283 million recorded on May 22. This indicates that roughly one-third of the leveraged XRP positions on one of the market’s most active derivatives venues were liquidated within a compressed timeframe, a clear signature of forced exits rather than strategic position management.

    In stark contrast, Binance presents a different narrative. XRP’s open interest on Binance remained relatively stable, hovering near $246 million following the same price decline. This represents a mere 2.4% dip from its recent high of $252 million, which was recorded on June 2. While Bybit experienced a significant contraction in open interest, Binance largely maintained its positioning. This stark divergence between two major trading venues, witnessing the same asset and the same price drop, yet exhibiting completely opposite derivative responses, forms the crux of the CryptoQuant analysis. The implications of this divergence for the health of the current XRP market structure at the $1.15 level are the most critical analytical questions arising from the data.

    Exchange Activity Points to Next Market Move

    Liquidation data further corroborates the implications of the open interest divergence, confirming that XRP’s decline was not solely driven by spot selling. Forced exits from leveraged long positions significantly amplified and accelerated the downward price movement. Multiple liquidation events exceeded $3.5 million, with long liquidations consistently dominating the activity.

    Futures volume data provides crucial context regarding the scale of these transactions. On June 5, Binance recorded approximately $1.85 billion in XRP futures volume. Bybit contributed $727 million, OKX $429 million, and Bitget $423 million, totaling $3.43 billion across these four venues in a single trading session. This indicates that the derivatives market was highly active during the price decline, processing an enormous volume of both forced and voluntary position changes.

    The subsequent recovery from a low of $1.055 back above $1.14, an rebound exceeding 8%, suggests that the sell-off included a significant leverage flush component rather than a complete breakdown in underlying demand. When forced liquidations contribute substantially to a price decline, the market often sees a recovery once these exits are complete and genuine buyers begin to emerge.

    The remaining market structure is notably distinct. Bybit has undergone a sharp deleveraging, with its open interest reset to February levels, indicating a clearing of fragile positions. Binance, however, remains near its recent highs, with its positioning largely intact. Consequently, the next significant development in XRP derivatives is anticipated to originate from Binance, as it holds the most residual exposure and has not yet experienced the reset that Bybit underwent during the recent sell-off.

    XRP Holds Near $1.15 After Losing Key Support

    XRP is currently trading around the $1.15 level, having experienced a prolonged decline that has significantly eroded the gains made in the latter half of 2025. The current market chart depicts an asset under pressure, yet also approaching a critical inflection point after testing its lowest levels of the year.

    The dominant trend observed on the 3-day timeframe is a persistent sequence of lower highs and lower lows, a pattern that began after XRP peaked near $3.50. Each subsequent recovery attempt has been met with resistance below the previous swing high, reinforcing the notion that sellers continue to dictate the broader trend. More recently, XRP lost the crucial $1.25-$1.30 support area, which precipitated another downward move towards the psychologically significant $1.10 region.

    From a structural standpoint, the current price zone is noteworthy as it aligns with the lows established during the first quarter’s correction. Buyers have repeatedly defended this area, preventing a complete breakdown despite multiple tests. However, the rebound attempts have been characterized by weakness, suggesting that demand remains constrained.

    Moving averages continue to reflect bearish conditions, with XRP trading below its 50-period, 100-period, and 200-period moving averages. The 50-period average is currently acting as dynamic resistance near the $1.40 level. Until the price reclaims this level, any upward movement is likely to be considered a technical correction rather than a trend reversal. The critical support zone remains between $1.05 and $1.10. A decisive breach of this area could expose XRP to a deeper retracement, potentially towards the $0.90-$1.00 region. Conversely, reclaiming $1.30 and subsequently $1.40 would serve as the initial indication that buyers are beginning to regain control after months of sustained weakness.

  • SpaceX Tokenized Product Launches on Bybit

    SpaceX Tokenized Product Launches on Bybit

    Bybit Rolls Out IPO Express with Automatic Execution for SpaceX Tokenized Shares

    Bybit users who subscribe to the exchange’s new IPO Express product and secure an allocation may find their orders executed automatically. If the final offering price of the tokenized shares lands within 20% of the indicative price agreed upon during subscription, the trade will proceed without requiring further user confirmation.

    Launched on June 7, IPO Express allows eligible Bybit users to subscribe to tokenized representations of initial public offering (IPO) shares at the offering price. SpaceX is the inaugural listing, available under the token ticker SPCX. Subscription windows are open until June 11, with spot trading slated to commence on June 12.

    Understanding the Token’s Value

    The IPO Express product is built on Payward Services’ xStocks platform. Payward, the parent company of Kraken, is also facilitating SpaceX IPO access for retail clients in over 110 countries via the same infrastructure. Each SPCX token is backed 1:1 by actual SpaceX equity held in regulated broker-dealer custody. This distinguishes it from synthetic pre-IPO perpetual contracts offered by platforms like Hyperliquid and Binance, where no underlying shares are exchanged.

    However, owning SPCX tokens does not confer shareholder status in SpaceX. According to Bybit’s terms, these tokens do not grant voting rights, dividend rights, or any direct legal or beneficial ownership of SpaceX equity. Holders have no claim against SpaceX itself. Their entitlement is limited to exposure to the economic performance of the share price.

    Access Restrictions

    Eligibility for IPO Express is subject to two main restrictions. Firstly, the product is exclusively available to Bybit users who have achieved VIP or PRO tier status, a designation typically based on trading volume or asset holdings, and who have completed identity verification. Secondly, the offering is completely unavailable to residents of the European Economic Area (EEA), which encompasses all 27 EU member states, along with Iceland, Liechtenstein, and Norway. Bybit has stated it does not hold the necessary licenses or authorizations under MiCA or any applicable EEA financial services regulations for this product.

    This exclusion is noteworthy, particularly as SpaceX’s IPO has already barred investors in mainland China and Hong Kong due to U.S. International Traffic in Arms Regulations. The tokenized access route, presented as an alternative, carries its own set of limitations. The significant demand for SpaceX’s IPO, reportedly around $150 billion against a $75 billion raise, means that even qualifying VIP-tier subscribers may only receive partial allocations.

    Funds submitted for subscription are frozen from the moment an order is placed until the results are announced, or for up to five business days if the event is canceled.

    Future Prospects for IPO Express

    Bybit has positioned IPO Express as a recurring platform rather than a one-off product. Reports suggest that future major IPOs, potentially including those of OpenAI and Anthropic, could see similar tokenized access products launched through Bybit, Kraken, and other platforms utilizing the xStocks infrastructure.

  • XRP Investors Capitulate Amidst Extreme Activity: Ripple’s Outlook

    XRP Network Activity Declines Sharply, Signaling Holder Pressure

    On-chain analytics firm Glassnode has reported a significant downturn in key metrics for the XRP network, indicating a weakening of activity and mounting pressure on token holders. Recent data reveals a substantial drop in both transaction demand and realized profitability, even as XRP trades well above its 2024 price levels.

    The decline in holder profitability is particularly stark when examining Glassnode’s latest realized profit-and-loss data. The firm’s analysis shows that the 90-day simple moving average of XRP’s Realized Profit-to-Loss Ratio has fallen to 0.38. This suggests that for every dollar lost by market participants on-chain, only 38 cents in profit are being realized.

    This profitability metric remains considerably below the breakeven level of 1.0, which serves as the dividing line between net profit-taking and net loss realization. During periods of strong bull market performance, this ratio typically surges well beyond 20 or even 50, as profitable sales dominate network activity.

    The current reading points to a vastly different market environment, where the realization of losses significantly outweighs the realization of profits. Glassnode observed that such low levels are often associated with capitulation periods, characterized by a large proportion of transacted coins belonging to holders exiting their positions at a loss.

    Broader network activity also shows signs of weakness. Glassnode reported a substantial decrease in the 90-day simple moving average of total transaction fees on the XRP Ledger. This figure has plummeted from 5,900 XRP in February 2025 to approximately 500 XRP today, representing a decline of over 91% during that timeframe.

    These recent figures echo concerns previously raised by Glassnode in late 2025 regarding the financial standing of XRP holders. In November of that year, the firm noted that only 58.5% of the circulating supply was in profit.

    These concerns were also evident in earlier market conditions. That percentage marked the lowest point recorded since November 2024, when XRP was trading around $0.53. At that time, approximately 41.5% of the supply, equivalent to about 26.5 billion XRP, was held at a loss, despite the token trading near $2.15.

    Collectively, the declining profitability metrics and reduced network activity suggest persistent stress within the XRP ecosystem. The data indicates that a significant portion of holders remain under pressure, while transaction demand continues to fall well short of previous cycle highs.

  • XRP Faces Selloff Threat

    XRP Faces Selloff Threat

    XRP Price Faces Downside Pressure, May Test Lower Levels

    The price of XRP has entered a corrective phase, trading below the $1.1840 mark and showing bearish signals that could lead to further declines below $1.10.

    The cryptocurrency’s downward correction began after it failed to sustain its position above the $1.1750 zone. XRP is currently trading below $1.150 and its 100-hour Simple Moving Average. A bearish trend line, which had provided support at $1.1620 on the hourly chart for the XRP/USD pair, has also been breached. Data from Kraken indicates that if XRP remains below $1.150, further downward movement is likely.

    XRP Price Dips Once Again

    XRP struggled to maintain its footing above the $1.1620 level, initiating a fresh decline that mirrored movements seen in Bitcoin and Ethereum. The price fell below both the $1.160 and $1.1550 thresholds. The hourly chart for the XRP/USD pair, sourced from Kraken, shows a break below a bullish trend line that had been established at $1.1620.

    Furthermore, XRP’s price dipped below the 38.2% Fibonacci retracement level of its prior upward move, which spanned from a swing low of $1.050 to a high of $1.1863. The cryptocurrency is now trading below $1.160 and its 100-hour Simple Moving Average.

    Should XRP attempt an upward recovery, it may encounter resistance around the $1.1350 level. The first significant resistance is situated near $1.1420; a sustained move above this point could propel the price to test the $1.150 level. A decisive break above the $1.150 resistance could then push XRP towards the $1.1580 resistance. Any further gains might see the price target the $1.1650 resistance. The next major obstacle for bullish sentiment is anticipated to be around the $1.1840 mark.

    More Downside Potential?

    If XRP is unable to overcome the $1.150 resistance zone, it could initiate another wave of decline. Initial support on the downside is observed near the $1.1020 level, which also corresponds to the 61.8% Fibonacci retracement level of the move from the $1.050 swing low to the $1.1863 high. The subsequent major support is located around the $1.1072 level. A breakdown below $1.1072, accompanied by a closing price below this level, could lead to further declines towards $1.1020. The next significant support is positioned near the $1.10 zone, below which XRP could continue its descent towards $1.080. Any additional losses might necessitate a retest of the $1.050 level.

    Technical Indicators

    The hourly MACD (Moving Average Convergence Divergence) for XRP/USD is currently gaining momentum within the bearish territory. The hourly RSI (Relative Strength Index) for XRP/USD has fallen below the 50 level.

    Major Support Levels: $1.1020 and $1.080
    Major Resistance Levels: $1.1500 and $1.1840

  • XRP Capitulates as Profit-to-Loss Ratio Plummets

    XRP Capitulates as Profit-to-Loss Ratio Plummets

    On-Chain Metrics Signal “Intense Capitulation” for XRP as Price Attempts Rebound

    Market intelligence platform Glassnode has highlighted concerning on-chain metrics for XRP, suggesting weakening momentum and widespread capitulation as the cryptocurrency attempts to recover from recent lows.

    Profit/Loss Ratio Hits Multi-Year Low

    On Tuesday, Glassnode researchers revealed that XRP’s 90-day moving average of its Realized Profit-to-Loss Ratio has fallen to 0.38, its lowest point since 2024. This indicates that for every dollar of losses realized in the market, only 38 cents in profit are being taken. This marks a stark reversal from a 2025 peak where the ratio reached 50, signifying that profit-takers significantly outnumbered those selling at a loss. Glassnode affirmed that such a low ratio is a “hallmark of intense capitulation,” suggesting most participants are exiting their positions at a loss.

    Network Activity Declines Sharply

    Further compounding the concerns, Glassnode pointed to a significant drop in network activity. The 90-day average of total transaction fees paid on the XRP network has plummeted by 91.5%, from 5,900 XRP in February 2025 to just 500 XRP. Glassnode stated this decline “reflects a near-total contraction in organic transaction demand on the network since the speculative peak,” rather than a simple fee market adjustment. The decrease in these indicators suggests a weakening of investor confidence and a subdued speculative appetite.

    Is XRP’s Bottom Near?

    Over the past two weeks, XRP’s price has declined by nearly 15%, reaching its lowest levels since November 2024. Analyst ChartNerd noted that while XRP’s bear markets have historically lasted between 400-790 days with drops of 85-96%, the current correction has lasted approximately 350 days with a 71% retracement from July highs. However, ChartNerd observed that the duration and depth of these bear markets are diminishing, suggesting that a historical bottom could be approaching by the end of the year.

    The cryptocurrency’s close below its 200-week Simple Moving Average (SMA) last week could also signal an impending bottom. Historically, a structural bottom has formed between 8 and 29 weeks after the first weekly close below this SMA, implying that XRP could begin forming its bottom in the coming months if past patterns repeat.

    Meanwhile, market watcher Ali Martinez suggested that XRP might be mirroring a pattern observed since 2018, potentially approaching its largest buying zone in eight years. Martinez highlighted that touches of a rising trendline have historically marked major turning points for XRP, sending it back towards the $3 resistance. With XRP currently approaching this trendline, support is identified between $0.70 and $0.90. A hold of this zone could make a rally back to $3 a “realistic scenario.” Should XRP break above the eight-year resistance around $3.30, Martinez concluded that the next macro target could be between $8 and $13.

  • Bitcoin Stablecoin Ratio Hits Record Low: Implications for BTC

    Bitcoin Stablecoin Ratio Hits Record Low: Implications for BTC

    Bitcoin Stablecoin Supply Ratio RSI Hits Multi-Year Low, Signaling Potential Buying Opportunity

    On-chain data reveals a significant drop in the Relative Strength Index (RSI) of the Bitcoin Stablecoin Supply Ratio (SSR) to a low of 13. This reading suggests a substantial amount of stablecoin liquidity is currently held on the sidelines relative to Bitcoin’s market capitalization.

    Analyst Highlights Trend in Bitcoin SSR RSI

    CryptoQuant analyst Maartunn recently discussed this notable trend in an X post, explaining the implications of the Bitcoin SSR RSI’s sharp decline. The SSR is an on-chain metric that compares the market capitalization of Bitcoin to the total valuation of all stablecoins.

    Stablecoins, digital assets designed to maintain a fixed price, typically pegged to fiat currencies, serve a distinct role in the cryptocurrency market compared to volatile assets like Bitcoin. Investors often park capital in stablecoins to avoid the price fluctuations inherent in other cryptocurrencies. Historically, these holders tend to re-enter the market for Bitcoin and other digital assets by exchanging their stablecoins. Consequently, stablecoins are frequently viewed as a measure of “dry powder” – capital poised for investment in the more volatile segments of the crypto market.

    The SSR, by tracking Bitcoin’s market cap against these stablecoin reserves, offers insight into the relative value of the leading cryptocurrency compared to this available capital. While the SSR itself is informative, its RSI is particularly relevant. The RSI, a momentum oscillator, measures the speed and magnitude of recent changes in the SSR.

    Indicator Enters “Undervalued” Zone

    A chart shared by Maartunn illustrates the trend in the Bitcoin SSR RSI over the past few years. The data indicates a significant recent drawdown, pushing the indicator into an “undervalued” zone. This suggests that the SSR has fallen to a level where a rebound may be probable.

    The current RSI value of 13 is notably low when compared to historical data. “There’s a lot of stablecoin liquidity sitting on the sidelines relative to Bitcoin’s market cap,” the analyst stated. This low point coincides with a steep bearish trajectory observed in Bitcoin and other digital assets. The market will now watch to see if investors begin to deploy this excess stablecoin capital to purchase assets at these lower prices, potentially contributing to market stabilization.

    Significant Portion of Bitcoin Supply Now Underwater

    In related news, the recent downturn in Bitcoin’s price has resulted in a substantial portion of its circulating supply falling into an unrealized loss. Maartunn also highlighted in a separate X post that 52% of Bitcoin’s circulating supply is currently trading below its acquisition cost.

    At the time of reporting, Bitcoin was trading around $62,700, marking a decline of nearly 10% over the past seven days.

  • XRP Tests Key Support Amidst Bull-Bear Showdown

    XRP Tests Key Support Amidst Bull-Bear Showdown

    XRP Tests Crucial Support Level, Signaling Potential Trend Shift

    XRP is currently testing a significant macroeconomic support level that could prove pivotal in determining its next market trend. With momentum hanging in the balance, a strong rebound could herald a recovery, while continued weakness might pave the way for further declines.

    XRP Finds Firm Ground at Critical 0.786 Fibonacci Support

    In a recent market assessment, cryptocurrency analyst CasiTrades observed that XRP has reached its key 0.786 macroeconomic support level, trading around $1.09 on Coinbase. The daily chart currently validates this support, as price action has so far respected this critical technical indicator.

    The immediate focus for traders now shifts to how the market responds to this positioning. CasiTrades has identified $1.19 and $1.27 as the primary resistance levels to watch. As long as XRP remains capped by these levels, the broader correction is expected to persist, leaving the possibility of a decline towards the $0.90 support zone, aligned with the 0.854 Fibonacci level.

    Conversely, a shift in market sentiment could invalidate the bearish outlook. If XRP demonstrates substantial buying pressure and manages to break through these established resistances, it would suggest the market is forming a new trend rather than consolidating for another downward movement.

    Ultimately, this moment represents one of the most critical junctures of the entire correction phase. With the major support level officially tested, the coming days will be essential in dictating the asset’s long-term trajectory.

    XRP Enters a Critical Macro Decision Zone

    According to market analyst EGRAG CRYPTO, XRP is presently situated within a crucial macroeconomic decision zone. The path forward is defined by specific technical thresholds that require sustained strength to confirm a trend.

    Specifically, a monthly candle close above $1.40 would indicate that the bottom was firmly established at $1.05. Reclaiming the $1.61–$1.65 range would signify the official commencement of a bullish recovery. A definitive break above $1.70 would offer even stronger confirmation of this momentum shift.

    If the price can successfully hold its ground, a double-bottom formation becomes a distinct possibility, setting the stage for a more robust rally. However, if XRP fails to maintain this support and loses its current momentum, the technical setup warns of a high likelihood of retesting the $0.80 level.

    While the potential for upside remains contingent on overcoming these key resistance hurdles, the downside risk persists if the current support falters. Traders are advised to remain cautious, as the resolution of this macroeconomic decision zone will determine whether the asset initiates a new bullish cycle or enters a deeper retracement.

  • House Committee Hearing Sees Pushback on Crypto Tax Bills

    House Committee Hearing Sees Pushback on Crypto Tax Bills

    House Crypto Tax Hearing Highlights Partisan Divide, Industry Urges Expansion

    A House hearing on six cryptocurrency tax bills on Tuesday revealed a significant lack of bipartisan consensus, with industry leaders advocating for broader legislation while Democrats expressed reservations about the pace of the process.

    Behind the scenes, the looming prospect of Democrats regaining control of the House in November’s midterm elections is a key factor. Republicans, seeking to advance their crypto agenda while they hold power in Congress and the White House, are pushing for swift passage of these bills. Democrats, conversely, are beginning to frame crypto legislation as an important but not necessarily immediate priority.

    “There is a sense of urgency, but there’s also a sense of, ‘are we acting too quick without knowing what we’re doing?’” Representative John Larson (D-CT) stated during the House Ways & Means Committee’s hearing. “There’s far more questions than there seem to be answers.”

    The committee’s top Democrat, Representative Richard Neal (D-MA), indicated to reporters that a bipartisan agreement on crypto tax policy is unlikely before the midterm elections, according to Punchbowl News. “I’m aligned with that goal—eventually,” Neal remarked at the hearing regarding his interest in passing bipartisan crypto tax legislation.

    A central point of contention between the parties emerged Tuesday concerning the tax treatment of cryptocurrency rewards generated through staking and mining. One of the six Republican-authored bills proposes exempting such rewards from an individual’s taxable income. Currently, staking rewards and newly mined crypto are considered income at the time of receipt, irrespective of whether they are subsequently sold or converted to fiat currency.

    Democrats, including those generally supportive of the crypto industry, voiced concerns that deferring taxes on these rewards could make digital assets more appealing than traditional investments like stocks and bonds, potentially leading to significant shifts in financial markets.

    “It seems to be a real sticking point in all this, and it seems that maybe we’re at an impasse,” Representative Mike Thompson (D-CA) commented on the tax policy surrounding crypto staking and mining. Thompson has previously voted in favor of both the stablecoin-focused GENIUS Act and the more comprehensive Clarity Act, which aims to formally legalize most cryptocurrency activities in the United States.

    Meanwhile, cryptocurrency executives who testified urged lawmakers to broaden certain provisions within the proposed legislation, particularly regarding de minimis exemptions for crypto payments. As currently drafted, one bill would establish a $10 de minimis tax exemption for crypto network transaction fees, commonly known as gas fees. It would also eliminate reporting requirements for stablecoin transactions, treating dollar-pegged tokens as equivalent to U.S. dollars for tax purposes.

    Lawrence Zlatkin, Coinbase’s vice president of tax, advocated for extending the de minimis exemption to encompass all digital assets. “A consumer who uses Bitcoin to buy a pair of jeans still has to calculate and report a capital gain,” Zlatkin argued. “That’s not good tax policy. Americans shouldn’t need an accountant to buy jeans.”

    With the Clarity Act facing a tight deadline in the Senate as the November midterms approach, crypto policy advocates had hoped that progress on crypto taxes could serve as a consolation prize if a broader market structure bill fails to pass before year’s end.

  • Treasury Stablecoin Plan Faces Stark Warning

    Treasury Stablecoin Plan Faces Stark Warning

    Stablecoin Rule Needs Refinement, Policy Center and VC Firm Argue

    The Hyperliquid Policy Center (HPC) and venture capital firm Paradigm have jointly submitted comments to the U.S. Treasury, calling for revisions to a proposed stablecoin compliance rule linked to the GENIUS Act. The rule aims to establish anti-money laundering (AML) and sanctions requirements for “permitted payment stablecoin issuers” (PPSIs), a category intended to foster innovation in payment stablecoins while managing illicit finance risks.

    Narrower Compliance, Less Burden

    While not opposing the framework’s overarching goals, Paradigm and HPC contend that critical aspects of the proposal require clearer definitions. They are particularly concerned that compliance obligations could inadvertently extend beyond the scope and intent of the GENIUS Act.

    A central point of contention is how PPSI duties should apply in the secondary market, where issuers lack direct relationships with counterparties. The firms argue that while Congress intended for PPSIs to conduct due diligence on their direct customers, it did not intend to mandate additional diligence for secondary market trading.

    Drawing an analogy to traditional banking, Paradigm and HPC stated that regulated institutions, after performing Know Your Customer (KYC) checks upon fund entry, are not expected to monitor every subsequent transaction after cash withdrawal. Similarly, they believe that decentralized peer-to-peer stablecoin transfers, and other digital assets, should primarily require KYC at regulated on-ramps and off-ramps, with compliance efforts focused where direct relationships exist.

    The organizations warned that an alternative approach could compel PPSIs to file a high volume of low-value suspicious activity reports (SARs). This, they cautioned, would generate “noisy” reports with false positives, increasing costs for both PPSIs and the Financial Crimes Enforcement Network (FinCEN) without clear public benefit.

    Hyperliquid Policy Center Urges Clarification

    The submitted comments also address the proposed rule’s definition and assignment of obligations related to “lawful orders.” Paradigm and HPC noted that the proposal defines “lawful order” by referencing the GENIUS Act’s definition of “person,” which in turn dictates who might be required to develop technological capabilities.

    They argued that the current draft could be interpreted too broadly, potentially encompassing developers of distributed ledger protocols, decentralized self-custodial interfaces, and other technologies that Congress explicitly excluded from the GENIUS Act’s definition of a “digital asset service provider.”

    The firms asserted that this outcome would contradict congressional intent and recommended a clarification in the final rule to explicitly exempt certain entities and technologies from lawful order requirements.

    Failing to provide such clarity, according to Paradigm and HPC, could unintentionally impose lawful order obligations on every validator on networks like Ethereum, Hyperliquid, Solana, and various Layer 2 systems that process transactions involving PPSI-issued stablecoins. They predicted that this could lead to U.S. validator stakes moving offshore, the relocation of U.S. blockbuilding operations, and a decline in the U.S. share of the validator base, undermining both the GENIUS Act’s onshoring objectives and broader U.S. interests.

  • Sahara AI Denies Security Flaws Amid 60% Token Price Plunge

    Sahara AI Denies Security Flaws Amid 60% Token Price Plunge

    Sahara AI’s SAHARA token experienced a dramatic plunge of approximately 60% on June 9, leading to over $23 million in liquidations. The sharp decline fueled speculation across cryptocurrency markets, particularly as it coincided with a reported breach at the protocol Humanity, which resulted in a $30 million loss and saw its native H token shed nearly 90% of its value.

    Volatility and Initial Response

    Following the sudden drop of SAHARA from around $0.034 to $0.014, according to CoinGecko data, the Sahara AI team issued a statement on X (formerly Twitter). They acknowledged “unusual market volatility” and asserted that no security vulnerabilities had been identified within the platform’s token contracts or products. The team also committed to providing further updates as their internal investigation progressed and more information became available.

    Addressing On-Chain Concerns

    However, the initial explanation faced scrutiny when on-chain observers raised questions about a transfer of 600 million SAHARA tokens, suggesting it might have been the catalyst for the price anomaly. In response, the team released a follow-up post clarifying that the substantial token transfer was a pre-arranged operation to fund a Chainlink CCIP bridge contract, intended to bolster liquidity for their recently launched cross-chain bridge.

    Crucially, Sahara AI emphasized that neither team nor investor wallets had been accessed on-chain, stating unequivocally that “no team and investor tokens have been sold or moved.” To support their claims, the team provided a link to an Etherscan address, inviting interested parties to verify the accuracy of their statements. They reiterated that their investigation into the root cause of the market movement was ongoing and separate from the bridge transfer.

    Community Scrutiny and Market Impact

    The validity of this explanation remains a point of contention within the community. Data from CoinGlass indicates that over the preceding 12 hours, long positions worth $22.9 million were liquidated, contrasted with only $354,000 in short positions. This suggests that the overwhelming majority of losses were borne by traders who had bet on an upward price trajectory.

    The SAHARA token, which was listed on Binance in June 2025 and subsequently reached an all-time high of $0.1605 the following month, was trading at the time of writing nearly 90% below its peak. It had also seen declines of over 50% in the past seven days and almost 54% over the last month.

    This recent downturn follows a pattern of significant price drops for other tokens. Just a week prior, EDGE, the native token of the edgeX decentralized exchange, plummeted by 71% to a new all-time low. Similar to the Sahara AI team, the edgeX developers denied any security breaches, attributing the collapse to external manipulation. However, this claim was publicly disputed by on-chain investigator ZachXBT. In a subsequent report, edgeX acknowledged that some centralized exchanges listing EDGE cited thin liquidity conditions, rather than large-scale selling by the team, as a contributing factor to the token’s collapse.