Tag: Market Trends

  • Gemini AI Forecasts Grim Bitcoin Outlook for 2026

    Gemini AI Forecasts Grim Bitcoin Outlook for 2026

    Google Gemini AI Offers Measured Bitcoin Outlook for 2026

    Google’s Gemini AI has presented a forecast for Bitcoin’s price that, while not reaching the speculative highs some anticipate, offers a grounded perspective on the cryptocurrency’s potential trajectory. The AI’s bull case for Bitcoin by late 2026 projects a price range of $92,000 to $98,000, a ceiling that stops just short of six figures.

    This prediction stands in contrast to Bitcoin’s previous peak of $126,000 within the current cycle. For investors who have become accustomed to more aggressive price targets, the prospect of Bitcoin essentially returning to levels seen six months prior may not be the headline-grabbing news they hoped for.

    However, this measured approach is precisely what lends credibility to Gemini’s prediction. The AI appears to be modeling a more mature Bitcoin market, one influenced by the integration of traditional finance and characterized by a more stable structure that prioritizes institutional flows over extreme speculative surges.

    The anticipated post-halving supply reduction and ongoing corporate dollar-cost averaging into spot ETFs are recognized as significant upward price drivers. Yet, Gemini identifies persistent macroeconomic headwinds as a limiting factor, preventing Bitcoin from surpassing the $100,000 mark within this timeframe. This outlook represents a sophisticated market assessment rather than a speculative “moonshot,” which may prove unsettling for those who have invested based on a $100,000 price narrative.

    Bearish Scenario and Current Market Dynamics

    The AI’s bear case forecasts a price range of $48,000 to $54,000. This scenario is predicated on a potential slowdown in institutional inflows, stricter global regulations on stablecoins, and broader liquidity contractions if the Federal Reserve maintains higher interest rates for an extended period. Such a decline, while not unprecedented in Bitcoin’s history, would represent a significant frustration for those anticipating new all-time highs.

    Currently, Bitcoin is trading around $66,518, positioned at a critical historical juncture. The broader chart reveals a narrative of a 2024 breakout, a run to $126,000, a subsequent correction, a stalled recovery in March around $82,000, and a recent dip to $60,000 before the current rebound.

    The cryptocurrency has now re-entered the $65,000 to $68,000 zone, a level that previously served as a key breakout point in 2024. The immediate technical question revolves around whether this zone will hold as support or act as a liquidity trap.

    The $70,000 to $72,000 level presents the next significant hurdle, marking the point of a May breakdown and a concentration of trapped supply. A decisive move above this range on substantial volume could significantly alter the market sentiment, potentially opening pathways toward $80,000 and ultimately the $92,000 to $98,000 target range identified by Gemini. Conversely, a daily close below $62,000 could re-establish a downward trajectory toward $54,000, the upper limit of the bear case.

    Technical Indicators and Future Outlook

    The Relative Strength Index (RSI) offers a nuanced perspective. Currently at 44.75, with its signal line at 28.73, the significant gap between them suggests a divergence. This indicates that while momentum experienced a sharp decline to oversold levels during the recent price flush, it has since recovered towards neutral territory, while price action is still consolidating. An RSI leading price in recovery is often viewed as a more robust signal, potentially preceding sustained upward movements rather than temporary bull traps.

    While this does not guarantee Gemini’s bull case will materialize, it does suggest that the $60,000 low is more likely to represent a floor than a stepping stone to lower prices. The initial provocative headline urged caution, but the technical indicators suggest that the market’s lowest point may already be in the rearview mirror.

    Strategic Shifts in the Crypto Landscape

    A discernible rotation is underway within the cryptocurrency market, though its significance may only become apparent in hindsight. Large-cap cryptocurrencies like Bitcoin, Ethereum, and XRP are encountering resistance, with their upside potential increasingly dependent on external catalysts that remain uncertain.

    The delay in anticipated macroeconomic tailwinds and the postponement of institutional inflows suggest that holding these established assets may become a passive waiting game. Investors who have navigated multiple market cycles often prioritize proactive capital deployment over waiting for clear signals.

    Early-stage infrastructure projects, operating with significantly smaller market capitalizations, offer a different dynamic. Modest capital rotations can lead to substantial price movements, driven by the asymmetry between current valuations and the future potential of nascent technologies.

    The fragmentation of liquidity across different blockchain ecosystems, such as Bitcoin, Ethereum, and Solana, incurs significant costs for decentralized finance (DeFi) users through fees, slippage, and failed transactions. Projects aiming to unify these disparate liquidity pools, like LiquidChain, which proposes a single execution layer for multiple networks, address this fundamental inefficiency.

    The market has yet to fully price in the potential of such solutions. LiquidChain’s presale, currently at $0.01454 with over $840,000 raised, represents an early-stage opportunity. While the risks associated with unproven execution and uncertain adoption are present, this offers a chance to invest at the foundational level of a project with the potential to reshape cross-chain interactions. This contrasts with established assets, which, while offering a more predictable path, may have already reached their visible ceilings.

  • BlackRock Launches Bitcoin ETF, Offers Yield for Capped Gains

    BlackRock Launches Bitcoin ETF, Offers Yield for Capped Gains

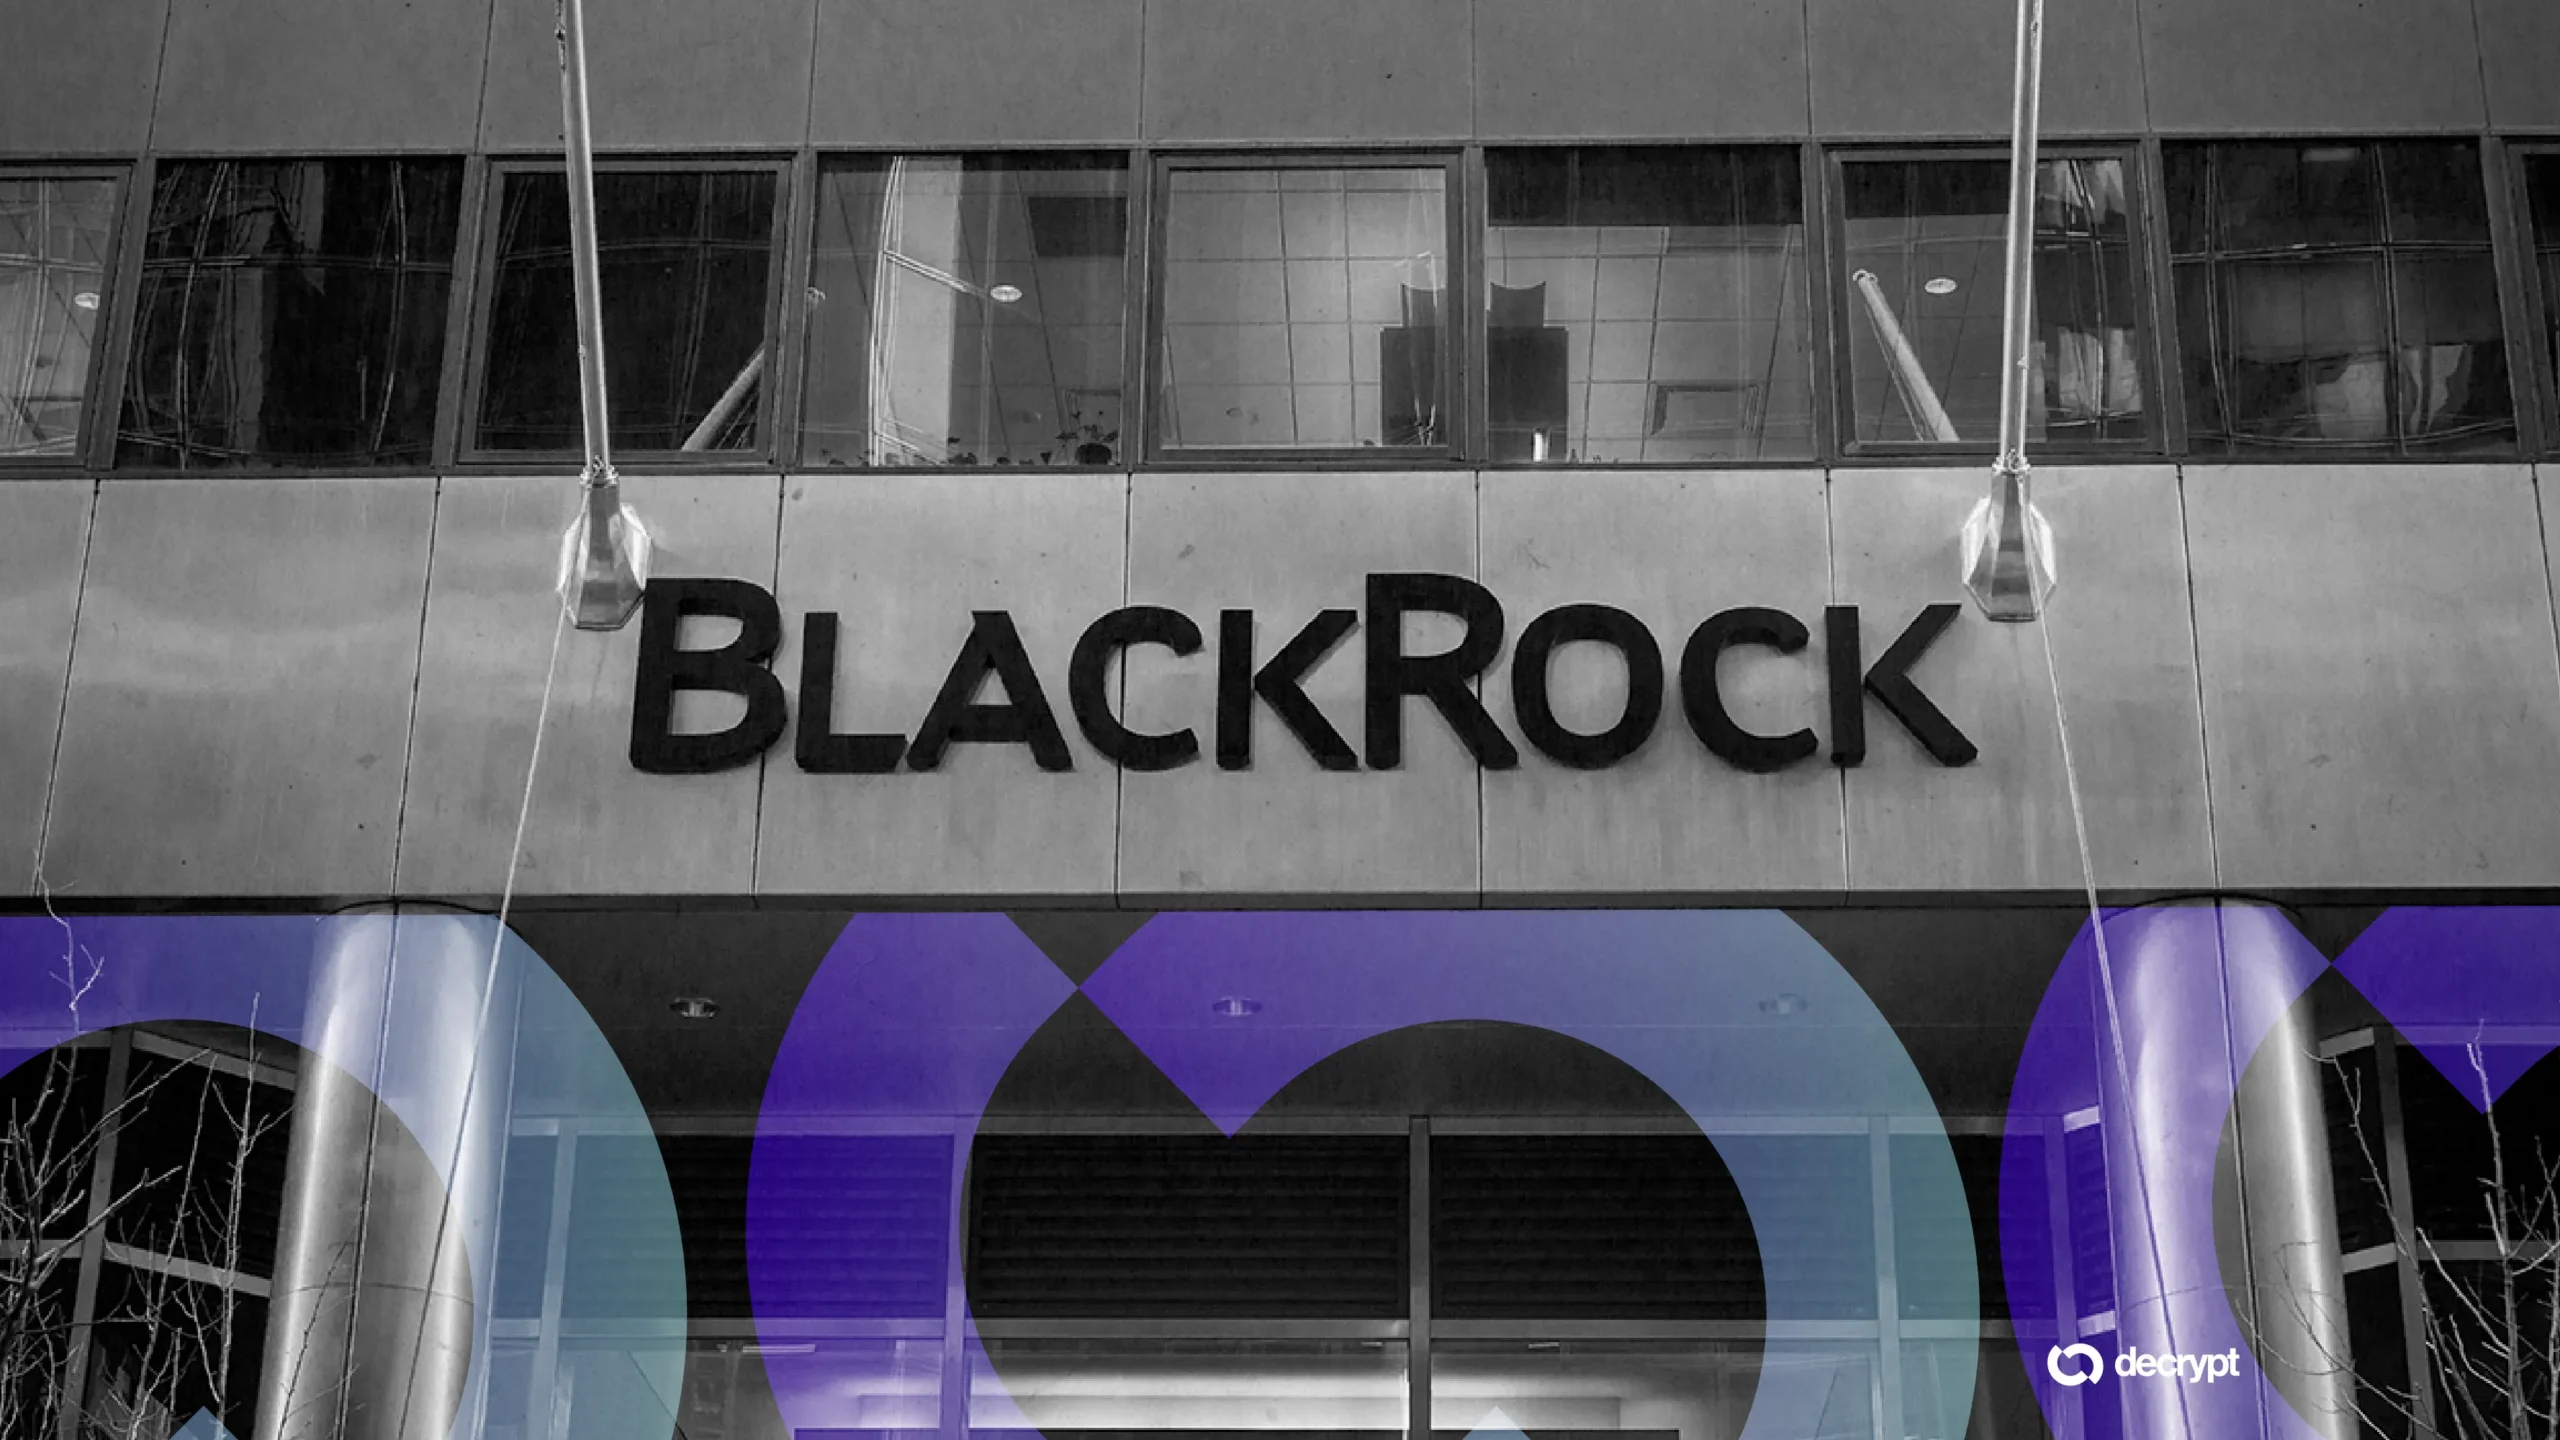
    BlackRock is launching a new exchange-traded fund that aims to offer investors exposure to Bitcoin’s potential gains while also providing double-digit payouts, the financial giant announced Tuesday.

    New ETF Offers Hybrid Bitcoin Exposure

    The iShares Bitcoin Premium Income ETF, set to trade on the Nasdaq under the ticker BITA, is designed to allow investors to participate in Bitcoin’s upside while generating monthly income from options premiums, according to a BlackRock press release. The fund will hold a mix of actual Bitcoin and BlackRock’s iShares Bitcoin Trust ETF (IBIT) to track the digital asset’s market price. To generate cash for monthly distributions, the fund will sell options contracts on up to 35% of its portfolio.

    Robert Mitchnick, BlackRock’s head of digital assets, described the ETF in an interview with Decrypt as a “hybrid Bitcoin exposure product” that offers a distinct payoff and yield profile compared to the firm’s existing $48.6 billion IBIT.

    “The way the math works today, you can think of it as 70% upside retention in IBIT and a mid-to-high-teens yield,” Mitchnick explained. “We believe it will be quite compelling to many investors.”

    Generating Yield Through Options

    The ETF generates its payout by selling call options on a portion of its holdings each month. These options grant buyers the right to purchase the fund’s IBIT shares at a predetermined price if the market rises, in exchange for an upfront fee known as a premium.

    Given Bitcoin’s historically high volatility, these premiums are typically substantial, enabling the ETF to generate consistent income. BlackRock stated this income will be distributed to investors under a “favorable blended tax treatment” on gains realized from option premiums.

    Mitchnick suggested that the ETF’s yield component and its relatively conservative approach could make it more attractive to financial advisors and other institutional investors who may not yet have exposure to digital assets, compared to IBIT.

    “There’s no question that one of the challenges they’ve had in embracing Bitcoin in the past has been the absence of yield,” he noted, citing insurers and pension funds as examples.

    Competitive Landscape

    BlackRock filed for BITA in January. The product is poised to compete with the NEOS Bitcoin High Income ETF, which debuted in 2024 and carries a higher expense ratio. In April, Goldman Sachs also filed for a similar yield-generating product.

    While BlackRock has introduced several ETFs tracking Ethereum’s spot price, Mitchnick indicated the firm has no immediate plans for similar products for that asset, as one of its existing offerings already provides yield-like payouts through staking.

    “As successful as our Ethereum products have been, Bitcoin is on a completely different level,” he added. “There’s significantly more client demand, so the opportunity to build adjacent products on Bitcoin is greater than for any other crypto asset.”

  • Hyperliquid ETFs Attract $172M as HYPE Reaches Record High

    Hyperliquid ETFs Attract $172M as HYPE Reaches Record High

    Hyperliquid ETFs Outperform Bitcoin Amid Shifting Investor Sentiment

    Hyperliquid Exchange Traded Funds (ETFs) are experiencing a significant surge, starkly defying recent macroeconomic challenges and a broader cooling in the cryptocurrency market during the second quarter.

    The protocol’s native token, HYPE, has mirrored this momentum, climbing over 73% in the past month and an impressive 196% year-to-date, reaching an all-time high of $75.96 on Tuesday, according to CoinGecko data.

    Institutional fund flows further underscore this trend. Three newly launched Hyperliquid ETFs have collectively attracted nearly $172 million in net inflows since their debut in May. This stands in contrast to Bitcoin ETFs, which have seen outflows of almost $5.6 billion over the same period, as reported by SoSoValue.

    This divergence suggests a growing institutional appetite for the protocol’s fee-generating architecture and its underlying token, moving away from narrative-driven, speculative, and non-yielding altcoins.

    Bitwise’s BHYP is leading the HYPE ETF market, boasting approximately $107 million in cumulative net inflows and $122.8 million in net assets. It is followed by 21Shares’ THYP with $60 million and Grayscale’s HYPG with $8.6 million. The combined trading volume across these three products has approached $900 million.

    Unlike Bitcoin ETFs, which are largely influenced by macroeconomic factors and have experienced capital outflows amid geopolitical uncertainty and rising Treasury yields, HYPE ETF inflows reflect a conviction in a protocol that generates tangible, measurable fees, Jeff Mei, COO of BTSE, told Decrypt.

    “HYPE’s resilience indicates that the market is beginning to price in protocol fundamentals,” Mei stated. “The Assistance Fund burn creates supply pressure, and Coinbase’s $5 billion USDC program injects sustained liquidity that compounds Hyperliquid’s competitive moat.”

    The divergence is also attributed to Hyperliquid’s “shift toward diversifying revenue streams,” as noted in a May 14 report by 21Shares. The report highlighted the protocol’s ability to generate fees from sources beyond crypto perpetuals, including commodities, equities, and pre-IPO markets.

    The pre-market pricing of CBRS perpetuals before an initial public offering (IPO) captured Wall Street’s attention by accurately mirroring its eventual NASDAQ opening price within 1.3%. The platform’s SpaceX IPO further solidified its value proposition.

    SpaceX’s SPCX perpetual, launched by TradeXYZ through the platform’s permissionless HIP-3 framework, generated approximately $1.4 billion in volume in a single trading session, according to data from hl.eco. This contract accounted for roughly 30% of all HIP-3 volume on that day.

    “Investors can actually see the [Hyperliquid] protocol capturing market share and generating meaningful fees, which makes the value proposition very different,” Sammi Li, CEO of Ju.com, told Decrypt.

    Two key structural features are reinforcing this institutional thesis.

    Firstly, the protocol’s core Assistance Fund (AF) mechanism automatically directs between 97% and 99% of Hyperliquid’s trading fees into token buybacks. This creates an immediate, non-speculative link between daily trading volume and demand for the native asset.

    Secondly, Hyperliquid’s multi-billion-dollar stablecoin layer has undergone structural evolution. This includes Coinbase, which serves as the official treasury deployer for the platform’s existing USDC reserves. The recently activated AQAv2 program allows $5 billion in USDC to earn a 4% yield, with 90% of this yield being redirected to the AF. This process enhances the protocol’s liquidity advantage and, consequently, fuels the token buyback mechanism.

    Li concurred, adding that Hyperliquid is not solely reliant on a bull market. “In fact, volatile markets often create more trading opportunities,” she observed. “When traders are actively hedging and repositioning, volumes stay strong, and that’s ultimately what drives protocol revenues. The market seems to be recognizing that.”

    Li emphasized that the most critical metric for Hyperliquid’s future is not its price but its ability to continue attracting users, liquidity, and trading volume. “If Hyperliquid continues executing at its current pace and keeps gaining share in the derivatives market, I wouldn’t be surprised to see institutional interest continue growing,” she said.

    For the present, the data and fundamental analysis favor Hyperliquid. In a month where Bitcoin ETFs have seen billions in outflows, HYPE ETFs have attracted $172 million, and this divergence shows no immediate signs of abating.

    Options markets suggest a 10-15% probability of HYPE reaching $100 by the end of July, according to a tweet on Monday from Nick Forster, co-founder and CEO of on-chain options platform Derive.

  • XRP Breakout Hinges on Key Level: Analyst

    XRP Breakout Hinges on Key Level: Analyst

    XRP Surges Amid Market Rally, But Analyst Cautions on True Breakout

    The cryptocurrency market experienced a broad upturn, largely attributed to news of a permanent deal between the United States and Iran. Within this positive environment, Ripple’s XRP token emerged as a standout performer among larger-cap cryptocurrencies, climbing from $1.05 at the beginning of the month to nearly $1.30 yesterday.

    However, the token’s upward momentum has since stalled, with its current price hovering just below $1.25. EGRAG CRYPTO, a prominent analyst closely monitoring XRP’s price action, suggests that a definitive breakout confirmation remains some distance away.

    In a recent post on X, the analyst highlighted that the recent wick from multi-year lows was not a random occurrence. Nevertheless, they observed that sellers quickly reappeared at the critical $1.30 resistance level, while buyers emerged to support the price just above $1.00. Currently, XRP is trading within this range, and its future price trajectory hinges on several key levels.

    According to EGRAG CRYPTO, these crucial levels are:

    • $1.11: Survival Zone
    • $1.21: First Strength
    • $1.28: Structure Improves
    • $1.35–$1.38: Bulls Gaining Control
    • $1.51: Major Breakout Zone

    The analysis indicates that XRP has successfully surpassed the “First Strength” area, trading above $1.21. However, achieving a confirmed breakout necessitates reclaiming several other significant resistance zones. The ultimate challenge, termed the ‘final boss’ by the analyst, lies at $1.51. XRP has tested this level multiple times between February and mid-May, only to be met with rejection and subsequent price declines.

    Earlier reports from CryptoPotato noted an improvement in the overall market sentiment surrounding XRP in recent days, following a dip to multi-month lows. Analysts at Santiment Intelligence have frequently pointed out that such significant declines in market sentiment often precede market reversals, a pattern that appears to be repeating.

    A contributing factor to XRP’s recent resurgence is the inflow into spot Ripple ETFs. In contrast to many other cryptocurrency-focused exchange-traded funds, those tracking XRP have seen another positive week, with Monday also marking a minor gain.

    Furthermore, the company behind XRP continues to generate news. Yesterday, Gate.io announced the listing of Ripple’s stablecoin and introduced a trading pair against XRP, marking the latest adoption development.

  • Pi Network Price Forecast: June 16

    Pi Network Price Forecast: June 16

    PI Reclaims $0.13 as Buyers Emerge, Signaling Potential Upside

    Key Support: $0.13
    Key Resistance: $0.16, $0.20

    Pi Network’s native token, PI, has shown signs of recovery, reclaiming the $0.13 level and holding steady above it. This resurgence, driven by renewed buyer interest, suggests a potential shift from its recent downtrend. Analysts are closely watching the $0.13 mark as a critical support level, with the price action leaning bullish as long as it remains above this threshold.

    Bullish Divergence Signals Potential Trend Reversal

    Despite the price reaching a lower low, the daily Relative Strength Index (RSI) has printed a higher low. This bullish divergence is a significant indicator, hinting at a possible conclusion to the prevailing downtrend. For this bullish sentiment to solidify, PI will need to overcome immediate resistance at $0.16, followed by a more substantial hurdle at $0.20.

    Low Volume Presents a Cautionary Note

    While PI is gradually moving upward, trading volume has remained subdued and is currently declining. This lack of robust buying activity could make the current gains vulnerable. A significant push from sellers could easily negate the recent upward momentum, leaving buyers exposed.

    The Importance of Volume Confirmation

    Ideally, any sustained price increase should be accompanied by a corresponding rise in buying volume. Without this confirmation, the current rally risks becoming a “bull trap,” where early buyers find themselves caught as sellers reassert control.

    Momentum Indicators Point to Upward Bias

    Momentum indicators, including the daily Moving Average Convergence Divergence (MACD), are currently displaying a clear bullish bias. This positive outlook has been in effect since PI successfully reclaimed and sustained the $0.13 level. The prevailing sentiment suggests that the price is likely to continue its ascent, at least towards the initial resistance level of $0.16.

    The Road Ahead: Resistance and Potential Reversal

    The critical question for investors is whether buyers can muster sufficient strength and volume to break through the $0.16 resistance. A failure to do so could embolden sellers, potentially leading to a swift decline back to the $0.13 support level.

  • Hyperliquid Surges on ETF Inflows and SpaceX Support

    Hyperliquid Surges on ETF Inflows and SpaceX Support

    HYPE Price Surges Amidst ETF Inflows and SpaceX Perpetual Trading Boom

    Hyperliquid’s native cryptocurrency, HYPE, is experiencing a significant surge today, with double-digit gains as trading activity intensifies across various market segments.

    At the time of reporting, HYPE is trading near $72, approaching its all-time high. This represents a roughly 10% increase over the past 24 hours, positioning it as one of the top-performing digital assets in that period. The upward momentum is attributed to increased buying in exchange-traded funds (ETFs) and renewed interest in Hyperliquid’s ecosystem, bolstered by the success of its SpaceX perpetual futures trading.

    Data from SoSoValue indicates that regulated products associated with HYPE are becoming a substantial component of the token’s market structure. The three ETFs currently available, managed by Bitwise, 21Shares, and Grayscale, collectively hold approximately $209 million worth of HYPE, representing about 1.4% of its total market capitalization.

    During this recent rally, net inflows into these ETFs over the last 24 hours have exceeded $17 million, bringing the cumulative total to $171 million. This suggests a robust and sustained interest in Hyperliquid’s underlying cryptocurrency.

    In contrast, Bitcoin ETFs have seen outflows of around $64 million, indicating a potential shift in investor appetite towards altcoins. This trend is further supported by positive flows into Ethereum, Solana, and XRP ETFs.

    Another significant factor driving HYPE’s performance is Hyperliquid’s expanding presence in non-cryptocurrency markets, facilitated by HIP-3.

    The chart below illustrates that the SpaceX-linked perpetual contract (SPCX-USDC) has recorded over $1.12 billion in trading volume in the past 24 hours. Open interest is nearing $300 million, with the contract trading around $212.

    This development follows broader market attention on perpetuals linked to SpaceX. Notably, following its initial launch, SPCX quickly became the most actively traded asset on the platform, with trading volumes surpassing $1.3 billion.

    This success underscores Hyperliquid’s capability to facilitate liquid markets for assets beyond traditional cryptocurrency pairs. The exchange has previously demonstrated this with commodities like gold and oil, establishing itself as a preferred venue for trading oil using cryptocurrency.

  • XRP Recovers Sharply After Sentiment Plunge

    XRP Recovers Sharply After Sentiment Plunge

    XRP Stages ‘Impressive Comeback’ After Sentiment Slump

    XRP has “staged an impressive comeback,” according to on-chain analytics firm Santiment, which reported Monday that the token surged more than 13% in a 24-hour period, reclaiming the $1.28 level for the first time in two weeks.

    Traders have reportedly reacted positively to news suggesting a resolution to the US-Iran conflict, which had been a “major source of uncertainty that had pressured risk assets.”

    XRP has experienced a challenging year, falling over 50% from its January peak of more than $2.30 to a low of $1.10 on June 11, before beginning its recovery. Santiment noted that this rebound is particularly significant as it occurred after sentiment had dipped to some of its lowest levels of 2026, “creating the conditions for a powerful relief rally once fear began to fade.”

    The firm frequently observes that periods of maximum fear and doubt can precede relief rallies, as markets often move contrary to prevailing crowd expectations. XRP has also benefited from strong support among its largest holders, with “whales” dominating the ecosystem. On-chain data from Santiment indicates that wallets holding at least 1 million XRP now control over 74% of the total supply, having accumulated an additional 1.53 billion tokens in the past six months.

    Analyst CasiTrades pointed out that the $1.30 level represents a significant resistance point, and there remains a possibility that XRP could fail to break through and retreat to support at $0.90. However, she also commented that the recent bounce has been stronger than anticipated. “If this momentum continues, we may be looking at the early stages of a new trend rather than a final move lower,” she stated, adding, “What I’m seeing right now is strength. Potentially the strongest we’ve seen in months! It still needs confirmation, but it’s exciting to finally see some life in this market!”

    XRP Tests Major Resistance at $1.30

    The cryptocurrency market is currently experiencing notable momentum, with XRP’s price approaching a critical resistance level around $1.30.

    Other Cryptocurrencies Outperform XRP

    While XRP’s 13% recovery bounce is considered impressive, other digital assets have seen even greater gains. Zcash, for instance, has surged nearly 30% in recent days, reaching $535 on Monday, its highest point since a significant decline on June 4. This surge followed a security audit by Anthropic’s Claude Mythos, which reportedly found no serious vulnerabilities in the Zcash protocol.

    Bittensor’s TAO token has also experienced a substantial increase, skyrocketing more than 30% in recent days to reach $285. This upward movement has been attributed to the US blockade of Anthropic’s flagship Fable 5 and Mythos 5 models, which has reportedly spurred increased interest and investment in decentralized artificial intelligence solutions.

  • Spain’s World Cup Upset Costs Investor $1 Million

    Spain’s World Cup Upset Costs Investor $1 Million

    A colossal wager on Spain to win its World Cup opener against debutants Cape Verde has spectacularly backfired, leaving one bettor with a seven-figure loss and igniting a firestorm of online commentary.

    A Million-Dollar Gamble Goes Awry

    The bet, placed on the prediction market platform Polymarket, saw an individual stake $1 million on Spain to secure victory. The odds, as reflected by the market, suggested a near certainty, with a draw priced at a mere 6.6 cents. The logic appeared sound: Spain, the reigning European champions, boasted an impressive 30-match unbeaten streak and were facing Cape Verde, an Atlantic island nation ranked 67th by FIFA and making its maiden World Cup appearance.

    However, the match, held at Mercedes-Benz Stadium in Atlanta, concluded with a stunning 0-0 draw, rendering the bettor’s substantial investment worthless. The potential payout of $1,085,943.48 evaporated over 90 minutes of play against a team that, according to Polymarket’s own pre-match assessment, had less than a 1% chance of winning the entire tournament.

    Goalkeeper’s Heroics Deny Favorite

    Cape Verde’s 40-year-old goalkeeper, Josimar Évora, widely known as “Vozinha,” emerged as the unlikely hero of the week, making a remarkable eight saves. He thwarted efforts from Ferran Torres and denied a header from Mikel Oyarzabal. Spain’s best opportunity, described by ESPN, saw Torres strike the crossbar, while star player Lamine Yamal was unable to impose his dominance.

    The improbable scoreline immediately drew comparisons to some of the greatest upsets in World Cup history. While Cape Verde had navigated African qualifying with a strong record, nothing in their prior results foreshadowed their ability to neutralize a Spanish side that had recently defeated formidable opponents like England, France, and Germany.

    The Counter-Bet That Paid Off

    The aftermath saw a deluge of memes and GIFs flood social media platform X, with jokes about the “surest bet in sports” taking center stage. A visual representation of Spain’s 27 shots to Cape Verde’s six became a poignant symbol of the failed wager.

    On the other side of this high-stakes trade was a Polymarket user operating under the handle “Fishalive.” This trader, who reportedly joined the platform in June 2026, had made just two prior predictions. “Fishalive” purchased “No” shares on Spain winning at an average price of 9 cents per share, effectively betting that Spain had roughly a 9% chance of victory, a stark contrast to the market’s 92% pricing.

    The user acquired over 4.7 million shares at this price. When the final whistle confirmed the 0-0 draw, these “No” shares resolved at 100 cents each, catapulting the position’s value to $4,738,433.49. This resulted in a profit of $4,310,481.12, a staggering return of over 1,000%.

    Prediction Markets: Edge or Luck?

    This outcome highlights the mechanics of prediction markets: an individual identifies a scenario dismissed by the majority, places a significant bet, and reaps the rewards when their prediction materializes. The perennial question remains whether such successes stem from superior insight or sheer luck.

    While the $1 million Spain bet is dramatic, it is not the first instance of Polymarket serving as a cautionary tale for betting at extreme odds. Traders who buy “Yes” at 90 cents or higher are essentially asserting that the true probability exceeds that figure. When reality diverges, the financial consequences can be severe.

    The platform has seen other significant losses. A trader known as “beachboy4” reportedly lost over $2 million in 35 days, with a single $1.58 million position on Liverpool to win against Leeds United on January 1, 2026, being a major contributor. Another trader, “bossoskil1,” lost $2.36 million in just eight days across 53 U.S. sports markets without employing hedging or stop-loss strategies.

    Regulatory Scrutiny and Market Trends

    A Bloomberg analysis from April 2026 revealed that since January 2025, over 100,000 Polymarket accounts had incurred losses of at least $1,000, nearly double the number of wallets posting comparable gains. Furthermore, an academic study by the University of Toronto, examining 2.4 million users, found that 68.8% had lost money since 2022, with those experiencing losses disproportionately trading at extreme prices—below 10 cents or above 90 cents.

    Meanwhile, the 2026 World Cup winner market across Kalshi and Polymarket has surpassed $2.34 billion in volume. Regulators are taking notice, with states like Tennessee issuing cease-and-desist letters to both platforms concerning sports prediction markets. Despite this scrutiny, traders continue to place bets. While the majority of participants in the Spain-Cape Verde market are likely facing financial setbacks, “Fishalive” is undoubtedly enjoying a highly profitable Monday.

    Cape Verde is scheduled to face Uruguay next on June 21.

  • XRP Surges Past $1.30 on Major Adoption News

    XRP Surges Past $1.30 on Major Adoption News

    Ripple’s cross-border token, XRP, has seen a significant price surge, reaching nearly $1.30 in recent hours. This bullish momentum follows a series of positive developments, including a major cryptocurrency exchange listing Ripple’s stablecoin, RLUSD, and introducing a trading pair with XRP.

    Exchange Listing Boosts XRP

    Gate.io, a prominent cryptocurrency exchange, has added RLUSD to its platform, alongside a spot trading pair for XRP/RLUSD. This move is expected to enhance interoperability and capital efficiency within digital asset markets globally. Ripple announced the listing on its official Twitter account, stating, “$RLUSD is now live on @Gate_io. $XRP / $RLUSD spot trading pairs are available today, unlocking real interoperability and capital efficiency for digital asset markets worldwide.”

    Market Factors Driving XRP’s Rise

    CryptoPotato identified several factors contributing to XRP’s recent market performance. These include a broader market-wide revival, a new deal between the U.S. and Iran announced by President Donald Trump, and significant shifts in exchange deposits, with South Korea emerging as a key player. Continuous net inflows into spot XRP Exchange-Traded Funds (ETFs) have also played a role.

    Analyst Sentiment and Holder Accumulation

    Analytics firm Santiment noted that XRP’s surge occurred after its sentiment had dipped to multi-month lows, a pattern often indicative of strong trend reversal opportunities. The firm also highlighted the continued support from XRP’s largest holders. On-chain data reveals that wallets holding at least 1 million XRP now control 74.1% of the total supply and have acquired an additional 1.53 billion coins in the past six months.

    Santiment’s analysis further points to Ripple’s expanding institutional payment network and growing tokenization initiatives on the XRP Ledger as key drivers of long-term confidence, even amidst previous price weakness. The firm concluded that when these factors converge, price recoveries tend to be swift and substantial.

  • Ripple Surges 10% as Crypto Market Cap Nears $2.4T

    Ripple Surges 10% as Crypto Market Cap Nears $2.4T

    XRP Price Surges 10% Amidst Growing Market Optimism

    XRP is experiencing a significant price movement, bolstered by predictive indicators and increased trading volume. The cryptocurrency has climbed 10% in the last 24 hours, breaking through several resistance levels that had previously capped its ascent for weeks. This surge coincides with a broader cryptocurrency market rally, pushing the total market capitalization towards $2.4 trillion in what appears to be a risk-on environment.

    The formation of a bullish pattern on XRP’s chart suggests that previously ambitious upside targets may now be within reach.

    Breakout Driven by Concentrated Demand

    The recent breakout was notably strong, with XRP advancing from $1.14 to $1.24. Trading volume spiked to 107.6 million XRP at 21:00 UTC, marking the highest volume since a significant sell-off in early June. Data indicates that South Korea’s Upbit exchange played a crucial role in this initial thrust, accounting for 31% of XRP’s wallet flow dominance by June 14, a sharp increase from 13% the week prior, highlighting concentrated Asian demand.

    ETF Inflows and Sustained Volume

    Concurrently, cumulative net inflows into XRP Exchange Traded Products (ETPs) have reached approximately $1.4 billion since their inception. The key question remains whether XRP can sustain this trading volume and if price predictions are shifting towards a more bullish outlook.

    XRP is currently trading around $1.24, reflecting its 10% daily gain. Intraday highs during the latest surge reached the $1.25 range. This upward movement above previous resistance levels is characteristic of a market that was previously underpositioned on the long side. Traders attempting to short the rally appear to have been caught in a squeeze, which further accelerated the price increase.

    Technical Analysis and Future Targets

    From a technical standpoint, a significant structural shift occurred when XRP decisively cleared the $1.2 mark on substantial volume. This confirmed a bull-flag breakout, effectively converting previous overhead supply into near-term support.

    Immediate support is now established at $1.2, with deeper structural support at $1.18 on higher timeframes. Key resistance bands to watch are the $1.3–$1.32 range, followed by the more significant $1.5 zone. Breaking through this latter level would signal a larger trend reversal, moving beyond a mere relief rally.

    While XRP’s 10% gain is substantial, its current market capitalization of $77 billion means that a tenfold increase would require a fundamental shift in institutional sentiment that is not yet widely apparent. Investors seeking asymmetric upside are increasingly exploring earlier-stage infrastructure projects where valuations have not yet fully priced in success.

    One such project attracting attention is Bitcoin Hyper ($HYPER). It aims to be the first Bitcoin Layer 2 solution to integrate with the Solana Virtual Machine (SVM), addressing key limitations of the Bitcoin network, including slow transaction speeds, high fees, and the absence of programmable smart contracts. The architecture promises sub-second transaction finality and low-cost execution while maintaining Bitcoin’s security through a Decentralized Canonical Bridge for BTC transfers. The presale has raised $32 million, with the current token price at $0.0136, and staking options are available for early participants.