Tag: Market Trends

  • XRP Shows Seller Exhaustion, Eyes Recovery

    XRP Shows Seller Exhaustion, Eyes Recovery

    XRP Shows Signs of Seller Exhaustion, Poised for Potential Recovery

    XRP is currently trading near a critical support level, exhibiting early indications of stabilization. While the broader market trend remains under pressure, recent price movements and momentum indicators suggest that selling pressure may be waning, opening the door for a more substantial recovery in the near future.

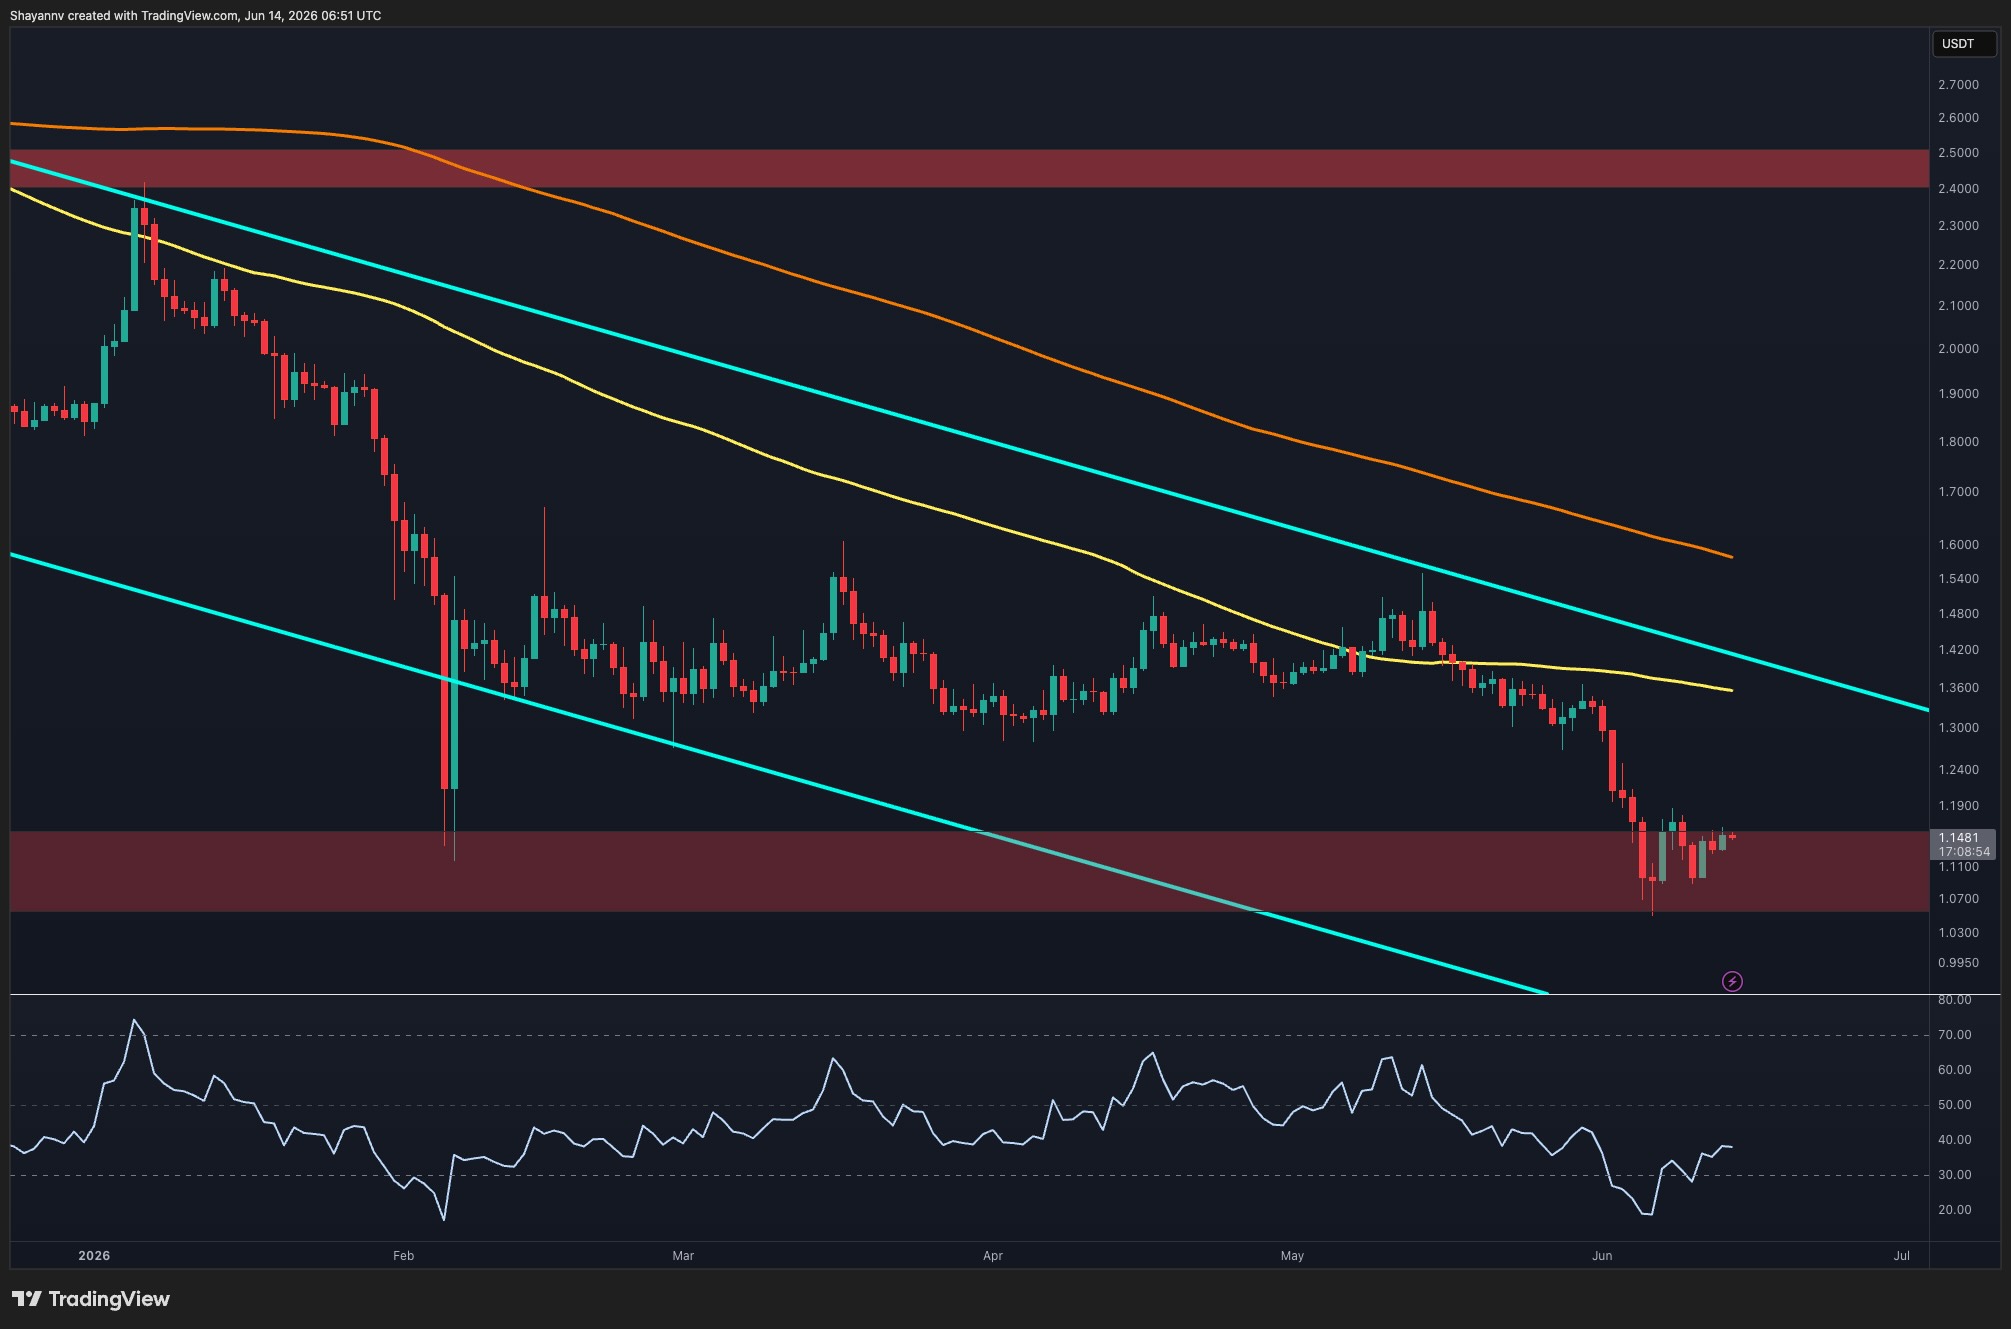
    On the daily chart, XRP has consolidated above a key support zone situated between $1.05 and $1.15. This consolidation follows the asset finding demand near the lower boundary of its descending channel.

    A significant development has been the emergence of bullish divergence between XRP’s price and the Relative Strength Index (RSI). As XRP revisited the $1.05 support area, the RSI registered a higher low. This suggests a weakening of downward momentum, even as the price remained near its recent lows. Such divergences are often observed at potential turning points and can signal a fading of selling pressure.

    For bullish investors, the immediate hurdle remains the resistance presented by the descending channel, which currently aligns with a cluster of moving averages between $1.35 and $1.55. A sustained move into this region would likely improve market sentiment and could indicate a broader trend reversal. Until then, XRP is considered to be in a corrective phase within its prevailing downtrend.

    Short-Term Momentum Builds

    The 4-hour chart reveals XRP gradually constructing a recovery pattern from the $1.05 support zone. The asset has been charting higher lows while respecting an ascending trendline, pointing to improving short-term momentum.

    Immediate resistance is observed in the $1.18 to $1.21 range, which corresponds with the 0.5 Fibonacci retracement level. A successful breach of this resistance could pave the way for XRP to advance towards the 0.618 Fibonacci retracement level at $1.25.

    Beyond this, the primary resistance area lies between $1.27 and $1.30, encompassing the 0.702 and 0.786 Fibonacci levels. This zone previously served as significant support and could now act as a formidable barrier to the ongoing recovery.

    As long as XRP maintains its position above the rising trendline and the $1.05 support zone, the short-term outlook favors continued upward attempts. However, a decisive reclamation of the $1.21 to $1.30 region is necessary to confirm a broader bullish reversal. The daily RSI divergence lends credence to this recovery scenario, indicating a gradual shift in momentum towards buyers.

  • Tether Briefly Surpasses Ethereum by Market Cap

    Tether Briefly Surpasses Ethereum by Market Cap

    Tether’s USDT Briefly Surpasses Ethereum in Market Capitalization

    For a few hours earlier this week, Tether’s USDT stablecoin briefly held a higher market capitalization than Ethereum, marking the first such occurrence in eight years. Data from multiple tracking platforms indicated that both assets were valued within the $183 billion to $188 billion range during this crossover period. One snapshot showed USDT at $187 billion against Ethereum’s $186 billion, a difference of less than $1 billion.

    The shift was short-lived, with Ethereum reclaiming its second-place position once its price stabilized. The underlying factors that led to the crossover – a steady expansion of USDT’s supply coupled with sustained weakness in ETH’s price – did not disappear with the reversal in rankings.

    This was not a supply shock on Ethereum’s part. What compressed ETH’s market cap was its price, while USDT’s expansion was driven by new issuances. Tether’s own fourth-quarter 2025 attestation revealed USDT at a record $187.3 billion, having added $12.4 billion in a single quarter even as the broader cryptocurrency market experienced significant downturns.

    By early 2026, USDT’s market cap had surged from $144.2 billion to $184 billion over twelve months, representing 28% growth. Concurrently, Ethereum’s dollar valuation moved in the opposite direction.

    In the three weeks leading up to the crossover, more than $7 billion exited the stablecoin sector, while the total cryptocurrency market cap shed $400 billion. Ethereum’s total value locked (TVL) in decentralized finance (DeFi) fell to approximately $36 billion. This movement suggests traders were not abandoning stablecoins but rather parking liquidity while divesting from more volatile assets.

    USDT currently holds a 59% share of the total stablecoin market, with USDT and USDC combined accounting for 82%. This indicates Tether’s significant influence within this market dynamic.

    Analyst Sees Potential for Further Stablecoin Dominance

    Mike McGlone, a senior commodity strategist at Bloomberg Intelligence, has been observing this trend for an extended period. In October 2020, McGlone noted that USDT, then valued at $16 billion against Ethereum’s $43 billion, was “on pace to match the market capitalization of Ethereum in a bit less than a year.” He described this as part of an “inexorable trend” toward stablecoins gaining mainstream traction.

    McGlone’s updated analysis suggests a more ambitious trajectory. He anticipates “the flippening to continue,” with Tether’s market cap surpassing Ethereum in 2026 and “eventually Bitcoin.” In an extreme scenario he outlines, if Bitcoin were to fall to $10,000, USDT, which would need to grow sevenfold from its current levels, could potentially challenge Bitcoin for the top spot.

    While this extreme scenario is not endorsed, dismissing it entirely due to its perceived extremity could lead to overlooking significant market shifts, similar to how the USDT-Ethereum crossover was initially underestimated.

    Outlook for Second Place Remains Uncertain

    As of the latest data, Ethereum has regained its second position in market capitalization rankings, but the margin is not substantial. For Ethereum to secure its second-place standing, it would require a sustained and meaningful price recovery, or Tether USDT’s issuance would need to plateau.

    Neither outcome is guaranteed. While structural advancements in Ethereum’s technology stack, including developments in ZK-proof scaling, offer a long-term bullish counterpoint, these catalysts operate on a different timeline than the near-term price weakness that facilitated the recent crossover.

    Tether’s supply trajectory shows no immediate signs of slowing. The stablecoin added $12.4 billion in a single quarter during a market downturn. In a neutral or risk-on environment, this pace could accelerate. Given that USDT maintains a $1 peg, its market capitalization is directly tied to its circulating supply. Consequently, every newly minted USDT represents a direct increment to its market cap, unaffected by the price volatility that influences Ethereum’s ranking.

  • Gemini AI Forecasts Massive XRP Surge

    Gemini AI Forecasts Massive XRP Surge

    Gemini AI Forecasts Significant XRP Surge

    Google’s Gemini AI has placed XRP back in the spotlight, predicting a substantial breakout for the cryptocurrency, with potential gains of 42% to 59% over the next 90 days, targeting a price range of $1.60 to $1.80. Currently trading at $1.13, this forecast hinges on a key catalyst: the impending Senate vote on the CLARITY Act.

    The Bull Case: Legislative Clarity and Institutional Interest

    The optimistic outlook for XRP is largely driven by the potential passage of the CLARITY Act. If enacted, this landmark legislation would officially reclassify XRP as a digital commodity under the purview of the CFTC, thereby removing a significant legal hurdle that has historically suppressed its value.

    This anticipated legislative clarity, coupled with substantial whale accumulation absorbing supply, is seen as a potent combination. Furthermore, recent disclosures of Morgan Stanley ETF holdings indicate rising institutional interest, which could fuel a powerful short squeeze. Gemini AI suggests these factors will drive XRP’s price toward the $1.60 to $1.80 target by the end of the third quarter.

    The Bear Case: Technical Weakness and Macro Pressures

    Conversely, the bearish scenario for XRP is framed as a near-term technical challenge rather than a fundamental collapse. The cryptocurrency is currently testing a head and shoulders neckline, a pattern that typically signals a potential temporary decline if breached.

    A break below the critical support level of $1.09 could see XRP retrace to the $0.94 to $0.96 range. Such a move would likely be triggered by broader macroeconomic pressures or an unexpected delay in legislative progress, derailing the CLARITY Act’s timeline.

    Technical Analysis: A Coiled Spring

    On the 4-hour chart, XRP has experienced a prolonged downturn from its mid-May high of $1.55, currently sitting at $1.13. The prevailing trend on this timeframe is a series of lower highs and lower lows, which found a bottom near $1.05 before the current rebound attempt.

    The identified head and shoulders pattern places the neckline support at approximately $1.09. A decisive break below this level would confirm a bearish outlook. Key support levels are identified at $1.09, followed by $1.05, with deeper demand expected around $0.95. Resistance is noted at $1.20, $1.35, and a more significant zone at $1.45.

    The Relative Strength Index (RSI) is currently at 49.52, with its signal line at 45.22. This positioning near the midline, with the RSI trending upwards, suggests that buying momentum is beginning to reassert itself after a period of selling pressure. A sustained move above 50 and into the 60s would further solidify a bullish shift in momentum. The current chart configuration mirrors the Gemini AI thesis: a coiled spring balanced on the neckline, awaiting a decisive trigger.

    Holding the $1.09 support and reclaiming $1.20 could pave the way for the projected $1.60 to $1.80 price target. However, a failure to maintain the neckline support would bring the $0.95 level into play.

    Beyond XRP: Emerging Opportunities in Early-Stage Infrastructure

    While major cryptocurrencies like Bitcoin, Ethereum, and XRP have been consolidating against resistance levels, the search for the next significant breakout continues. The narrative of institutional inflows and predictable market movements is contrasted with the potential for outsized returns in early-stage infrastructure projects.

    Copilot AI highlights that capital that might be negligible in larger markets can significantly impact smaller, undiscovered projects. The true asymmetric return, it suggests, lies in the gap between a project’s intrinsic value and its current market perception, a gap that often exists due to a lack of market awareness.

    LiquidChain: Addressing Cross-Chain Fragmentation

    The persistent issue of cross-chain fragmentation has been a drain on DeFi participants, with existing solutions like bridges often becoming mechanisms for extracting fees rather than solving the problem. Bitcoin, Ethereum, and Solana, designed as independent systems, incur costs in fees, slippage, and execution failures for every transaction that crosses their boundaries.

    LiquidChain aims to eliminate these cross-chain fees by operating three networks within a single execution layer. This architecture allows for a single deployment to reach all networks without incurring a “cross-chain tax” on any interaction.

    Copilot AI has flagged LiquidChain as a project to watch. Its presale is currently priced at $0.01454, having raised over $835,000. While its execution and adoption remain unproven, LiquidChain represents a potential entry point into a market that could disappear once it gains wider recognition, offering a different proposition compared to the more predictable, ceiling-bound trajectory of established assets.

  • Ethereum Poised for Double-Digit Quarterly Loss: Buy Signal?

    Ethereum Poised for Double-Digit Quarterly Loss: Buy Signal?

    The world’s second-largest cryptocurrency by market capitalization has experienced a turbulent price trajectory, marked by a new all-time high last year that barely surpassed its previous peak. This was followed by a significant downturn, pushing its market share against Bitcoin lower.

    Daan Crypto Trades, a prominent analyst, posted on X (formerly Twitter) today, questioning whether the current price collapse, which saw Ethereum (ETH) hit a 14-month low of $1,500 last week, presents a viable opportunity for accumulation.

    Current data indicates that ETH is on pace for its second-worst first half of the year since 2022. In that year, ETH saw a 10.75% drop in the first quarter and a substantial 67% decline in the second. This year, it has already fallen by 29% in Q1 and 21% in Q2, with several weeks remaining in the current quarter.

    Compounding the negative performance compared to 2021/2022, Ethereum is poised to close three consecutive quarters in negative territory. These losses have all been in double digits since Q4 2025 concluded with a 28% decrease.

    Daan Crypto Trades described the past nine months as “extremely bad” for the altcoin, particularly after its peak following a significant accumulation phase by Bitmine. The firm, chaired by Tom Lee, reportedly amassed billions of dollars worth of ETH, but its position is now also in the billions of dollars in the red due to the asset’s price correction.

    Despite the current market conditions, the analyst remains optimistic about Ethereum’s future role in tokenization, decentralized finance (DeFi), and other applications. He suggested that current price levels are “finally attractive again for longer-term accumulation (years).” However, he cautioned that bear markets can persist longer than anticipated and advised maintaining some “dry powder” for unforeseen circumstances.

    Meanwhile, fellow analyst Ali Martinez highlighted a recent surge in Ethereum investors withdrawing funds from exchanges. Citing data from Glassnode, Martinez reported that approximately 500,000 ETH, valued at around $800 million at current prices, were removed from trading platforms within a single week.

    Martinez suggested this trend could align with the accumulation strategy and serve as an “early sign of accumulation.”

    In a separate post, Martinez issued a warning, indicating that Ethereum’s true price bottom could be more than 50% below current levels, potentially reaching around $700.

  • Pi Network Gains Momentum as Bitcoin Hits 10-Day Peak

    Pi Network Gains Momentum as Bitcoin Hits 10-Day Peak

    Bitcoin Surges to Near $64,800, Fueled by Geopolitical Developments

    Bitcoin’s price experienced a significant jump, reaching nearly $64,800 in recent hours, marking its highest point since June 4. This surge appears to be influenced by a combination of geopolitical tensions and a recent statement from former President Donald Trump regarding a potential deal with Iran.

    Market Overview

    The broader cryptocurrency market is showing signs of recovery, with most larger-cap altcoins trading in positive territory. Binance Coin (BNB) has climbed to $610, and Solana (SOL) is approaching the $70 mark. Notably, TAO has seen a substantial increase of over 15%.

    Bitcoin’s Volatility and Recovery

    The primary cryptocurrency experienced a sharp decline at the beginning of the month, plummeting from over $73,000 to a 19-month low of $59,100 within a four-to-five-day period. After shedding $14,000 in less than a week, Bitcoin found support and managed to reclaim the $60,000 level. The following week saw the digital asset trade sideways between $61,000 and $64,000, with its movements closely mirroring developments on the war front involving the US, Iran, and other Middle Eastern nations.

    Trump’s Deal Announcement and Market Reaction

    Former President Donald Trump announced yesterday that a permanent deal with Iran is slated for signing today, June 14. The initial reaction from Bitcoin has been somewhat muted, with a brief ascent to $64,800 followed by a slight decline. However, conflicting reports emerging from Iran suggest that a deal may not be finalized today.

    Currently, Bitcoin’s market capitalization is approaching $1.3 trillion, and its dominance over altcoins has risen to 56.6%.

    Altcoin Performance

    Ethereum is trading near $1,700, while Binance Coin has reached $610 and XRP is hovering around $1.15. Solana is nearing $70, with Tron (TRX) and Dogecoin (DOGE) showing minor gains. HYPE has touched $60 after a 2% increase, and Zcash (ZEC) has added 3% to its value, reaching $427.

    Among the larger-cap cryptocurrencies, TAO has shown the most significant gains, while BEAT has experienced a 20% daily decline. Humanity (H) has entered the top 100 altcoins by market capitalization, driven by an impressive daily surge of over 90%.

    Pi Network’s Revival

    The native token of Pi Network has finally demonstrated signs of recovery following a recent downturn. The token had fallen to an all-time low of under $0.12 last week but has since rebounded to trade well above $0.13, representing an increase of more than 10% from its lowest point.

    The total cryptocurrency market capitalization has increased by $20 billion in the past day, reaching $2.280 trillion, according to CoinGecko.

  • Crypto Token Sales Slump Towards 5-Year Lows in Q2 2026

    Crypto Token Sales Slump Towards 5-Year Lows in Q2 2026

    Public Token Sales Plummet to Five-Year Lows

    Public cryptocurrency token sales have generated a mere $58 million in the second quarter of 2026, marking an 85% decrease from the preceding quarter, according to data released by CryptoRank on June 10. This downturn positions the current period to become the weakest fundraising quarter for Initial Coin Offerings (ICOs), Initial DEX Offerings (IDOs), and Initial Exchange Offerings (IEOs) in half a decade.

    CryptoRank’s figures reveal that while the first quarter of 2026 already showed signs of weakness with approximately $390 million raised across 105 sales, the situation has significantly worsened in the subsequent quarter.

    The severity of the decline is starkly illustrated in a month-by-month breakdown. April saw just $15 million raised from 20 sales, followed by May, which brought in around $41 million from only 13 sales. This represents the lowest monthly sales volume since December 2020. June, still in progress, has so far recorded a meager $2 million from just four sales.

    For context, January 2025 alone witnessed $654 million in fundraising, with that entire quarter serving as a cycle peak, amassing just under $850 million across 429 sales. Since that high point, the market has seen its quarterly fundraising volume, in dollar terms, shrink by over 93%.

    Despite this contraction, CryptoRank’s dashboard indicates that public token sales collectively raised more than $4 billion between the first quarter of 2024 and the second quarter of 2026.

    During this period, IDOs consistently dominated the fundraising landscape, accounting for nearly 75% of all public sales. IEOs and ICOs represented 18% and 7% of activities, respectively. However, all three formats have experienced a sharp contraction this quarter.

    Among the leading launchpads, Coinlist stands out as the largest by capital raised, having facilitated $1.37 billion. Fjord Foundry follows with $975 million, and Echo with $201 million. Gate Launchpad and DAO Maker complete the top five.

    Venture Capital Activity Also Slows

    The slowdown extends to crypto venture capital activity, which also saw a decline in the first quarter of 2026, according to a May report by Galaxy Digital. During that period, private investors contributed approximately $4 billion across 355 deals, a 50% drop from the previous quarter.

    Galaxy Digital attributed this decline primarily to a scarcity of substantial late-stage funding rounds, which had been prevalent in late 2025. Nevertheless, some significant raises have occurred recently, including Digital Asset Holdings’ $355 million round led by Andreessen Horowitz, which followed a $300 million raise just a month prior.

    CryptoRank’s data suggests that while capital remains available within the crypto space, it is increasingly being channeled into a smaller number of companies and private funding rounds, rather than public token launches. These public launches reached their zenith when market sentiment was at its strongest and appear to have since mirrored the broader market’s downturn.

    This trend is further evidenced by a previous CryptoRank report, which showed that many projects funded between April and June 2025, during a crypto market rebound, ended the year trading significantly below their initial fundraising valuations. This may explain the current lack of retail investor appetite for new launches in 2026.

  • Musk’s SpaceX AI Forecasts Massive Bitcoin Surge

    Musk’s SpaceX AI Forecasts Massive Bitcoin Surge

    Bitcoin’s Rocky Road: AI Predicts a Rebound Amidst Market Uncertainty

    The pronouncements of capitulation are often only validated in hindsight. Currently, with Bitcoin hovering in the low $60,000s, a forecast of a surge to the mid-$70,000s might seem overly optimistic. Yet, Elon Musk’s AI, xAI, is venturing such predictions, setting a 30-day target of $72,000 to $78,000 for a cryptocurrency that has recently seen its value nearly halved.

    This projected rebound, representing a 14% to 24% increase from the $63,000 mark, hinges on the assumption that current sellers are those who consistently exit at market bottoms. This is the core of the bullish argument. With over 50% of Bitcoin’s supply now held at a loss, xAI interprets this not as a sign of weakness, but as a classic capitulation event that has historically marked the floor in previous market cycles.

    The narrative suggests that long-term holders are quietly accumulating during this period of fear, ETF outflows are diminishing, and historically, June has often seen positive price action for Bitcoin. The addition of even a slight easing of macroeconomic liquidity or greater regulatory clarity could ignite a sharp rally driven by short-covering.

    A more confident projection sees Bitcoin breaking through the $65,000 resistance level and accelerating towards the mid-$70,000s by mid-July as market sentiment shifts.

    xAI Acknowledges Downside Risks

    However, xAI is candid about the potential for a downturn. Should Bitcoin decisively fall below $60,000, with capital continuing to flow into AI and equities, and a persistently challenging macroeconomic environment, the cryptocurrency could slide towards the $55,000 to $58,000 range.

    Intriguingly, this potential decline is framed as a higher-probability buying zone rather than the onset of a severe crash. In essence, even the bearish scenario is presented as an opportunity for a discount, not a disaster.

    Chart Analysis Supports Key Levels

    The current chart patterns offer some backing to these projections. A review of the daily chart reveals the extent of the damage, with Bitcoin trading at $63,024 after a significant decline from its October peak of $126,000, a drop that has effectively erased more than half of that gain.

    The prevailing trend is undeniably downward, characterized by a series of lower highs. The most recent leg of this slide pushed the price into the low $60,000s, with a brief dip near $60,000 preceding the current modest bounce.

    This specific price zone, between $60,000 and $62,000, is crucial. It served as a strong support level where buyers entered aggressively in February, and it is the floor upon which xAI’s bullish outlook rests.

    A decisive daily close below this level could quickly open the door to $58,000, with $55,000 as a further potential downside target. Conversely, holding this support could lead to a test of the $65,000 resistance, a level that must be breached for momentum to build, paving the way for targets at $72,000 and the more significant $76,000 ceiling.

    RSI Signals Potential Selling Exhaustion

    The Relative Strength Index (RSI) offers a point of agreement with the bulls. Currently at 31.95 with its signal line at 25.74, the RSI indicates that price momentum has entered deeply oversold territory but has already begun to turn upward, crossing above its average.

    This approximately 6-point divergence, with the RSI leading the signal higher, suggests early signs of selling exhaustion rather than continued downward pressure. While not a standalone buy signal, it aligns with xAI’s assessment that capitulation among weaker hands may be nearing its end. A reclaim of $65,000 with this underlying momentum could shift the mid-$70,000s target from wishful thinking to a more probable trajectory.

    The Waiting Game for Large Caps

    Major cryptocurrencies like Bitcoin, Ethereum, and XRP have been consolidating within familiar ranges for weeks, failing to break through key resistance levels. Each potential macro catalyst or institutional adoption wave seems to be perpetually pushed back to a later date. Holding assets whose next move is entirely dependent on external decisions can feel less like trading and more like waiting in a room.

    The capital that truly drives market cycles often moves discreetly, reallocating before destinations become obvious.

    Small-Cap Infrastructure Plays Offer Different Dynamics

    Smaller market capitalization infrastructure projects operate on principles that large-cap assets cannot replicate. A rotation that would be negligible for Bitcoin could significantly reprice an undiscovered project. The opportunity lies in the gap between a project’s intrinsic value and its current market valuation, a gap that can be fully captured before market discovery closes it.

    The Challenge of Multi-Chain Fragmentation

    The persistent issue of multi-chain fragmentation in Decentralized Finance (DeFi) has remained largely unsolved. Bitcoin, Ethereum, and Solana, for instance, operate as isolated ecosystems with no native interoperability or shared architecture. Every transfer of value between these networks incurs costs through fees, slippage, and failed transactions.

    LiquidChain aims to address this by creating a unified execution environment for these networks, enabling single deployments and complete ecosystem access without transaction fees.

    The project’s presale is currently priced at $0.01454, having raised over $830,000, positioning it as an early-stage, undiscovered opportunity.

    However, its execution remains unproven, and adoption is uncertain. Established assets offer predictability within known market parameters. LiquidChain, conversely, represents an entry point that may cease to exist once the market recognizes its potential.
  • Bitcoin ETFs Suffer Prolonged Losses, Outlook Brightens

    Bitcoin ETFs Suffer Prolonged Losses, Outlook Brightens

    Bitcoin ETFs Continue Extended Downturn, Showing Signs of Improvement

    For the fifth consecutive week, spot exchange-traded funds tracking the world’s largest cryptocurrency have closed in negative territory, with outflows consistently exceeding inflows.

    While the trend remains downward, the figures are considerably less severe than in the preceding week, and Friday saw a positive shift with net inflows.

    CryptoPotato has previously reported on the lackluster performance of spot Bitcoin ETFs, particularly during the first week of June. That period saw investors withdraw over $1.7 billion, marking the second-worst week in the ETFs’ history.

    Last week, four out of the five trading days registered net outflows. These withdrawals amounted to $91.37 million on Monday, $77.44 million on Tuesday, $213.85 million on Wednesday, and $19.03 million on Thursday. A glimmer of optimism emerged on Friday, however, as net inflows reached $85.85 million, according to data from SoSoValue.

    Despite Friday’s positive turn, the week concluded with total net outflows of nearly $316 million. The more encouraging aspect, if it can be termed as such, is that these net withdrawals were a fraction of the billions recorded in the previous four weeks. Nevertheless, the negative streak persists, with the ETFs having seen over $5.7 billion in outflows since the week ending May 15.

    Cumulative net inflows have also seen a decline, falling from $59.34 billion on May 8 to $53.62 billion as of June 12.

    Ethereum ETFs Mirror Bitcoin’s Trend

    The landscape for spot Ethereum ETFs presents a similarly challenging, albeit less dramatic, picture. SoSoValue data indicates that these funds have also experienced five consecutive weeks of net outflows. However, the most recent week was not as impactful as many of its predecessors.

    Monday proved to be a strong day for Ethereum ETFs, with investors injecting $82.37 million into the funds. This positive momentum, however, did not carry through the week. Subsequent days saw net outflows of $40.85 million on Tuesday, $35.59 million on Wednesday, $15.89 million on Thursday, and $4.95 million on Friday.

    Consequently, the week ended with net outflows just shy of $15 million, a significant reduction compared to the $173 million withdrawn the previous week.

    Cumulative total net inflows for Ethereum ETFs decreased to under $11.20 billion on Friday, down from a peak of $12.09 billion on May 8.

  • Bitcoin Holds Near $64K, Cardano Aims for Recovery: Weekend Outlook

    Bitcoin Holds Near $64K, Cardano Aims for Recovery: Weekend Outlook

    Bitcoin Holds Steady Near $64,000 Amidst Market Fluctuations

    Bitcoin’s attempt to breach the $64,000 mark yesterday was met with resistance, and the cryptocurrency is trading close to that level on Saturday morning. The broader altcoin market has seen modest gains for most larger-cap assets, including ADA and HYPE, both up approximately 3%. However, XMR has experienced a significant downturn.

    The primary cryptocurrency showed resilience following a substantial price decline in the first week of June, which saw it plummet to a 19-month low of $59,100 on Friday. Following this dip, Bitcoin staged a recovery, surging towards $64,000 on June 8.

    However, escalating geopolitical tensions, particularly concerning new attacks in the US-Iran war front and surrounding regions, coupled with higher-than-expected May CPI figures – the highest in years – have stalled Bitcoin’s recovery efforts.

    Throughout the past week, BTC dipped below $61,000 on several occasions but managed to defend this level, signaling an intention for a more significant rebound. The peak price was reached yesterday, shortly before the SPCX trading debut on Wall Street, with a surge to nearly $64,500. Nevertheless, bearish sentiment intervened, and BTC is now trading just below $64,000.

    Bitcoin’s market capitalization has risen to approximately $1.280 trillion, according to CG data. Its dominance over altcoins has also increased, reaching 56.4%.

    Altcoin Performance Varies

    Ethereum continues its gradual ascent, inching closer to the $1,700 mark with another minor daily increase. BNB, XRP, and TRX have recorded similar gains of less than 1%. DOGE and SOL are up between 1.6% and 1.7%, while HYPE has seen a more substantial jump of over 3% to $59. Cardano’s native token is also attempting a recovery, up 3% to well above $0.17 following recent sharp declines.

    In contrast, XMR has reversed earlier weekly gains, dropping by more than 12% to $340. NEAR and ZEC are also trading slightly in the red. Conversely, BEAT, TAO, and ICP have posted significant gains, some reaching up to 11%.

    The total cryptocurrency market capitalization has remained stable, hovering near $2.270 trillion, as reported by CG.

  • Pi Network (PI) Shows 3 Bullish Signs, Potential Bottom Reached

    Pi Network (PI) Shows 3 Bullish Signs, Potential Bottom Reached

    Pi Network’s Ecosystem Evolves as Key Indicators Hint at Potential Price Rebound

    The development team behind Pi Network is continuing to refine its ecosystem, with the recent transition to protocol v24 marking a significant milestone. An upgrade to v25 is anticipated later this month.

    Despite these advancements, the price of PI has yet to see a substantial recovery. However, several key factors suggest that a turnaround may be on the horizon.

    PI first entered the trading market in February of last year, initially drawing considerable investor interest. At its peak, the cryptocurrency’s valuation soared to approximately $3, but this surge proved to be short-lived. In the months that followed, the price experienced a sharp decline, currently trading around $0.12. This figure is close to its all-time low, representing a staggering 96% drop from its highest point.

    While prevailing market conditions remain bearish, three important elements point towards a potential rebound for PI. The first is the asset’s Relative Strength Index (RSI), which has fallen to an extremely oversold level of approximately 2.6 on a monthly scale. This indicates that the valuation has depreciated too rapidly over a short period, a pattern that has historically preceded price recoveries. Conversely, RSI readings above 70 typically signal an impending market correction.

    Another significant development is the decrease in the amount of PI tokens held on exchanges. After reaching an all-time high of over 550 million tokens, the figure has recently dropped to 545 million. This reduction is viewed as a bullish indicator, as it lessens immediate selling pressure.

    Finally, upcoming token unlocks warrant close observation. Today, June 12, is projected to be a peak unlock day, with nearly 15 million coins scheduled for release. However, the pace of unlocks is expected to slow considerably over the subsequent four weeks. The average daily unlock rate is projected to decrease to 4.8 million, which could contribute to a more stable environment conducive to price recovery.

    The PI community has long believed that a listing on Binance, the world’s largest cryptocurrency exchange, would serve as a powerful catalyst for a significant price increase. Last year, Binance appeared to be considering such a move after polling its users on their desire to see PI available on the platform. Despite an overwhelming majority voting in favor, the exchange has yet to confirm a listing.

    Speculation among some X users suggests that an announcement regarding a potential Binance listing could be made on June 28, a date recognized by Pioneers as Pi2Day. Other developments anticipated on this symbolic day include initiatives aimed at ecosystem growth and the introduction of new products. It is important to note that the Pi Network team may not make any announcements on this date, and therefore, managing expectations is advisable.