Tag: Market Trends

  • Binance Futures Implements Last Price Protection on HUSDT Perpetual Contract

    Binance Futures Implements Last Price Protection on HUSDT Perpetual Contract

    Binance Futures to Implement Last Price Protected Mechanism for HUSDT Perpetual Contract Amidst Security Incident

    Binance Futures announced it will implement a Last Price Protected (LPP) mechanism on its USDⓈ-Margined HUSDT Perpetual Contract starting June 15, 2026, at 18:45 UTC. This measure is a response to observed spot price divergence and deposit/withdrawal limitations across various exchanges, following a security incident involving Humanity Protocol. Binance has assured users that their funds on the platform remain secure.

    LPP Mechanism Implementation

    The LPP mechanism will be rolled out gradually, employing a mark price smoothing process. This approach aims to mitigate sudden price fluctuations and enhance price stability during the transition period.

    The duration of the LPP period for the USDⓈ-Margined HUSDT Perpetual Contract will conclude when the spot price of Humanity Protocol (H) converges across multiple exchanges, allowing for the derivation of a stable index price from spot markets, as determined by Binance.

    A separate announcement will be issued to signal the end of the LPP period and the contract’s return to standard Mark Price calculation, which is determined by the median of three prices: Price 1, Price 2, and the Contract Price. The transition timeline is contingent upon price volatility and the availability of a stable index price.

    Understanding the Last Price Protected Mechanism

    Under the LPP mechanism, the mark price is calculated based on the average of recent transaction prices for the perpetual contract within a defined window. Specifically, it is the average of trade prices from the last 10 seconds, recalculated every second. If fewer than 21 transaction prices are recorded within the 10-second interval, the system will extend its lookback to the past 100 seconds. If more than 21 prices are available in that longer period, the average will be based on those 100 seconds of transaction data; otherwise, it will use the last 100 transaction prices recorded for the contract.

    Furthermore, a price cap of ±1% will be applied to the mark price, limiting its movement within this range every second.

    Transition to Standard Mark Price Calculation

    Upon the conclusion of the LPP period, the Mark Price will revert to the formula: Mark Price = Median (Price 1, Price 2, Contract Price). Users can find the formulas for Price 1 and Price 2 within the USDⓈ-Margined Futures Mark Price and Price Index documentation.

    Funding Rate Adjustments

    Effective from June 15, 2026, at 18:45 UTC, the funding interval for the HUSDT Perpetual Contract will be extended from one hour to four hours. Concurrently, the capped funding rate will be adjusted from ±2.00% to ±0.005%.

    The detailed schedule for these adjustments is as follows:

    • June 15, 2026, 18:00 (UTC): Max Funding Rate +2.000% / -2.000%
    • June 15, 2026, 20:00 (UTC): Max Funding Rate +0.005% / -0.005%
    • June 16, 2026, 00:00 (UTC): Max Funding Rate +0.005% / -0.005%
    • June 16, 2026, 04:00 (UTC): Max Funding Rate +0.005% / -0.005%

    The aforementioned contract is exempt from the standard Rule 8.1 regarding the Adjustment of Funding Interval. The funding interval will not revert to hourly when the previous funding rate settlement reaches the capped rate.

    Once the LPP period concludes, the funding rate will adhere to the standard perpetual futures contract rules, with maximum and minimum rates potentially reaching ±2.00%. The funding interval will then revert to hourly when the previous funding rate settlement hits ±2.00%.

    Additional Information and Disclaimers

    Users are encouraged to refer to the following resources for further details:

    • Trading Rules to Trading Parameter
    • Funding Rate History
    • Mark Price and Price Index
    • Binance Futures Contract Specification

    This notice is issued under Binance Exchange Rule 17. During the LPP period, Binance Futures will be the sole component of the price index. A stricter maximum price will be enforced, which Binance may adjust based on market risk conditions. API users can access this information via GET /fapi/v1/exchangeInfo, while UI users can find it on the designated webpage.

    Binance reserves the right to modify the specifications of the affected futures contract, including funding fees, tick size, maximum leverage, and margin requirements, in response to market risk conditions. Users should consult the Trading Rules for the most up-to-date information.

    In the event of any discrepancies between this English version and any translated versions, the original English content shall prevail.


  • Altman Predicts XRP Surge by 2030

    Altman Predicts XRP Surge by 2030

    Sam Altman’s ChatGPT Offers a Measured Outlook on XRP’s Future

    A key insight within a recent prediction cuts through the usual market noise more effectively than any specific price target. The most common pitfall for investors is the binary thinking that XRP must either soar to over $100 or fail entirely. In essence, Sam Altman’s ChatGPT is urging the XRP community to mature, to move beyond oscillating between fervent devotion and pronouncements of demise, and to instead view the asset as a long-term infrastructure play.

    The baseline projection for XRP by the end of 2030 anticipates a price between $10 and $18, a significant increase from its current $1.24. This represents an approximately 8x to 14x return over four years, a figure that may seem modest until properly contextualized.

    This scenario assumes Ripple continues its current trajectory: expanding institutional payment networks, attracting consistent capital into XRP-centric financial products, and benefiting from the gradual emergence of regulatory clarity. It requires no speculative “moonshot” assumptions, relying solely on sustained execution and adoption at the existing pace.

    The Bull Case: XRP as Global Infrastructure

    The bull case, projecting XRP between $25 and $40, presents a more compelling narrative. This range suggests XRP will have transitioned from a promising network to a critical piece of global infrastructure, deeply integrated into cross-border settlement, tokenization processes, and liquidity management at a scale that commands a substantial premium.

    This outlook also presumes a broader cryptocurrency market that is several times larger than its current size. Such growth is plausible within a four-year timeframe, especially if institutional adoption continues to compound.

    The Bear Case: Competition and Market Capture

    Conversely, the bear case, with XRP ranging from $2 to $5, envisions a scenario where stablecoins, central bank digital currencies (CBDCs), or competing payment networks outmaneuver XRP. Despite its brand recognition, these alternatives could capture the target market before XRP can fully establish its dominance.

    Chart Analysis: A Foundation for Future Growth

    Examining XRP’s weekly chart reveals a dramatic surge in late 2024, when it climbed from under $0.70 to $3.84 in a matter of weeks – one of the most significant altcoin rallies in recent memory. This was followed by a persistent decline, with the price now sitting at $1.24, just above the consolidation zone that held from most of 2023 and early 2024.

    This historical context is crucial for the 2030 thesis. XRP has already demonstrated its capacity for dramatic repricing when market conditions align. The core question ChatGPT poses is whether the next significant price movement will be driven by speculative fervor or by more fundamental, durable factors.

    The $1.00 to $1.30 region is now a critical juncture. This zone acted as resistance for years before the 2024 breakout and now serves as long-term support. A weekly close below this level would complicate the technical setup, while holding it would establish a solid foundation for infrastructure-like growth.

    The weekly Relative Strength Index (RSI) stands at 36.02, with the signal line just below at 35.11. The narrow gap between them, barely exceeding one point, indicates that while downward momentum has stalled, upward acceleration has not yet begun. This RSI convergence after a prolonged decline suggests a period of compressed energy, awaiting a catalyst.

    Given that ChatGPT’s analysis emphasizes measurable adoption and institutional flows over hype, this subdued momentum is logical. The current chart is not pricing in a $10 XRP; rather, it reflects a stabilization after a period of decline, with anticipation for what comes next.

    Institutional Stasis and the Infrastructure Play

    Large-cap traders are currently in a holding pattern, not actively positioning themselves. Bitcoin, Ethereum, and XRP have all been testing similar resistance levels for weeks. The catalyst for a breakout often hinges on external data releases or the next quarterly report on institutional inflows. Ultimately, each significant upward move depends on decisions made by external entities.

    Early-stage infrastructure plays operate under different dynamics. Capital that might be dismissed as noise at Bitcoin’s scale can significantly impact an undiscovered project. The potential for returns lies in the discrepancy between a project’s intrinsic value and its current market valuation, a gap that closes once the project gains wider recognition.

    LiquidChain: A New Approach to Interoperability

    Cross-chain fragmentation has plagued Decentralized Finance (DeFi) since the inception of the first bridges. Bitcoin, Ethereum, and Solana were developed as independent systems with no inherent interoperability. Transactions across these networks incur costs through fees, slippage, and failed executions. Bridges, intended as a solution, have often become costly intermediaries.

    LiquidChain aims to eliminate these intermediaries by consolidating three networks within a single execution layer. This allows for a single deployment without cross-chain transaction costs.

    Copilot AI has identified LiquidChain as a project worth monitoring. Its presale is priced at $0.01454, having raised just over $835,000.

    However, LiquidChain’s execution remains unproven, and its adoption is currently unknown. Established assets offer a predictable path toward a visible ceiling. LiquidChain, in contrast, represents an entry point that could disappear once the market fully discovers its potential.

  • XRP Surges on Bullish Signals and ETF Hopes

    XRP Surges on Bullish Signals and ETF Hopes

    XRP Price Surges Amidst Bullish Technicals and ETF Inflows

    XRP experienced a significant upward movement today, climbing 9% from a low of $1.1 to $1.24, with analysts predicting further gains. This surge is attributed to a confluence of two key factors.

    Ascending Triangle Formation and ETF Momentum

    On the 4-hour chart, XRP has formed a textbook ascending triangle pattern, currently testing horizontal resistance. This technical setup is being bolstered by two consecutive weeks of positive inflows into XRP Spot Exchange-Traded Funds (ETFs). The pattern has a clearly defined price target, awaiting a catalyst for a breakout.

    Data released for the week ending June 12, 2026, revealed net inflows of $10.68 million into XRP Spot ETFs. This marks the second consecutive week of positive inflows, bringing the cumulative net inflow to $1.44 billion and total Assets Under Management (AUM) to $978.86 million.

    The Significance of ETF Inflows

    The importance of these figures lies in their potential to attract further investment. Crossing the $1 billion AUM threshold often garners increased media attention within traditional finance circles. This, in turn, tends to draw in additional investors who often gauge the credibility of a product by its AUM.

    Macroeconomic Tailwinds and Fundamental Utility

    The broader market sentiment has also improved, partly due to a perceived peace deal between the US and Iran, providing a lift to the entire altcoin market. However, the specific ETF data and chart structure suggest that XRP’s recent performance has a more substantial foundation than a mere sentiment-driven trade.

    Furthermore, Ripple’s business developments are signaling growing adoption. The integration of OpenPayd for Ripple Payments and the ongoing minting and burning of RLUSD point to an expansion of real-world settlement utility, which could provide a more durable anchor for demand over time.

    A recent announcement highlighted that Ripple partner OpenPayd has confirmed plans for a Nasdaq listing, underscoring the ongoing significance of their collaboration. The continued focus on fiat rails, RLUSD support, and cross-border payments suggests a robust ecosystem where an OpenPayd public listing could enhance visibility.

    Technical Analysis and Price Targets

    XRP is currently trading around the $1.25 mark. The ascending triangle on the 4-hour chart, which began forming in early June, shows a series of higher lows converging against horizontal resistance in the $1.18–$1.19 zone.

    The price recently found support at $1.12, coinciding with the 50-period moving average, before rallying towards the upper boundary of the triangle. This defense of the moving average is a critical structural signal, indicating that buyers are systematically supporting dips rather than reacting to them.

    The measured move target for the ascending triangle breakout suggests a potential price of $1.32, which is still more than 5% above the current resistance level. Previous analysis has identified the $1.20 level as key downside support, with the $1.45–$1.50 band representing the next significant resistance area should the initial breakout extend.

    Institutional Momentum and Emerging Infrastructure Plays

    While XRP is showing a strong breakout and a potentially favorable risk-reward profile for traders, a 10% move in an asset with a market capitalization exceeding $70 billion presents a different structural risk-reward dynamic compared to investing in early-stage infrastructure projects before their narratives are fully priced in by the market.

    Traders monitoring XRP’s institutional momentum driven by ETF flows may find it beneficial to cross-reference this with the current pricing of early-stage capital in cross-chain infrastructure plays.

    LiquidChain: A New Cross-Chain Liquidity Layer

    LiquidChain ($LIQUID) is emerging as a Layer 3 infrastructure project aiming to establish itself as a cross-chain liquidity layer. It seeks to unify liquidity from Bitcoin, Ethereum, and Solana into a single execution environment. The project’s architecture features a Unified Liquidity Layer with single-step execution, verifiable settlement, and a deploy-once model, allowing developers to access multiple ecosystems without the need for chain-specific rebuilding.

    The presale for LiquidChain is currently priced at $0.0147 per $LIQUID token, having raised $840,000 to date. Investors are encouraged to research LiquidChain’s presale structure before the current round concludes.

  • Strategy Buys 1,587 BTC as Bitcoin Selloff Fears Recede

    Strategy Buys 1,587 BTC as Bitcoin Selloff Fears Recede

    MicroStrategy Buys More Bitcoin as Sale Concerns Subside

    Two weeks after its first Bitcoin sale in nearly four years, business intelligence firm MicroStrategy has once again signaled its commitment to the cryptocurrency, acquiring an additional 1,587 BTC for approximately $100 million.

    The average purchase price for this latest acquisition was just over $63,000 per Bitcoin. Concurrently, the company bolstered its U.S. dollar reserves by $100 million, bringing its total cash holdings to $1.1 billion. MicroStrategy’s total Bitcoin holdings now stand at 846,842 BTC, currently valued at nearly $56 billion.

    The company’s recent activity was highlighted in a June 15, 2026, tweet from co-founder Michael Saylor: “Strategy has acquired 1,587 BTC for $100 million to increase our $BTC Reserve to ₿846,842. We have also increased our USD Reserve by $100 million to $1.1 billion. $MSTR $STRC.”

    This latest purchase follows a sale of 32 BTC by MicroStrategy a few weeks prior. Contrary to speculation that this signaled a capitulation, the sale was reportedly to fund preferred stock distributions, including cash dividends across the company’s stock series.

    The earlier sale, occurring amidst a period of significant Bitcoin price volatility that saw the cryptocurrency dip below $60,000 for the first time in 19 months, raised some eyebrows within the crypto community. It even prompted CNBC personality Jim Cramer to suggest that the firm and Saylor had “killed” Bitcoin.

    Saylor swiftly addressed these concerns, refuting the “fear, uncertainty, and doubt” (FUD) and clarifying that he had never stated the company would refrain from selling Bitcoin if necessary. However, he reiterated his belief that individual investors should avoid selling their holdings.

    MicroStrategy resumed its aggressive Bitcoin accumulation strategy last week, purchasing 1,550 BTC for just over $100 million.

    Prominent figures in the cryptocurrency space, including Samson Mow and Lyn Alden, defended Bitcoin following the sale. They argued that an entity as committed to Bitcoin as MicroStrategy could not “kill” the cryptocurrency with a single, relatively small sale from its substantial holdings.

  • ETH Nears $2K Amidst Peace Deal Optimism

    ETH Nears $2K Amidst Peace Deal Optimism

    Ethereum Price Surges Amid Peace Deal Optimism, Analysts Eye Historic Oversold Levels

    Ethereum’s native cryptocurrency, ETH, is trading at $1,739, marking a 4% increase over the past 24 hours. The upward momentum in risk assets, including ETH, appears to be fueled by a recent peace deal in the Strait of Hormuz, a development that has traders anticipating a significant market shift not seen in years. The central question for investors is not if ETH will rebound, but whether the current price point represents the final opportunity to enter before the $2,000 mark becomes an increasingly distant prospect.

    One prominent analyst has declared ETH to be the most oversold it has ever been in its history, a claim that warrants closer examination.

    Technical Indicators Point to Historic Lows

    On June 14, 2026, analyst Ash Crypto highlighted that Ethereum’s monthly Relative Strength Index (RSI) has fallen below levels previously recorded during the 2018 and 2022 bear market bottoms. Historically, these periods of extreme oversold conditions have preceded substantial recoveries, often in the hundreds of percentage points.

    A tweet from Ash Crypto detailed the current situation: “$ETH is now the most oversold it has EVER been in its history. – Down -70% from its ATH – Price at the same level as 4 years ago – Monthly RSI more oversold than the 2018 and 2022 bear market bottoms In the last bear cycle, ETH crashed -82% from its ATH and formed a bottom in…”

    Currently, ETH is trading down nearly 70% from its all-time high and is priced at levels last observed four years ago. The digital asset has shown resilience, bouncing from a swing low of $1,603 and subsequently pushing towards $1,731 before consolidating above the 23.6% Fibonacci retracement level of that range.

    Macroeconomic Factors and Market Sentiment

    The recent peace deal in the Strait of Hormuz has injected positive sentiment into broader risk markets. Bitcoin, for instance, has reclaimed the $65,000 level, with larger-cap altcoins following suit. This macroeconomic backdrop is crucial, as sustained recoveries in ETH have historically been contingent on Bitcoin’s upward trajectory.

    Ethereum is currently holding above the $1,700 pivot point, having successfully breached what Bitget has identified as a key resistance level. This technical achievement signals a notable improvement in the market’s outlook for the cryptocurrency.

    Trading volume supports this positive trend. The 24-hour trading volume stands at $26 billion against a market capitalization of $210 billion, indicating robust participation rather than speculative price action.

    Near-Term Price Outlook and Potential Scenarios

    The technical structure of ETH’s chart suggests a period of consolidation within a range, but with underlying energy building. Immediate support levels are identified at $1,665 and $1,640, while resistance is encountered at $1,690, $1,701, and $1,715. CoinCodex projects a potential near-term high of approximately $1,845.

    Should ETH maintain its hold above $1,700 and clear the $1,734 level, the path could open up to $1,923 and subsequently $2,133. The base case scenario for the week anticipates consolidation between $1,665 and $1,780, with a gradual ascent towards $1,845, provided Bitcoin’s sentiment remains stable.

    Conversely, a daily close below $1,603 would invalidate the current bounce thesis and could lead to a retest of the $1,585 level and potentially lower prices.

    The Case for a Historic Recovery

    The structural argument for a significant rebound is bolstered by the RSI data. Historically, monthly RSI readings at such extreme lows have preceded sharp recoveries rather than prolonged downturns. While this does not guarantee that the market has definitively bottomed, the current asymmetry presents a compelling case that is difficult to overlook.

    At $1,720, ETH presents an attractive proposition based on historical metrics. However, even a move to $2,022 would represent a roughly 17% upside for an asset with a market capitalization exceeding $200 billion. While significant in absolute terms, this potential gain is modest when compared to the historical multiplication of capital seen in earlier-stage investments.

    The dynamics of ETH’s market capitalization underscore the tactical rationale for some investors to consider rotating into smaller, pre-launch projects during periods of macro recovery.

    Emerging Opportunities in the Ecosystem

    One such project gaining attention is LiquidChain ($LIQUID), an L3 infrastructure initiative focused on developing a Cross-Chain Liquidity Layer. The project aims to integrate liquidity from Bitcoin, Ethereum, and Solana into a unified execution environment.

    LiquidChain’s value proposition centers on its structural innovation: a Unified Liquidity Layer with Single-Step Execution and Verifiable Settlement. This architecture would enable developers to deploy applications once and access all three major blockchain ecosystems without the complexities of bridging.

    The project’s presale is currently priced at $0.0147, having raised $841,128.18 to date. Early-stage infrastructure plays at this funding stage carry inherent risks, including unproven liquidity, execution capabilities, and adoption rates. The current entry price reflects these risks. Investors are encouraged to research LiquidChain thoroughly before the presale price potentially increases.

  • Iran Peace Deal Boosts Bitcoin; Japan’s Crypto ETF Market Hits $6.4B; WLFI, White House UFC Match

    Iran Peace Deal Boosts Bitcoin; Japan’s Crypto ETF Market Hits $6.4B; WLFI, White House UFC Match

    Bitcoin experienced a rare surge in value, with “green candles” appearing on charts, as a reported peace deal between former President Donald Trump and Iran appeared to inject momentum into the market. Simultaneously, preparations for cryptocurrency exchange-traded funds (ETFs) in Japan signal substantial institutional inflows are on the horizon. Adding to the day’s notable events, a White House-hosted UFC event is slated to highlight Trump’s characteristic flair.

    Bitcoin climbed back above the $65,000 mark, reaching $65,800 earlier today, while Ethereum reclaimed $1,700. These gains contributed approximately $60 billion to the total cryptocurrency market capitalization, occurring amidst nearly $250 million in liquidations of short positions.

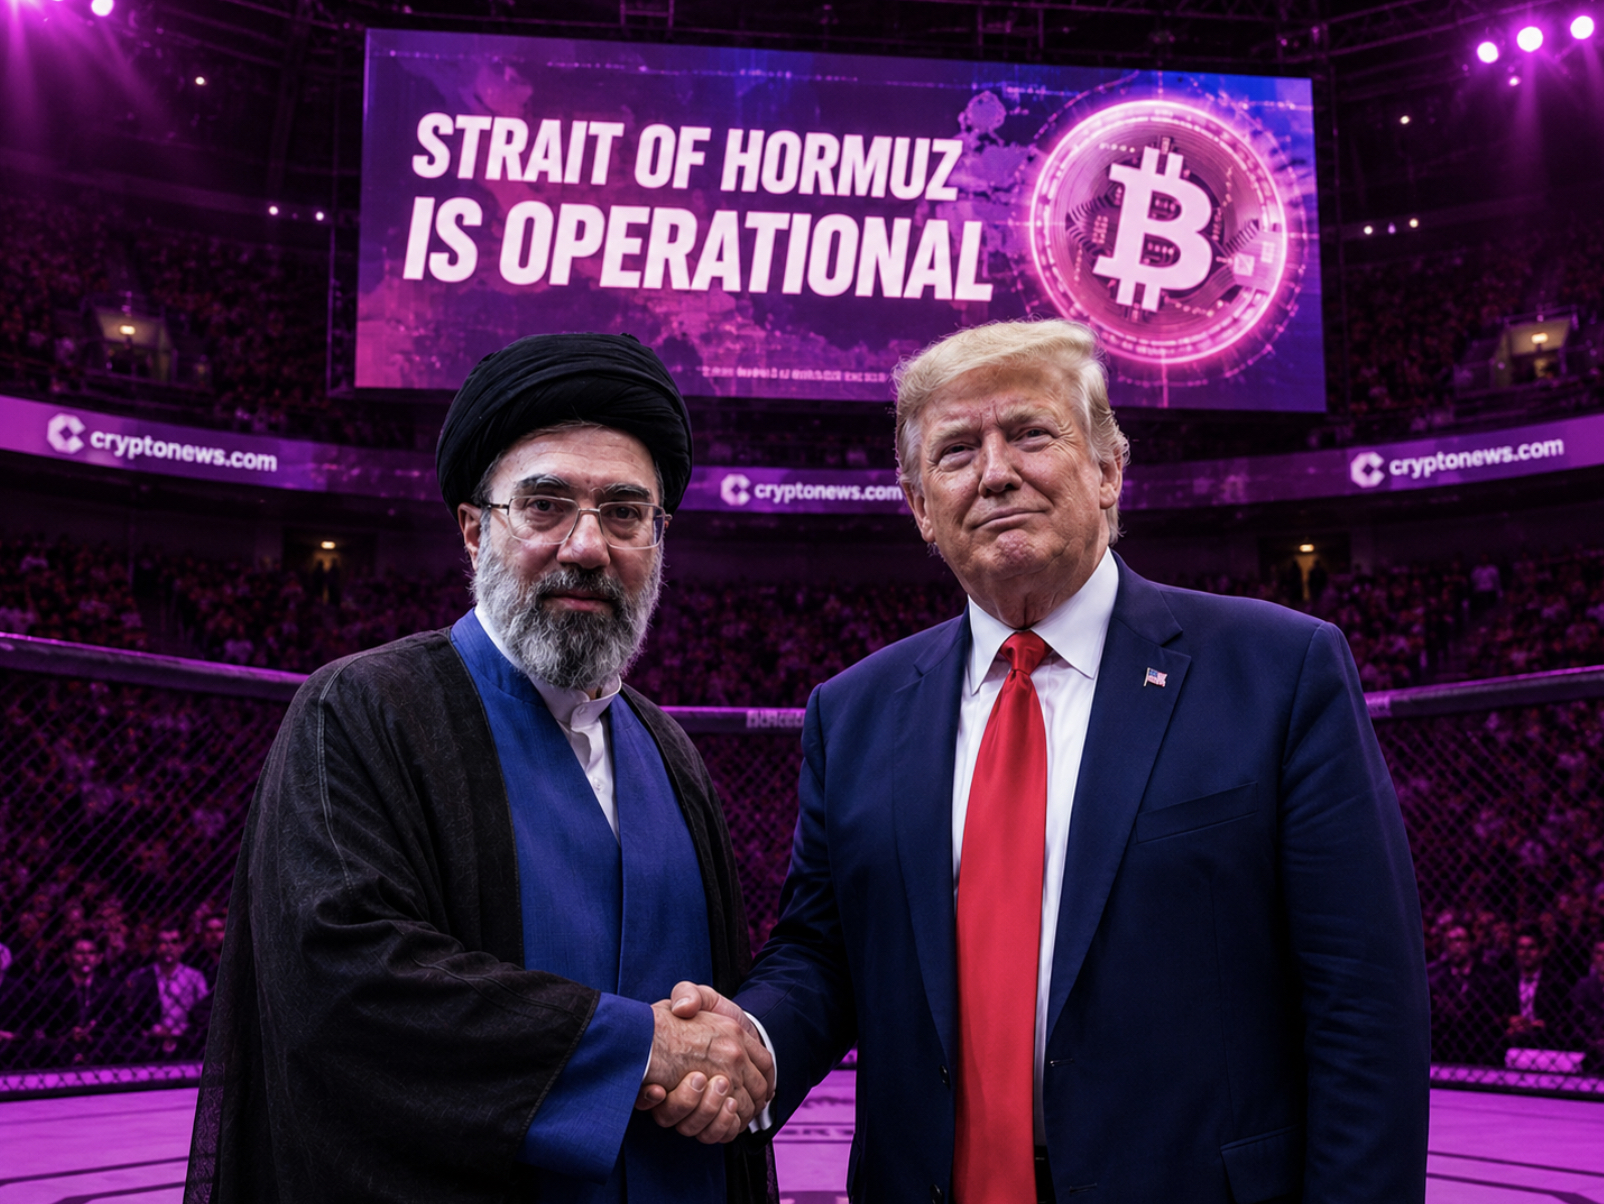
    The reported Trump-Iran peace agreement, which reportedly extends a ceasefire by 60 days, reopens the Strait of Hormuz, lifts the U.S. naval blockade on Iranian ports, and permits Iran to resume oil exports, appears to be driving Bitcoin’s ascent. Iran has also reaffirmed its commitment not to pursue nuclear weapons, with negotiations commencing over its enriched uranium stockpile under international supervision.

    The Four-Point Trump-Iran Peace Deal

    According to Senator JD Vance, the proposed deal includes the following provisions:

    • Preventing Iran from acquiring nuclear weapons.
    • Immediate reopening of the Strait of Hormuz.
    • Lifting the U.S. naval blockade.
    • Unlocking significant investment across the region.

    The agreement, announced by Iran today following repeated statements from Trump, could potentially re-establish global oil flows and represent the most significant de-escalation in the region since the conflict began. Oil prices saw a decline on the news, providing a clear boost to risk assets such as cryptocurrencies.

    The Iran deal propelled Bitcoin above the $65,000 level in under 30 minutes, coinciding with the Japan vs. Netherlands World Cup game. Trump’s consistent pressure and public commentary are credited with paving the way, as markets began to price in reduced geopolitical risk. Iran’s own announcement today further shifted the uncertainty, creating a bullish sentiment for the market.

    Japan’s Crypto ETF Preparations

    Japan’s Financial Services Agency (FSA) is reportedly preparing for the launch of spot cryptocurrency ETFs and investment trusts. Major financial institutions including SBI, Rakuten, Nomura, Daiwa, SMBC, and Mizuho are understood to be developing new products. The country currently has 13 million cryptocurrency accounts holding an estimated $34 billion, with potential tax reductions from 55% to 20%. Analysts project that the Japanese crypto ETF market could attract approximately $6.4 billion in inflows once launched.

    While the Bank of Japan’s recent interest rate hike could exert short-term pressure on risk assets by increasing borrowing costs, the forthcoming Japan crypto ETF launches are expected to act as a significant counterforce. These launches are anticipated to attract fresh institutional capital and lend greater legitimacy to the cryptocurrency sector. The combination of lower taxes and regulated products could accelerate both retail and corporate adoption.

    Trump Family’s Crypto Ventures and White House Event

    Meanwhile, in the United States, the current administration has spent months advocating for pro-crypto policies, supporting Bitcoin and Ethereum ETFs, and even exploring the concept of a Strategic Bitcoin Reserve. Concurrently, projects associated with the Trump family have continued to find avenues to capitalize on the industry’s growth. Through World Liberty Financial (WLFI), the family reportedly has exposure to token sales, stablecoin revenue, and speculative trading.

    While these activities do not inherently prove wrongdoing, they present a complex scenario where Trump is a prominent political advocate for cryptocurrency while also appearing to be a significant beneficiary.

    The White House UFC event serves as a notable example. Trump’s understanding of attention dynamics is well-established, and cryptocurrency markets are heavily influenced by it. The White House is hosting a UFC event where World Liberty Financial will contribute $250,000 in USD1 stablecoins to the UFC Freedom 250 fight-night bonus pool. The event is scheduled to take place on the White House South Lawn, coinciding with President Trump’s 80th birthday, and will feature USD1 branding within the Octagon.

    Regardless of the specific outcomes, Trump’s cryptocurrency ventures have reportedly performed well, while many retail investors have faced losses. This situation has led some observers to view the ecosystem less as a political movement and more as an “extraction machine.”

    Regulatory Developments and Market Movements

    Beyond the White House activities, the cryptocurrency industry continues to evolve. Binance, Coinbase, Kraken, and Crypto.com have delisted USDT for European Union users as the Markets in Crypto-Asset (MiCA) regulations come into effect. Tether’s decision to forgo the licensing process has created short-term challenges, though the market has largely perceived it as a regulatory hurdle.

    In parallel, Senator Cynthia Lummis remains a proponent of clearer cryptocurrency regulations, emphasizing the necessity of regulation to protect investors rather than solely benefiting the industry.

    Charles Hoskinson has also addressed controversy surrounding a 1,096 BTC payment linked to Cardano’s 2016 crowdsale audit. The Bitcoin, valued at less than half a million dollars at the time, is now worth approximately $70 million, a situation Hoskinson described as a “painful but necessary” operation.

    While markets are currently benefiting from easing geopolitical tensions, Donald Trump remains a dominant narrative in the cryptocurrency space. Bitcoin was envisioned to eliminate the need for powerful intermediaries. However, a significant bullish argument for crypto in 2026 appears to be the fact that the President of the United States has become one of its most effective promoters.

  • XRP Rally Fueled by Unexpected Exchange Activity

    XRP Rally Fueled by Unexpected Exchange Activity

    Ripple’s XRP Sees Price Rebound Fueled by South Korean Exchange Dominance

    Ripple’s (XRP) price has experienced a notable rebound, climbing from $1.11 to $1.18, a surge attributed to shifting wallet-flow trends, according to analytics firm CryptoQuant.

    Upbit Emerges as Key Driver

    South Korea’s largest cryptocurrency exchange, Upbit, has emerged as the dominant platform for XRP deposit-wallet activity among major exchanges. Data indicates that Upbit’s XRP Net Wallet Flow Dominance surged from 13% on June 7 to 31% by June 14, marking its highest point since May. This signifies a significant concentration of XRP deposit activity on the platform.

    Divergent Trends Across Major Exchanges

    In contrast to Upbit’s ascendance, several other prominent exchanges have witnessed a decline in their XRP deposit-wallet dominance during the same period. Coinbase, for instance, recorded the most substantial drop, falling from 27% on May 7 to 0% on June 14. This suggests a considerable weakening of deposit-wallet activity on Coinbase, or a relative strengthening of withdrawal activity.

    Binance also experienced a decrease in dominance, slipping from 16% to 13%, while Crypto.com saw its share fall from 9% to 3%.

    CryptoQuant highlighted this divergence, stating, “The takeaway is that XRP’s rebound is being driven by a divided flow structure.” This indicates that the recent price appreciation is not a result of evenly distributed activity across exchanges but rather a clear rotation of interest towards Upbit, with other major platforms moving in the opposite direction.

    Analyst Outlook on XRP Price Action

    Crypto analyst Egrag Crypto previously noted that bullish sentiment remains strong on lower time frames as long as XRP’s price holds above the $1.134-$1.14 range. The analyst identified $1.193 as the initial significant resistance level, with a potential move towards $1.26 if momentum continues to build. On the downside, $1.09 is considered the primary support level, and a breach below $1.05 could signal a more substantial correction.

    XRP ETFs Continue to Attract Inflows Amidst Broader ETF Outflows

    Despite a general trend of investors withdrawing funds from most cryptocurrency ETFs, spot XRP funds have continued to attract fresh capital. Data from SoSoValue reveals that XRP ETFs saw inflows of nearly $10.7 million over the past week. This stands in stark contrast to U.S. spot Bitcoin ETFs, which experienced significant outflows totaling $314.8 million, and Ethereum ETFs, which saw outflows of approximately $14.91 million.

  • XRP Price Surge: What’s Driving Today’s Rally and What’s Next?

    XRP Price Surge: What’s Driving Today’s Rally and What’s Next?

    Ripple’s XRP Surges Amid Geopolitical Deal Hopes and ETF Inflows

    The cryptocurrency market has seen a broad upturn since a significant announcement by U.S. President Donald Trump on Sunday evening, with some digital assets experiencing more pronounced gains than others.

    Ripple’s cross-border token, XRP, stands out, having appreciated over 3% on a daily basis. This performance outpaces Ethereum’s (ETH) 2.5% increase and Bitcoin’s (BTC) 1.9% rise.

    The primary driver for XRP’s notable recovery appears to be the deal announcement made by President Trump. Reports indicate that the President also authorized the toll-free opening of the Strait of Hormuz and the removal of the U.S. naval blockade. This agreement is anticipated to be finalized by the end of the week, with reports from Pakistan and India corroborating Trump’s statements. Positive geopolitical news typically garners a favorable reception in risk-on cryptocurrency markets, particularly benefiting larger-cap altcoins.

    However, additional factors may be contributing to XRP’s specific gains. Exchange-traded funds tracking its performance are reportedly bucking the broader ETF trend. These funds attracted over $10 million in the past business week, a stark contrast to the $15 million in net outflows from ETH ETFs and the more than $300 million withdrawn from Bitcoin ETFs.

    Furthermore, a report from CryptoQuant highlights a surprising shift in trading patterns. South Korea’s largest cryptocurrency exchange, Upbit, has emerged as the platform with the highest concentration of XRP deposit-wallet activity. CryptoQuant analysts suggest that XRP’s rebound is being fueled by a “divided flow structure.”

    Popular analyst Ali Martinez recently observed that the TD Sequential indicator had signaled a buy for XRP following its recovery above the $1.10 mark. He further noted that a breakout from the asset’s current symmetrical triangle pattern could potentially lead to an additional 14% price movement.

    Fellow analyst CW has identified the next key resistance levels should the token’s rally persist. The first significant hurdle is a sell wall at $1.25, followed by $1.40, an area where a substantial cluster of short positions is concentrated.

    Meanwhile, CRYPTOWZRD cautioned that XRP closed indecisively on Sunday, despite the late rally. Their analysis indicates that XRP needs to decisively reclaim the $1.18 level to unlock further upside potential. The cross-border token is currently testing this critical price point.

    XRP Daily Technical Outlook: $XRP closed indecisively and its intraday chart is trading within a range. Above $1.1800 will offer a long, but a rejection at this resistance will offer a short. Moving below $1.1000 will offer further decline pic.twitter.com/HkGXX2tpj6
    — CRYPTOWZRD (@cryptoWZRD_) June 15, 2026

  • XRP Poised for Significant Upside Surge

    XRP Poised for Significant Upside Surge

    XRP Price Eyes Further Gains Above $1.20 as Momentum Builds

    XRP has begun a steady ascent, surpassing the $1.1650 mark. The cryptocurrency is currently consolidating its gains and appears poised for further upward movement, potentially targeting levels above $1.20.

    XRP Price Aims for Fresh Increase

    Following a pattern seen in Bitcoin and Ethereum, XRP initiated a fresh upward trajectory, breaking through the $1.1450 and $1.150 thresholds. The digital asset then accelerated, achieving a decisive move above the $1.1680 resistance level. Bulls pushed the price towards the $1.1880 zone, establishing a high of $1.1926. XRP has since entered a consolidation phase, trading above the 23.6% Fibonacci retracement level of its recent climb from a swing low of $1.0879 to the $1.1926 peak.

    Currently, XRP is trading above $1.180 and the 100-hourly Simple Moving Average. A bullish trend line has formed on the hourly chart of the XRP/USD pair, with support identified at $0.140. Should XRP experience another upward surge, it may encounter resistance near the $1.1920 level. The first significant resistance lies around $1.1950, a break above which could propel the price to test the $1.20 zone. A clear breach of the $1.20 resistance could see XRP advance towards the $1.2150 resistance, with further gains potentially pushing it towards $1.2220. The next major hurdle for buyers is anticipated near $1.2250.

    Downside Correction?

    Conversely, if XRP fails to overcome the $1.20 resistance zone, a fresh decline could be initiated. Initial support on the downside is observed near the $1.1680 level. The subsequent major support is situated around $1.1550. A downside break and a close below $1.1550 could lead to a continued decline towards $1.1400, the trend line, and the 50% Fibonacci retracement level of the move from $1.0879 to $1.1926. Further down, the next significant support is located near the $1.1280 zone, below which the price could extend its losses towards $1.1120. The primary support level is seen at $1.080.

    Technical Indicators

    • Hourly MACD: The MACD for XRP/USD is currently gaining momentum in the bullish territory.
    • Hourly RSI (Relative Strength Index): The RSI for XRP/USD is trading above the 50 level.

    Major Support Levels: $1.1680 and $1.1400
    Major Resistance Levels: $1.1920 and $1.2000

  • XRP Funds Outperform Crypto ETF Downtrend

    XRP Funds Outperform Crypto ETF Downtrend

    XRP Funds Outperform Crypto ETF Market Amidst Broader Downturn

    In a market where most cryptocurrency exchange-traded funds are experiencing significant losses, spot XRP funds have consistently bucked the trend, attracting substantial new capital. This resilience stands in contrast to the underlying asset, XRP, which continues to trade below key support levels, though it has managed to remain above the crucial $1.00 psychological mark.

    Data compiled by SoSoValue reveals that XRP-tracking financial vehicles saw inflows of $7.44 million on Tuesday, followed by $1.19 million on Wednesday and $2.04 million on Friday. While Monday and Thursday registered no reported flows, the week concluded with over $10 million in net inflows. Notably, not a single day saw outflows, extending a positive streak that began on June 3, when the funds experienced a net outflow of $5.34 million.

    Consequently, cumulative net inflows for spot XRP ETFs have reached an all-time high exceeding $1.44 billion. While these figures do not match the peak enthusiasm seen following the funds’ launch last November, they represent a significant achievement in a challenging environment for other ETFs.

    In stark contrast, spot Bitcoin ETFs have endured a five-week losing streak, with investors withdrawing $315 million in the past week alone. Ethereum funds have faced a similar situation, with nearly $15 million pulled out despite a strong Monday performance. Even Solana ETFs have been in negative territory for two consecutive weeks.

    While spot HYPE funds have maintained a positive inflow streak, their $5.87 million in net inflows this past week fell short of XRP’s performance.

    Ripple’s native token, XRP, experienced a sharp decline to $1.05 on June 4-5 during a broader market crash. It came perilously close to falling below $1.00 for the first time in nearly two years but managed to hold the level. As of press time, XRP has recovered to $1.15.

    However, analysts remain cautious about the token’s immediate future. Ali Martinez recently projected potential price bottoms for Bitcoin, Ethereum, and XRP, suggesting that XRP could fall to a new low between $0.70 and $0.90.

    Despite these bearish forecasts, such a potential dip could present a significant buying opportunity. Both Martinez and EGRAG CRYPTO anticipate a substantial rebound, with projections pointing towards new peaks of $7.00-$8.00 or even higher.