Tag: Market Trends

  • Bitcoin Price Analysis: BTC’s Next Move After Falling Below $61K

    Bitcoin Price Analysis: BTC’s Next Move After Falling Below $61K

    Bitcoin Faces Intense Selling Pressure After Breaching Key Support Levels

    Bitcoin is currently experiencing significant selling pressure, having rapidly fallen below multiple critical support levels. A recent rejection from the descending 200-day moving average triggered a sharp sell-off, invalidating the prior rising channel and pushing BTC back towards a major demand zone around $60,000. Concurrently, on-chain data indicates that market participants are increasingly realizing losses, signaling a deterioration in investor sentiment.

    Bearish Breakdown Confirmed

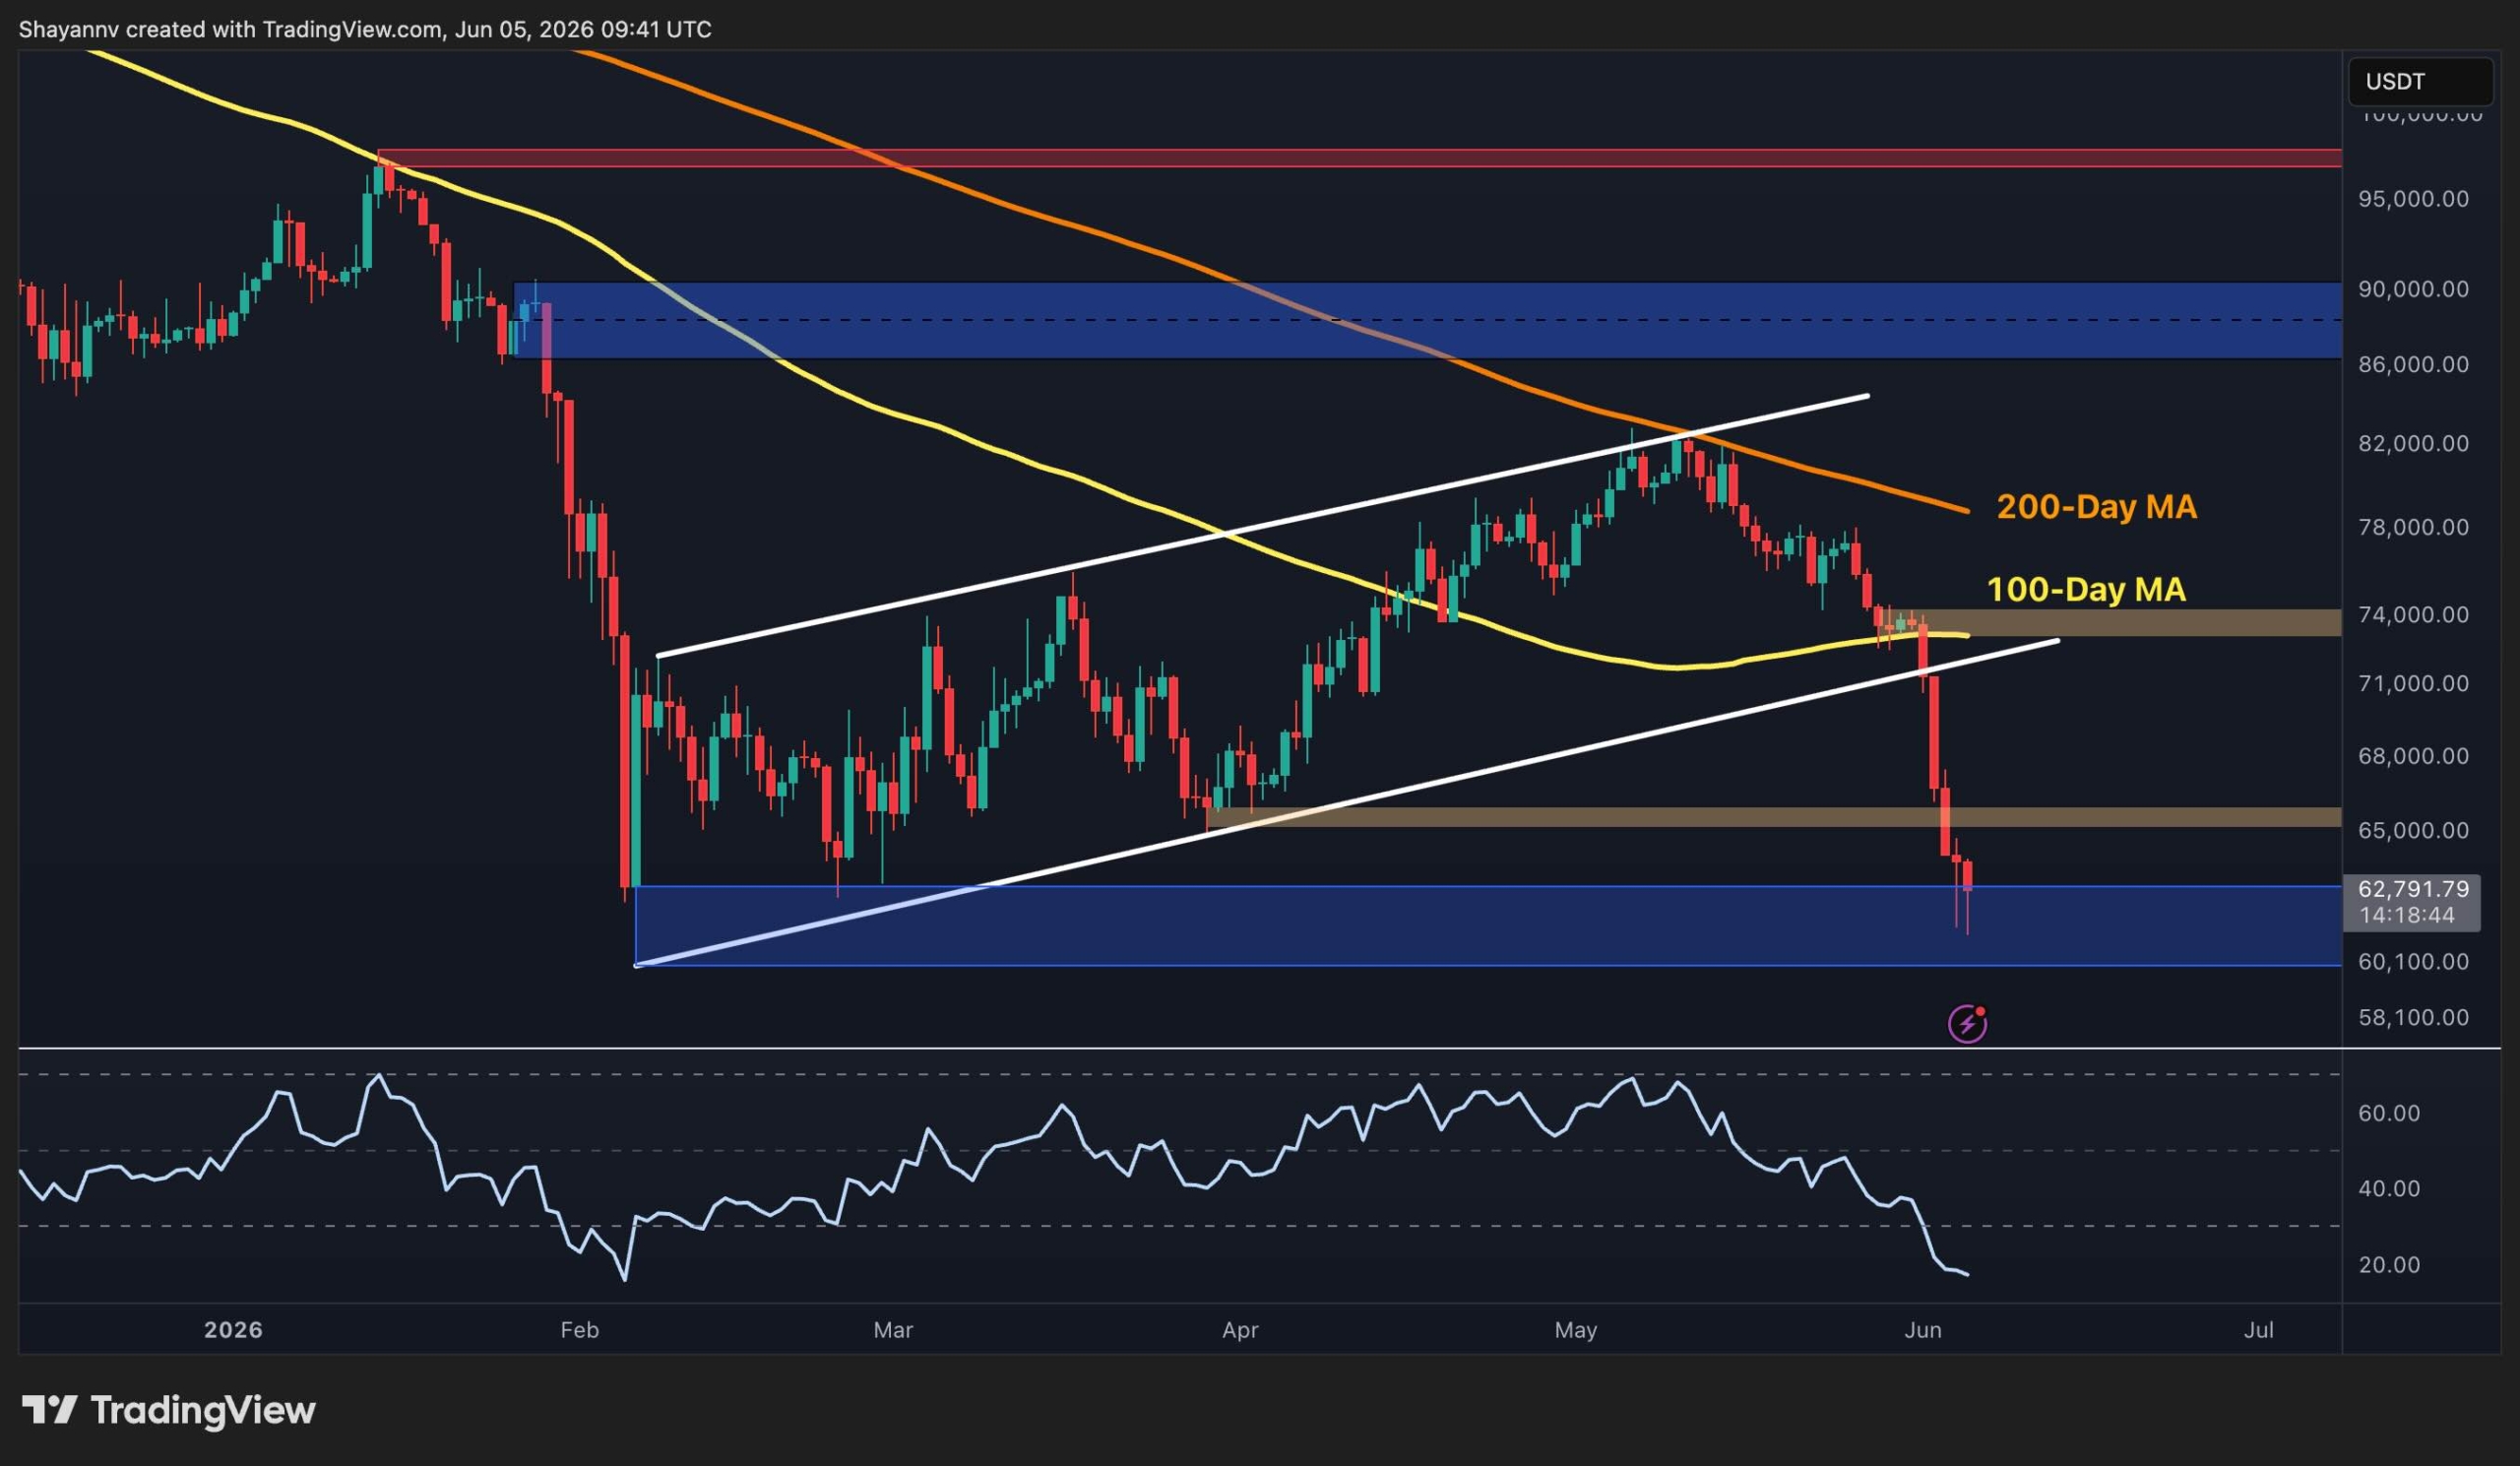
    On the daily chart, Bitcoin has confirmed a substantial bearish breakdown after dropping below both its ascending channel and the 100-day moving average, which had been situated near $74,000. This channel had previously supported the cryptocurrency’s recovery from February lows, but its recent violation suggests that buyers have lost control of the intermediate trend.

    The rejection occurred near the confluence of the channel’s upper boundary and the descending 200-day moving average, around the $82,000 mark. Since then, BTC has undergone an aggressive decline, slicing through the $74,000 support area and the significant low of $65,000 from late May with minimal resistance.

    The price is now testing a major support block at $60,000, a level that previously served as a strong rebound area following the February capitulation. This zone represents the last significant line of defense for bulls before the market potentially opens the door to substantially lower levels.

    Severity of Breakdown Evident on Shorter Timeframes

    The 4-hour chart underscores the severity of the recent breakdown. Following an extended period of consolidation near the $74,000 region, BTC failed to reclaim this level and subsequently broke below the lower boundary of the daily ascending channel that had supported price action for months.

    As the breakdown accelerated, the $65,000 support area also gave way, driving the price directly into the $60,000-$62,000 demand region. This area is currently acting as a floor, preventing further downside and has already attracted some buying interest.

    An important observation comes from the Relative Strength Index (RSI), which has formed a mild bullish divergence under extremely oversold conditions while the price has established fresh local lows. Although this signal is still in its early stages, it suggests that bearish momentum may be weakening in the short term and could support a temporary rebound towards the $65,000 resistance zone.

    However, from a structural perspective, the market continues to print lower highs and lower lows. As long as BTC remains below the broken support levels at $65,000 and $74,000, any recovery is likely to be viewed as a corrective move rather than the commencement of a new uptrend.

    On-Chain Data Signals Widespread Losses

    The Adjusted Spent Output Profit Ratio (aSOPR), a metric that measures whether coins moved on-chain are being sold at a profit or loss, is providing a significant signal regarding investor behavior.

    The chart indicates that the 30-day Exponential Moving Average (EMA) of aSOPR has fallen below the critical 1.0 threshold. Historically, readings above 1 signify that market participants are realizing profits on average, while values below 1 suggest that coins are being spent at a loss.

    The recent drop below 1 coincides with Bitcoin’s decline towards the $60,000 area and reflects growing capitulation among holders. This shift suggests that a larger proportion of investors are now exiting positions at a loss, a behavior commonly associated with bearish market phases and periods of weak confidence.

    While persistent readings below 1 often accompany downtrends, they can also signal the later stages of a corrective phase as weaker hands exit the market. Therefore, traders should closely monitor whether aSOPR can reclaim the 1.0 level. A recovery above that threshold would indicate renewed profitability across the network and could support broader market stabilization.

    For now, both price action and on-chain data continue to favor sellers, with the $60,000 support region remaining the key battleground that will likely determine Bitcoin’s next major directional move.


  • Bitcoin Dips Near $60K Amid Strategy Sell-Off; Zcash Faces Critical Vulnerability

    Bitcoin Dips Near $60K Amid Strategy Sell-Off; Zcash Faces Critical Vulnerability

    Crypto Markets Suffer Steep Losses as Bears Dominate

    The cryptocurrency markets endured a tumultuous week, largely dictated by a strong bearish sentiment.

    The preceding weekend saw a subdued trading environment, with Bitcoin (BTC) already having fallen to $74,000 from its May peak of nearly $83,000. However, the most significant downturn was yet to come. As the new business week and month commenced on Monday, Bitcoin experienced a rapid and sharp decline. It initially dropped towards the $70,000 mark. While this psychological level provided temporary support, it ultimately failed, leading to a swift deterioration of the market landscape.

    Cryptocurrencies continued to shed key support levels sequentially, with every attempt at a rebound being quickly suppressed. Bears appeared to be firmly in control throughout the week, including on Friday. Earlier in the day, BTC dipped below $62,000 once more, falling to $61,000. Within minutes, it rebounded to $63,000, a move that paradoxically fueled liquidations across the market before the asset was again rejected.

    The latest downward movement occurred just minutes ago, with Bitcoin slumping below $61,000 to reach a fresh four-month low. Consequently, the cryptocurrency has now lost well over $20,000 from its mid-May high and is currently struggling to maintain its position above the critical $60,000 support level.

    The weekly decline is stark and undeniable. Bitcoin has plummeted by 15% since this time last Friday and a substantial 26% over the past month. Its market capitalization has decreased by over $400 billion in recent weeks, now standing at $1.2 trillion according to CoinGecko. Even Bitcoin’s dominance over altcoins has weakened, despite many alternative cryptocurrencies experiencing similar or even more severe price drops.

    Among the notable decliners, Cardano (ADA) has fallen by over 30% following co-founder Charles Hoskinson’s announcement of a temporary break. Zcash (ZEC) saw a 41% drop after the discovery of certain technical vulnerabilities.

    Market Cap: $2.18T | 24H Vol: $138B | BTC Dominance: 55.7%
    BTC: $60,650 (-15.5%) | ETH: $1,600 (-17%) | XRP: $1.11 (-14%)

    Key Developments and Market Reactions

    Strategy Sold Bitcoin, But It’s Not What You May Think
    Bitcoin’s significant price struggles began shortly after Strategy announced its first sale of the cryptocurrency in years. Although the firm disposed of a very small portion of its Bitcoin holdings, the move triggered a notable reaction within the community and may have contributed to a significant downturn in overall market sentiment.

    Peter Schiff Warns Bitcoin Could Plunge Below $20K as Complacency Sets In
    In a widely anticipated commentary on X, Peter Schiff capitalized on Bitcoin’s price crash, predicting an even more dire scenario of a decline to $20,000 if the $50,000 support level is breached.

    Strive Doubles Down on Bitcoin With $185M Buy, Holdings Near 19,000 BTC
    In contrast to Strategy’s sale, Strive made its first purchase in a considerable period, expanding its Bitcoin holdings to nearly 19,000 BTC after a substantial $185 million acquisition.

    Arthur Hayes Dumps Entire Zcash (ZEC) Position After Major Flaw Emerges
    Shortly after news of Zcash’s technical issues gained traction on X, Arthur Hayes, a long-time supporter of the project, announced he had divested his entire ZEC position, citing significant uncertainty.

    Cardano (ADA) Faces Make-or-Break Moment as Social Buzz and Network Activity Explode
    Hoskinson’s break, coupled with ADA’s sharp price decline, has coincided with a surge in Cardano’s social media activity and network engagement, creating a pivotal moment for the project.

    Ethereum Crashing to 14-Month Low Is a ‘Screaming Buy-The-Dip Opportunity’ – Analyst
    Ethereum (ETH) was not immune to the broader market downturn, falling to consecutive 14-month lows, first below $1,800 and then to $1,600. However, some analysts view this significant price drop as a prime opportunity to buy the dip.

    This week’s analysis includes charts for Ethereum, Ripple, Cardano, Binance Coin, and Hyperliquid.

  • XRP Faces Critical Juncture: ‘Wick or Brick’ to Dictate Macro Trend

    XRP Faces Critical Juncture: ‘Wick or Brick’ to Dictate Macro Trend

    Crypto Markets Plunge, XRP Faces Critical Juncture

    Cryptocurrency markets have once again experienced significant turmoil, with Bitcoin falling to $61,000 this morning, a level not seen in four months. While some altcoins initially resisted the downturn, they have since followed suit, registering even steeper losses.

    Ripple’s XRP has not been spared. The digital asset, which traded above $1.55 just weeks ago, has seen a sharp decline following a rejection at higher levels. XRP plunged to just under $1.10 today, marking its lowest price point since before the U.S. presidential elections in late 2024.

    Analyst Foresees Potential for XRP’s Next Major Cycle

    Despite the current short-term volatility, a prominent analyst known as EGRAG CRYPTO has offered a broader perspective, suggesting that the current market movements could be the prelude to a significant shift.

    EGRAG CRYPTO pointed out that XRP is approaching a critical juncture that could determine its next major cycle. Drawing a parallel to early 2017, the analyst highlighted a historical pattern where XRP briefly dipped below a key structural support level, termed the “Bifrost Bridge,” before embarking on a substantial upward trend.

    This previous bull phase, EGRAG explained, was initiated by a sharp downside wick designed to purge less committed investors and reconfigure market positions.

    ‘Wick or Brick’ Scenario for XRP’s Future

    The analyst posed a crucial question: “Will we get another massive liquidity wick… or will price build a solid brick structure above support?”

    EGRAG CRYPTO predicted that a deep wick scenario could lead to a significant shakeout of weak hands, foster widespread fear, rapidly sweep liquidity, and establish a final macro reset. This aggressive downward move would challenge the broader market’s current positioning.

    Alternatively, EGRAG’s analysis presents a “brick” structure scenario. In this case, XRP would consolidate above key support levels, such as $1.00 and $1.10, gradually building a stable foundation. This outcome would indicate stronger accumulation and increased market confidence, potentially paving the way for an earlier upward continuation without the need for a dramatic price flush.

    Analyst Leans Towards a Final Emotional Move

    While acknowledging the prevailing uncertainty, EGRAG CRYPTO expressed a personal inclination towards the former scenario.

    “Personally…I still think the market wants one final emotional move before the real expansion,” the analyst concluded.

  • XRP Analyst Identifies Pre-Rally Signal

    XRP Analyst Identifies Pre-Rally Signal

    XRP Eyes Potential Surge as Rare Technical Signal Repeats

    XRP may be on the cusp of a significant price recovery, driven by a rare technical indicator that has historically preceded substantial rallies for the cryptocurrency. This signal, observed across multiple market cycles, is currently flashing again, prompting close attention from analysts.

    A Pattern Decades in the Making

    Analysis reveals that XRP’s price has been guided by a long-term ascending channel since 2017. The token is currently positioned just above the lower support boundary of this channel. This confluence of factors, coupled with a deeply oversold momentum reading, has captured the interest of market observers.

    The monthly Relative Strength Index (RSI) for XRP has dipped to 42.7, according to market commentator Celal Kucuker. This level is nearing the lowest points recorded in XRP’s trading history, a condition that has occurred only three times previously: in November 2015, March 2020, and August 2022. Each of these instances was followed by a notable upward price movement.

    Kucuker highlighted on social media that the monthly momentum indicator for XRP has reached similar extreme low zones before each major rally. The 2015 occurrence coincided with XRP trading within a symmetrical triangle pattern, with the price pulling back to around $0.0040 and the monthly RSI at 46.7, preceding the broad 2017 rally. In March 2020, amidst widespread market selling, the monthly RSI fell to 43.7, and XRP saw a low near $0.104 before climbing to $1.97 by April 2021. The third instance in August 2022 saw prices drop to $0.31 with the RSI at 43.9, ultimately leading to a rise to $3.40 by January 2025.

    What the Chart is Showing Now

    XRP has experienced a decline of over 10% in June alone, with the first four days of the month pushing the token to multi-month lows around $1.18. The past week saw a 9% decrease. Despite this selling pressure, reports indicate that XRP has maintained its position above the lower boundary of the ascending channel that has contained its price movements for nearly a decade.

    Kucuker’s analysis emphasizes that the current setup is distinguished by the simultaneous occurrence of two key conditions: the price holding at long-term structural support while the monthly momentum indicator has retreated to historically low levels. In previous cycles, momentum reached these depths either concurrently with the price bottom or just before a sustained recovery began.

    The Channel’s Upper End in Sight

    If historical patterns hold true, the initial price target would be the upper resistance line of the ascending channel. Reports suggest that each time XRP has tested the channel’s lower support, it has eventually trended towards the upper boundary.

  • HYPE Surges Amid Market Selloff as Whales Move $108M Off Exchanges

    HYPE Surges Amid Market Selloff as Whales Move $108M Off Exchanges

    HYPE Holds Strong Above $60 Amidst Market Selloff, Fueled by Institutional Accumulation

    HYPE is currently trading above the $60 mark, demonstrating remarkable resilience despite a recent market-wide selloff that has seen most cryptocurrency assets suffer significant losses. This relative strength has been further illuminated by data from Arkham Intelligence, which has uncovered a series of institutional-scale transactions in recent hours. These transactions appear to be transforming HYPE’s price stability from a noteworthy observation into a clearly documented behavioral signal.

    Institutional Withdrawals Signal Conviction

    Eight hours ago, three new wallets collectively withdrew 557,406 HYPE tokens, valued at approximately $40.2 million, from the Kraken exchange. Crucially, these tokens were immediately staked. This staking decision is a key differentiator from routine portfolio management, as tokens staked directly after withdrawal are committed to the network’s validator infrastructure rather than being positioned for immediate trading or sale. The intent behind this action is explicit.

    Six hours prior to that, another new wallet withdrew 180,000 HYPE, worth roughly $13.3 million, from Coinbase. This marks a second major exchange withdrawal concentrated within a compressed timeframe. In total, four new wallets were involved in four separate transactions, with over $53 million in HYPE withdrawn from Kraken and Coinbase – two of the world’s most regulated and scrutinized exchanges – within an eight-hour window. This occurred during a market downturn when most participants were moving in the opposite direction. The accumulation trend shows no signs of slowing, with new participants entering at new venues, exhibiting the same directional conviction that has characterized all documented institutional HYPE transactions in this series.

    Sustained Accumulation by a Single Wallet

    Arkham data also highlights the cumulative scale of activity from wallet 0x6436, which has been steadily accumulating HYPE since it first appeared in transaction flows three days ago. This address has now withdrawn a total of 761,357 HYPE tokens, valued at approximately $55.4 million, from exchanges over this compressed period. This represents a sustained, multi-session accumulation that has continued through the broader market selloff without interruption or reversal.

    The three-day timeframe is critical in distinguishing this activity from a large, one-off transaction. A single withdrawal could be attributed to rebalancing, custody migration, or other operational decisions that do not necessarily indicate a directional thesis. However, three consecutive days of withdrawals from exchanges, building a total exposure of $55.4 million, clearly describes a participant who has made a strategic decision regarding HYPE and is systematically executing against it, irrespective of broader market movements.

    The timing of this accumulation further strengthens the signal. The downturn in Bitcoin, the selling pressure across altcoins, and the general market uncertainty of the past week created an environment where most participants typically reduce exposure. Instead, wallet 0x6436 utilized this period to accumulate over $55 million in HYPE. When combined with the earlier mentioned withdrawals from Kraken and Coinbase within the same compressed window, the scale of institutional accumulation surrounding HYPE during this selloff has reached a level that the broader market may not have fully factored into the asset’s current valuation.

    HYPE Bulls Defend Key Support Levels

    HYPE is currently experiencing its first significant pullback after a powerful rally that propelled the token to new all-time highs near $75. The daily chart indicates a sharp rejection from this recent peak, with the price falling nearly 13% in a single session to close near $65. While this move appears substantial, it follows an almost uninterrupted advance from the $40 region in May.

    Despite this correction, the broader trend for HYPE remains decidedly bullish. The token is trading comfortably above its 50-day, 100-day, and 200-day moving averages, all of which are trending upward, confirming strong long-term momentum. The 50-day moving average, currently situated around $49, serves as the first major dynamic support level and remains well below current price action.

    Trading volume provides important context for recent price action. The rally to new highs was accompanied by a sustained increase in trading activity, suggesting genuine demand rather than a purely speculative surge. However, the recent selloff also saw elevated volume, indicating that some profit-taking has occurred following the parabolic advance.

    The critical area to monitor is the $64-$65 zone. This level coincides with the breakout region that initiated the final leg higher and is now acting as immediate support. If HYPE bulls successfully defend this area, the token could establish a higher low before attempting another move towards the $75 all-time high. A more significant correction would likely target the $58-$60 region, where previous resistance may now transition into support.

  • Crypto Options Expiry: Will Markets Plummet?

    Crypto Options Expiry: Will Markets Plummet?

    Bitcoin Options Set to Expire Amidst Market Downturn

    Approximately 26,000 Bitcoin options contracts, with a notional value of around $1.6 billion, are scheduled to expire on Friday, June 5. This expiration is smaller than last week’s end-of-month event, suggesting a limited impact on spot markets.

    The cryptocurrency market has experienced a significant downturn this week, with over $300 billion erased as Bitcoin weakens and altcoins like Ether face substantial losses. This decline occurs against a backdrop of ongoing military tensions between the U.S. and Iran, persistent global inflationary pressures, and a seemingly elusive diplomatic resolution.

    Options Expiry Details and Market Sentiment

    The current batch of Bitcoin options contracts exhibits a put/call ratio of 0.56, indicating a greater number of long contract sellers compared to short contract sellers. According to Coinglass, the maximum pain point is situated around $71,000, a level considerably higher than current spot prices, suggesting that a majority of these contracts may expire out-of-the-money.

    Open interest (OI) for Bitcoin options, representing the value or number of contracts yet to expire, remains highest at the $80,000 strike price on Deribit, totaling $1.6 billion. However, short sellers maintain a significant presence with $1.1 billion in OI at the $60,000 strike price. Overall BTC options OI across all exchanges has been declining, currently standing at $31.6 billion, as reported by Coinglass.

    Bitcoin spot is trading approximately $8,000 below the maximum pain level following a challenging week that saw $1.5 billion in liquidations and a brief dip below $62,000. Deribit noted that the market’s positioning is heavily skewed towards call options.

    Crypto derivatives provider Greeks Live observed that “With the price breaking below $70K, bears have become more aggressive, with significant increases in put positions at $68K, $65K, and $60K.”

    Ethereum Options Also Expiring

    In addition to Bitcoin options, approximately 153,500 Ethereum contracts are also set to expire, carrying a notional value of $266 million. The maximum pain point for Ether options is at $2,000, with a put/call ratio of 0.97. Total ETH options OI across all exchanges is approximately $5.7 billion.

    The combined notional value of all crypto options expiring today amounts to roughly $1.85 billion, marking a relatively modest event.

    Broader Market Collapse

    This week has been the most severe for cryptocurrency markets since early February, with the total market capitalization plummeting to a four-month low of $2.26 trillion.

    Bitcoin reached a low of $61,300 on Thursday and has shown little recovery above this level as of Friday morning. The asset remains more than 50% below its all-time high and is currently trading at the lower boundary of its range-bound channel, where significant support is located.

    Ether has experienced a sharp decline, hitting a 14-month low of $1,730, its current trading level. Further losses appear probable as the weekend approaches, potentially ushering in another red period for digital assets.

  • XRP Wave Structure Emerges: What’s Next?

    XRP Wave Structure Emerges: What’s Next?

    XRP Enters Critical Juncture as Wave Structure Nears Completion

    XRP has entered a pivotal stage as a long-anticipated wave structure, closely tracked by traders for months, finally begins to materialize. With increasing volatility and crucial price levels on the horizon, the cryptocurrency’s next movements could offer significant insights into whether XRP is nearing a bottom or poised for another downward leg before a sustained recovery can commence.

    Breaking Key Support as Long-Awaited Setup Unfolds

    According to analysis from CasiTrades, the cryptocurrency market is exhibiting the selling pressure that many analysts have predicted for months. Consequently, XRP has begun to fall below a key support level, indicating that the current correction may be entering a more decisive phase.

    The analyst explained that the development of smaller subwaves has been under close observation to ascertain whether the market’s ultimate downside target would be around $1.10 or the $0.87 support zone. Based on the current structure, CasiTrades believes XRP is forming a subwave 3 decline, a phase typically characterized as the strongest and fastest part of an Elliott Wave correction. Such waves often accelerate downside momentum, rapidly driving prices toward significant support areas.

    From a technical perspective, the 1.618 Fibonacci extension of the current move suggests a target near $0.92. This level sits just above the long-discussed $0.87 support zone, reinforcing the notion that XRP could be approaching a critical juncture.

    XRP’s Projected Roadmap: Drop, Bounce, Then One Final Test

    CasiTrades’ current market roadmap for XRP outlines an anticipated trajectory comprising three distinct phases. The initial expectation is a sharp move downward toward the $0.92 level, followed by a relief bounce back toward approximately $1.20, which is projected to act as resistance. This path concludes with a final downward move aimed at testing the critical $0.87 support zone.

    However, it is crucial to acknowledge that market behavior rarely aligns perfectly with theoretical projections. While this three-wave sequence represents the primary expectation, there is a distinct possibility that the market could deviate from this path. If the reaction from the W3 low demonstrates sufficient force, there is a viable chance that XRP may not require a final wave to reach the $0.87 support. The earliest indication of this scenario would be the price reclaiming key resistance levels and decisively breaking above $1.30 with clear strength.

    “We have spent the last four months monitoring the market as this specific structure developed, and we are finally arriving at the most critical phase,” CasiTrades stated. “As we approach these pivotal levels, the upcoming price action will be decisive in determining whether the correction concludes early or proceeds to its final intended target.”

  • Worldcoin Surges 60% Amid Crypto Slump, Analysts Eye More Gains

    Worldcoin Surges 60% Amid Crypto Slump, Analysts Eye More Gains

    Crypto Market Downturn Fails to Dampen Worldcoin’s Surge

    The cryptocurrency market has been firmly in the grip of a bearish trend, with prices for major digital assets like Bitcoin (BTC), Ethereum (ETH), Ripple (XRP), Solana (SOL), and Cardano (ADA) experiencing significant declines. However, a select few tokens have managed to buck the trend, with Worldcoin (WLD) standing out as a notable performer.

    Worldcoin’s Impressive Weekly Gains

    Just hours ago, Worldcoin’s price briefly surpassed the $0.55 mark, reaching its highest level since January. While it has since pulled back to approximately $0.48, according to CoinGecko, this still represents a remarkable 60% increase over the past week. The token’s market capitalization has now exceeded $1.6 billion, positioning WLD as the 51st-largest cryptocurrency by market value.

    Whale Activity Fuels Worldcoin Rally

    A primary driver behind Worldcoin’s recent surge appears to be increased activity from large investors, often referred to as “whales.” The X account BSCN reported that transactions exceeding $100,000 involving WLD have reached their highest point this year. The platform also noted that growing accumulation, rising network activity, and an anticipated reduction in token emissions have contributed positively to the token’s performance.

    Analyst Optimism and Price Targets

    Several prominent analysts have expressed bullish sentiment towards Worldcoin. X user Crypto Tony identified WLD as one of the “strongest” altcoins, forecasting a potential rise to $0.63 if the price can maintain support at the $0.45 level. Other analysts, including Altcoin Sherpa and Crypto Catalysts, have also weighed in. Altcoin Sherpa suggested a target of $0.65, contingent on Bitcoin’s stability, while Crypto Catalysts highlighted WLD’s resilience amid the broader market downturn and predicted a possible ascent to $2.

    Arthur Hayes, co-founder of BitMEX and CIO of Maelstrom, has set an ambitious future price target of $10 for Worldcoin. He controversially described the token as a “shitcoin” destined for significant gains due to its association with the burgeoning Artificial Intelligence (AI) sector.

    Technical Indicators Signal Caution

    Despite the positive momentum, some technical indicators suggest that Worldcoin’s rapid ascent may be followed by a pullback. The token’s Relative Strength Index (RSI) has recently surged past 70, indicating that WLD has entered overbought territory. This suggests a potential for a correction, as the RSI typically ranges from 0 to 100, with readings above 70 often signaling an asset is due for a price decrease.

    Skepticism Amidst the Hype

    Not all market observers are optimistic about Worldcoin’s prospects. X user Ryker has labeled the project a “dead project” that is merely capitalizing on the AI trend, drawing parallels to NEAR. This analyst expressed low expectations for WLD, citing a perceived lack of development from the team behind the token.

  • Musk’s XRP Prediction: 2026 Boom or Bust?

    Musk’s XRP Prediction: 2026 Boom or Bust?

    Grok AI Offers Stark XRP Price Prediction, Targeting $3-$5 by 2026

    Elon Musk’s AI, Grok, has issued a blunt assessment of XRP’s recent price correction, describing it as “brutal and steep.” However, the AI is equally direct about its end-of-2026 price target, projecting a realistic bull range of $3 to $5, with high-conviction scenarios potentially reaching $7 to $8 and beyond, from its current trading price of $1.18.

    Four Converging Forces Fueling the Forecast

    Grok’s optimistic outlook is not based on speculation but on the convergence of four key forces that have been developing concurrently as XRP’s price has stagnated.

    Bitcoin’s Resurgence and Market Beta

    A recovery in Bitcoin towards new all-time highs is expected to lift the broader cryptocurrency market. Historically, XRP has demonstrated significant beta, meaning it tends to outperform when the market experiences such upward momentum.

    Regulatory Clarity on the Horizon

    The anticipated finalization of regulatory frameworks for cryptocurrencies, including stablecoins and market structure, is poised to remove significant overhangs. This clarity is expected to alleviate institutional caution, paving the way for larger-scale capital deployment.

    Ripple’s RLUSD Driving Utility and Demand

    Ripple’s stablecoin, RLUSD, is reportedly gaining traction for cross-border payments and settlements. This growing utility is translating into a revenue story for Ripple, directly boosting transaction volumes on the XRP Ledger and increasing demand for XRP as the essential bridge asset in these transactions.

    ETF Inflows and Structural Demand

    A potential return of institutional demand through Exchange-Traded Funds (ETFs) would provide the structural institutional buying power necessary to transform current narratives into sustained market trends.

    A Market Pricing in the Worst

    Grok suggests that the market has been pricing in worst-case scenarios for months, largely disregarding positive developments while amplifying every macroeconomic headwind. When this sentiment cycle reverses, assets with strong fundamental cases are expected to experience the most significant and rapid gains. XRP’s combination of regulatory clarity, real-world utility, and established infrastructure for institutional access positions it as a prime candidate for such a reversal within the altcoin market.

    The Bear Case: Bitcoin’s Downside Risk

    The immediate threat, according to Grok’s analysis, lies in the potential for a Bitcoin breakdown below $60,000. Such a move would likely drag XRP below the $1.00 mark for the first time in years. While Grok acknowledges that RLUSD’s utility offers a stronger support floor than in previous cycles, it does not dismiss the sub-$1.00 scenario as impossible, especially given Bitcoin’s current position.

    Technical Analysis: A Precarious Support Level

    XRP closed the current week at $1.191, with a weekly low of $1.140. The weekly chart, dating back to 2023, reveals a pattern not seen since before the significant institutional repricing began. The pre-breakout base from 2023 to October 2024 saw XRP trade between $0.40 and $0.70 for over a year. The subsequent vertical move to $3.40 in November 2024 originated from a base of $0.55. Currently, a dotted support line on the chart sits around $1.20, a level XRP has defended since February 2026.

    This week’s trading saw the weekly candle dip below this crucial line intraweek, with the $1.140 low testing a gap between $1.00 and $1.20 that lacks substantial structural support. The recovery to $1.191 at the weekly close keeps XRP marginally above the $1.20 level, but the thin margin leaves it vulnerable to a single negative macroeconomic event next week that could push the candle decisively below this floor.

    The $1.00 Threshold: A Critical Juncture

    The $1.00 level represents the final psychological and structural barrier before XRP is priced out of its post-settlement premium. A weekly close below this mark would signify a complete unwinding of the regulatory clarity narrative that dominated late 2024, validating Grok’s bear case tied to a Bitcoin breakdown below $60,000.

    Upside Resistance Levels

    On the upside, the first significant resistance is now at $1.40, a level that previously served as support for months before this week’s breakdown. Above that, $1.60 represents a zone where the market consolidated for much of March and April. Clearing $1.60 on a weekly close is considered the minimum requirement before any discussion of the $3 to $5 target becomes technically credible.

    The critical question for XRP holders over the next three months is whether the current extreme price action marks a capitulation bottom, serving as the starting point for Grok’s $3 to $5 prediction, or if prices will continue to decline towards $0.25 as Bitcoin tests $60,000.

    The Case for Early-Stage Infrastructure Plays

    The article then pivots to discuss the strategy of “smart money,” which is characterized by moving before an opportunity becomes obvious, rather than waiting at resistance levels. Bitcoin, Ethereum, and XRP are currently trading within established bands, with macro catalysts and institutional inflows being repeatedly delayed. Waiting for external catalysts is presented as a strategy with a visible ceiling.

    In contrast, early-stage infrastructure plays are highlighted for their lack of such a ceiling. Their smaller market capitalization means that even modest capital rotations can lead to dramatic price movements. The significant gap between a project’s intrinsic value and its current market perception is where asymmetric returns are generated, a gap that typically exists only while a project remains relatively undiscovered.

    LiquidChain: Addressing Multi-Chain Fragmentation

    The piece introduces LiquidChain as a solution to the daily bleeding of DeFi due to multi-chain fragmentation. It notes that Bitcoin, Ethereum, and Solana operate with isolated liquidity systems, imposing costs on users who move value between them through fees, slippage, and failed transactions.

    LiquidChain aims to consolidate these disparate systems into a single execution layer, enabling one deployment and full ecosystem access without a “cross-chain tax.” The presale is currently priced at $0.01454, with over $700,000 raised, described as a “ground floor” opportunity.

    However, the article cautions that LiquidChain’s execution is unproven and its adoption is unknown. While established assets offer a more predictable path with a visible ceiling, LiquidChain presents an opportunity to get in on the ground floor of a project that has yet to establish itself.

  • XRP Faces Steep Drop If Support Fails

    XRP Faces Steep Drop If Support Fails

    XRP’s four-month trading range, characterized by fluctuating highs and lows that kept both optimistic and pessimistic investors engaged, is now facing significant pressure. The cryptocurrency has retreated to the precise support level that underpinned its range lows throughout this period of consolidation. A failure to hold this support could dictate XRP’s next major directional move.

    XRP Returns to Range Low

    Analysis of XRP’s daily candlestick chart reveals the cryptocurrency is currently entrenched within a consolidation range that has been developing since February 2026. The upper boundary of this range, which has repeatedly capped rallies since February, sits around $1.55. The lower boundary, meanwhile, has been established in the $1.26 to $1.28 area.

    According to an analysis shared on social media platform X by crypto analyst ‘Guy on the Earth,’ XRP was trading near $1.279, almost directly on this lower boundary, at the time of the post. However, the token has since fallen further, now trading around $1.16.

    The loss of this support is noteworthy because the range low had previously served as a clear technical level on the chart. XRP had shown reactions from this area during earlier pullbacks in March and April, suggesting it was a point where buyers were expected to defend the structure once more.

    However, the current situation presents a different outlook. A weekly close below this range would undermine that expectation and signal that the months-long sideways movement has concluded, with sellers now in control.

    Downside Scenarios: From $1.10 to $0.63

    Analyst Guy on the Earth, whose chart forms the basis of this analysis, posited that a breach of the current support zone would set XRP on a path toward $1.10, a level just below the lowest wick recorded in early February. This scenario appears to be materializing, as the cryptocurrency is now trading below the range floor, having declined by 6.1% in the past 24 hours.

    The more critical question is the extent of a sustained breakdown beyond $1.10. If range support is lost and a deeper correction takes hold, the most probable bottom zone is estimated to be between $0.75 and $0.95.

    Analyst Crypto Patel, offering an independent perspective on X, identified the $1.10-$1.30 range as a current accumulation zone. He suggested that if this support breaks, buying opportunities between $0.65 and $0.85 could represent a “generational entry.” While such a range would be challenging for current holders, it could still align with a broader bullish market pullback, allowing XRP to stabilize and resume an upward trend. The most bearish scenario outlined in the analysis places a potential bottom around $0.63, which would imply XRP retracing nearly all of its bull market gains since late 2023 before finding durable support.