Tag: Market Trends

  • XRP Volatility Spikes: What’s Driving Today’s Price Swings?

    XRP Volatility Spikes: What’s Driving Today’s Price Swings?

    XRP Price Swings Create Uncertainty, Traders Eye Key Levels

    XRP is currently trading above $1.40, having experienced intraday fluctuations between $1.37 and $1.45, a volatility that has left its own price predictions in question. The digital asset appears to be in a real-time struggle for direction. The central question for traders is not XRP’s immediate position, but whether this choppiness signals the exhaustion of a recent rally or the prelude to further gains.

    This price action follows an overheated surge in August, where XRP saw gains exceeding 50% in a single week. Buyers ultimately failed to sustain the $1.45–$1.55 resistance zone, triggering a wave of liquidations as leveraged positions were unwound.

    Despite the derivatives market recalibrating, network activity data suggests continued institutional interest in spot XRP ETF products and an increase in ledger transfer volumes remain supportive. The MACD indicator is flashing a buy signal at 0.069 (12,26,9), while the RSI at 72 hovers in slightly overbought territory. This comes after the RSI had previously signaled an overbought condition just days ago, prompting caution among short-term traders.

    Broader macroeconomic factors, such as expectations surrounding Federal Reserve interest rate decisions and stable Treasury yields, have maintained a generally positive risk appetite across the cryptocurrency market. This provides a favorable backdrop, but the critical question now is whether XRP’s technical structure can hold firm to capitalize on these conditions.

    Technical Outlook and Key Levels

    XRP is trading around the $1.45 mark, with its intraday range narrowing between $1.38 and $1.45. Trading volume has increased alongside the recent bounce, which appears to be driven more by short covering than by fresh accumulation. This suggests that further observation is warranted before declaring a definitive trend reversal.

    Immediate resistance is observed at the $1.41–$1.45 level, a zone that XRP has encountered repeated rejections from this week. A daily close above $1.45 would significantly improve the technical outlook, potentially paving the way for a move towards $1.55 and subsequently $2.00 if momentum continues. Support is holding near $1.36, with more substantial demand identified at $1.28 and the crucial $1.00–$1.05 zone, which has historically supported XRP during major pullbacks in 2026.

    Potential Scenarios

    In an optimistic scenario, XRP would need to reclaim the $1.45 level, with sustained ETF inflows and momentum carrying the price towards the $1.55–$1.65 range. Alternatively, the asset could continue to trade within a range between $1.36 and $1.45 as leverage continues to reset.

    Conversely, a bearish outlook would emerge if XRP breaks below the $1.28 support level, potentially retesting the $1.00 floor. This risk would be amplified if selling pressure related to escrow releases resurfaces. Traders seeking confirmation of any directional move should monitor for expanding volume during breakout attempts.

    Broader Market Considerations

    While XRP holders experiencing the current bounce have grounds for optimism, with a 50% daily gain being a notable achievement, it’s important to note that at a market capitalization exceeding $80 billion, a move from $1.45 to $2.00 represents a solid trade rather than a life-altering one.

    This mathematical reality is precisely why traders with remaining risk appetite are exploring earlier-stage projects with potentially higher upside.

    Emerging Opportunities

    One such project gaining attention is Maxi Doge ($MAXI), a meme token focused on leveraged trading culture rather than a derivative of existing popular themes. Its presale has reportedly raised $4.8 million, with the current price at $0.0002835. The platform also offers dynamic APY staking at 65% for holders.

    Key features of Maxi Doge include holder-exclusive trading competitions with leaderboard rewards and a “Maxi Fund” treasury designated for liquidity and partnerships, an infrastructure element often overlooked in many meme coin launches. Investors are advised to conduct their own research into Maxi Doge before the presale concludes.

  • Robinhood Chain Surges on Meme and RWA Boom

    Robinhood Chain Surges on Meme and RWA Boom

    Robinhood Chain Surges on Meme Coins and Real-World Assets

    Robinhood Chain is experiencing a significant upswing, propelled by a surge in meme coins and real-world assets (RWAs). The blockchain platform recorded its strongest day since mid-July, with approximately $443 million in decentralized exchange (DEX) volume, over 3 million transactions, and active wallets exceeding 115,000. This represents a threefold increase in volume from the early August low of around $140 million.

    The performance of associated tokens mirrored this trend. StonkBroker, Index, HMM, TENDIES, Juggernaut, and YOLO all closed in positive territory, while the newly launched Biscotti rapidly achieved a $10 million market capitalization within hours. Notably, all of the top eleven tokens by market capitalization on the chain are less than two months old.

    A substantial driver of this growth is the increasing adoption of RWAs. The total value of real-world assets on the chain has reached $41.9 million across 202 tokenized assets. On Monday, net on-chain RWA flows surged to approximately $85 million, marking the highest single-day figure since the chain’s launch. This contrasts with $12.8 million recorded in mid-July.

    Robinhood CEO Vlad Tenev acknowledged the innovative developments occurring on the chain. Speaking on The Iced Coffee Hour podcast, Tenev highlighted how developers are creating novel products that the company had not anticipated, integrating meme coins, core cryptocurrency functionalities, and stock tokens. He cited an example where users holding a meme coin could receive stock tokens as an airdrop, a feature characteristic of the Stonkbrokers ecosystem, with similar functionalities also appearing in AI-related projects. Tenev’s comments suggest he is closely monitoring the chain’s evolving landscape.

    Looking ahead, the trajectory for Robinhood Chain appears to be upward, despite the potential for a market correction after a period of parabolic growth. A key indicator to watch will be the next token listing on Robinhood, following the recent addition of Cashcat. Such a listing would not only signal continued token onboarding but also provide insights into Robinhood’s preferred sectors, whether they be memes, utility tokens, or infrastructure projects. As long as Tenev and his team continue to support the ecosystem, its potential for growth seems considerable.

  • Block Scholes Research Highlights Liquidity Dynamics of Tokenized RWA Futures on Bitget UEX

    Block Scholes Research Highlights Liquidity Dynamics of Tokenized RWA Futures on Bitget UEX

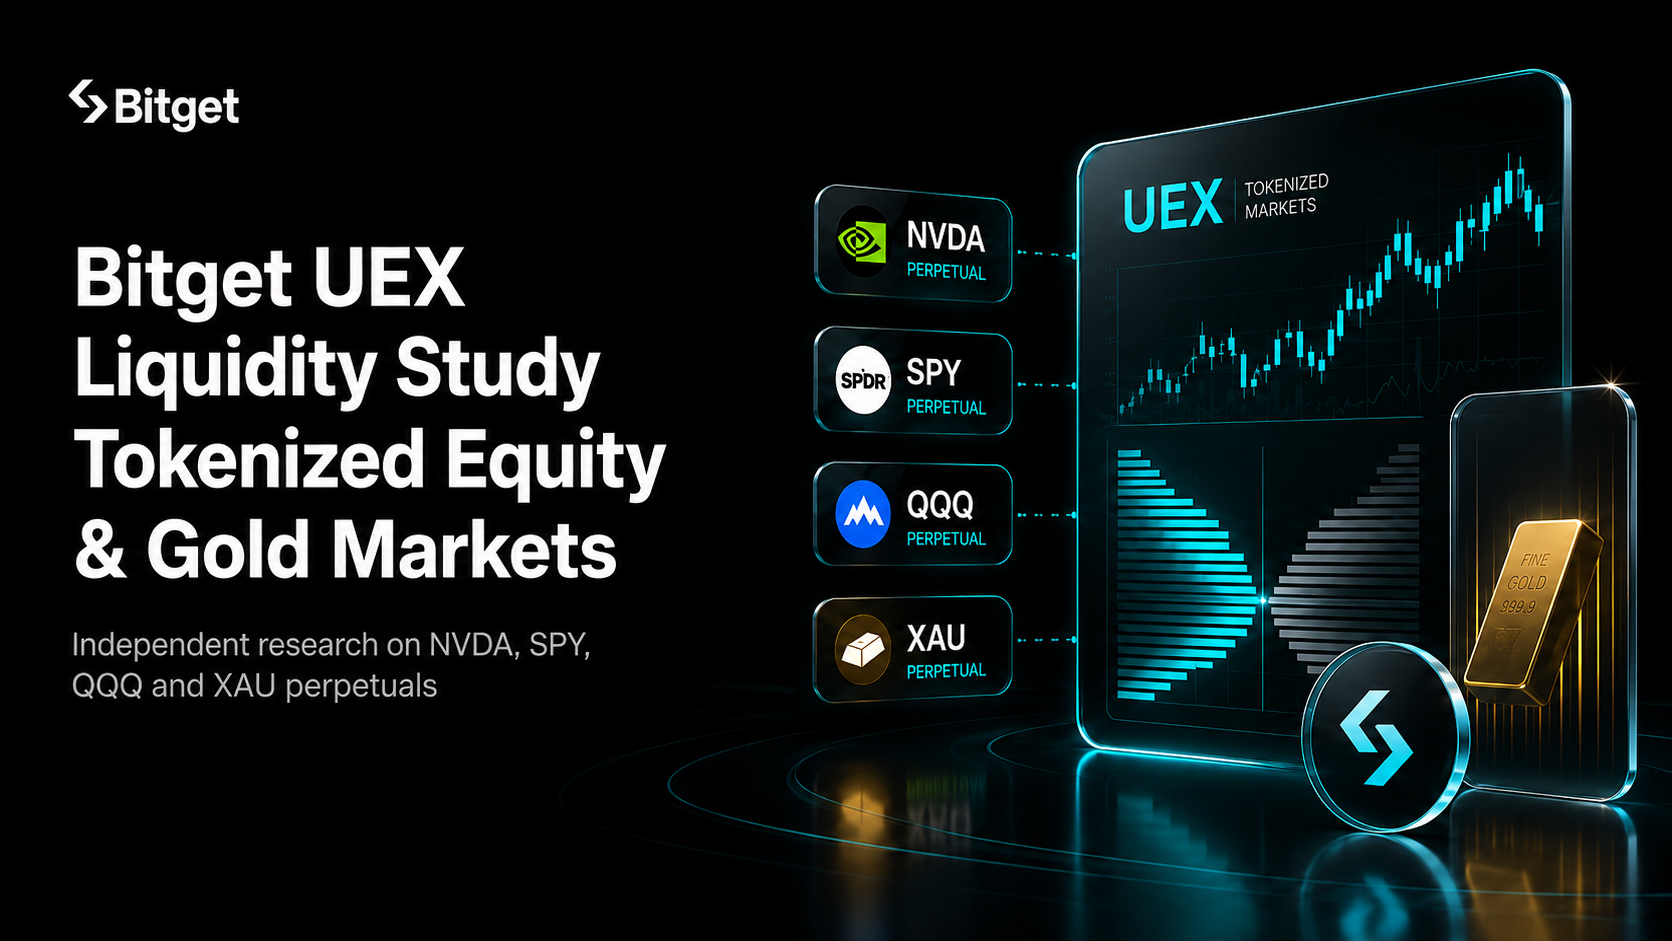
    Independent research by Block Scholes has analyzed the liquidity conditions of tokenized real-world asset (RWA) perpetual futures on Bitget UEX, offering insights into trading dynamics for these instruments. The study, which examined data up to May 2026 and events from February 2026, focused on contracts tracking gold (XAU-USDT), the SPDR S&P 500 ETF (SPY-USDT), Nvidia (NVDA-USDT), and the Invesco QQQ Nasdaq-100 ETF (QQQ-USDT).

    Key Findings on Liquidity

    According to the report, liquidity for these tokenized RWA perpetual futures generally improves within active trading sessions. Block Scholes measured order-book depth, bid-ask spreads, and slippage. By mid-May 2026, the resting liquidity on Bitget UEX’s Nvidia-tracking contract approached approximately three-quarters of the depth observed on Bitget’s BTC/USDT spot market. On May 18, 2026, top-of-book spreads were notably tight, recorded at around 0.02 basis points for gold, 0.14 basis points for both SPY and QQQ contracts, and 0.44 basis points for the NVDA contract. This indicates that less than half a basis point separated the best bid and best ask for three of the four instruments at that time.

    Intra-day analysis revealed significant improvements. For instance, SPY’s spread narrowed from 1.76 basis points at the market open on May 18, 2026, to 0.14 basis points within an hour. Similarly, slippage for a modeled $100,000 market buy order on the SPY contract decreased from 14.88 basis points at the open to 10.66 basis points an hour later. Larger orders also saw improvements, with a $500,000 order experiencing a reduction in slippage from 46.07 basis points to 24.90 basis points over the same period.

    Weekend Trading and External Event Impact

    The research also shed light on trading behavior outside traditional market hours. Block Scholes measured a substantial decrease in trading volume for these RWA perpetuals on weekends, ranging from 65% to 90% compared to weekday levels, depending on the contract. However, median bid-ask spreads remained relatively stable, staying close to weekday levels. Across the sampled week, these weekend spreads were approximately 0.02 basis points for gold, 0.8 for QQQ, 1.0 for NVDA, and 1.3 for SPY.

    Block Scholes examined the impact of external events on liquidity, noting that geopolitical developments could cause temporary disruptions. Following the announcement of U.S. strikes against Iran on February 28, 2026, spreads widened across all four contracts. For example, the NVDA contract’s spread increased from a baseline near 0.6 basis points to a peak of 3.4 basis points. However, Block Scholes found these widening effects to be brief, with NVDA’s spread returning near its pre-announcement level within minutes and QQQ’s within the hour. Order-book depth also thinned temporarily, with QQQ’s resting depth within 1% of the mid-price falling to approximately $109,000 from a typical Saturday median of about $191,000, but depth returned to its usual range within a week.

    Methodology and Context

    The research utilized data from Bitget’s API and historical order-book information spanning from September 2025 through May 2026. It is important to note that these tokenized RWA perpetuals provide synthetic price exposure to underlying assets and do not confer equity ownership, dividends, or voting rights in the referenced companies or funds. The study also considered how liquidity behaves outside the underlying assets’ regular trading hours, given the continuous trading nature of perpetual futures.

    Bitget has been publishing monthly proof-of-reserves disclosures since December 2022.

    Why This Matters

    The materials describe a narrow update: Block Scholes published research on Bitget UEX’s tokenized RWA perpetual futures (gold, SPY, Nvidia, QQQ). The exact definition of ‘resting liquidity’ used by Block Scholes beyond ‘visible resting liquidity at a point in time or over a sample period’.

    Broader Context

    Source materials place the factual news in this context: Bitget is a global cryptocurrency exchange operating as a Universal Exchange (UEX), offering crypto, tokenized stocks, gold, and other asset classes within a single account.

  • XRP Price Navigates Conflicting Signals Amidst Whale Outflows and ETF Inflows

    XRP Price Navigates Conflicting Signals Amidst Whale Outflows and ETF Inflows

    XRP is currently experiencing a complex market dynamic, with significant outflows from exchanges occurring simultaneously with substantial inflows into U.S. spot XRP Exchange Traded Funds (ETFs). This divergence presents conflicting pressures on the cryptocurrency’s price, leading to uncertainty regarding its immediate direction.

    Conflicting Market Pressures
    This week, a notable outflow of 231 million XRP, valued between $330 million and $335 million, was flagged from Binance. According to CryptoQuant -linked analyst Darkfost, this represents the largest such withdrawal in approximately six months. Concurrently, whale wallets have deposited close to 1.45 billion XRP onto Binance over the trailing 30-day period. These movements suggest potential distribution activity.

    In contrast, U.S. spot XRP ETFs have collectively attracted $1.55 billion in cumulative inflows. Data indicates that inflows in August doubled the pace observed in July, pointing towards significant accumulation by institutional investors. This accumulation trend contrasts with the large outflows reported from Binance.

    Current Price Action and Technicals
    The XRP price is currently trading within an intraday range of $1.40 to $1.45. This price action follows a reported 50% rally last week, suggesting the market is digesting recent gains before a potential pullback. The Relative Strength Index (RSI(14)) readings are near 25, which typically suggests an oversold condition. However, the aggregate technical signal is reported to still lean towards sell pressure, adding to the market’s ambiguity.

    Potential Scenarios and Risks
    Analysts are observing several potential scenarios for XRP’s price. If the ETF inflows can continue to absorb the supply driven by whales, XRP could potentially reclaim the $1.50 resistance level, with further momentum possibly pushing it towards $1.65. Alternatively, consolidation between $1.40 and $1.50 is also a possibility as the market awaits further flow data. A break below the $1.40 support level could open the door to further declines, potentially towards $1.33 to $1.36, especially if concerns regarding escrow unlocks resurface and amplify whale selling pressure.

    Market Context and Outlook
    The broader market context shows that while XRP is experiencing these internal dynamics, other cryptocurrencies like Solana have seen significant gains, and Bitcoin has continued to trend higher. XRP’s current market capitalization is reported to be over $80 billion, which may limit the potential for extremely large percentage gains compared to earlier-stage projects.

    Traders are closely monitoring daily ETF flow reports and exchange balance shifts for confirmation of market direction. The current situation presents a complex interplay of distribution and accumulation, making the short-term outlook for XRP uncertain. Further data on investor flows and potential external factors will be crucial in determining the next significant price movement.

    Why This Matters

    The materials describe a narrow update: Large XRP outflows from Binance, totaling $330-335 million in a single day, are occurring simultaneously with substantial inflows into U. Whether XRP can maintain its ETF inflows.

  • Binance Futures to Implement Last Price Protection on TACUSDT Perpetual Contract

    Binance Futures to Implement Last Price Protection on TACUSDT Perpetual Contract

    Binance Futures to Implement Last Price Protected Mechanism for TACUSDT Perpetual Contract

    Binance Futures will implement a Last Price Protected (LPP) mechanism on its USDⓈ-Margined TACUSDT Perpetual Contract starting August 27, 2026, at 11:00 (UTC). This decision comes in response to observed divergences in the spot price of TAC across multiple exchanges. The exchange assures users that their funds on Binance remain secure.

    Gradual Implementation and Price Stability

    The LPP mechanism will be introduced gradually through a mark price smoothing process. This approach is designed to minimize sudden price fluctuations and ensure greater price stability during the transition period.

    LPP Period Duration and Exit Criteria

    The LPP period for the USDⓈ-Margined TACUSDT Perpetual Contract will conclude when the spot price of TAC (TAC Protocol) converges across various exchanges, allowing for the derivation of a stable index price from spot markets, as determined by Binance.

    A separate announcement will be issued to notify users when the LPP period ends and the contract is ready to revert to the standard Mark Price calculation, which is determined by the median of Price 1, Price 2, and the Contract Price. The duration of this transition period will be contingent on market volatility and the availability of a stable index price.

    Last Price Protected Mechanism Details

    Under the LPP mechanism, the mark price is calculated based on the average of recent transaction prices for the perpetual contract within a defined timeframe. Specifically, the Mark Price is computed as the average of trade prices over the last 10 seconds, with calculations performed every second.

    If fewer than 21 transaction prices are recorded within a 10-second interval, the system will extend its lookback to the past 100 seconds. If more than 21 transaction prices are available within that longer period, the average will be based on those prices. Otherwise, the average will be derived from the last 100 transaction prices of the contract.

    Furthermore, a price cap of ±1% will be applied to the mark price, limiting its change within this range per second.

    Transition to Standard Mark Price Calculation

    Upon the conclusion of the LPP period for the contract, the Mark Price will revert to the following formula: Mark Price = Median (Price 1, Price 2, Contract Price). Users can find the formulas for Price 1 and Price 2 within the USDⓈ-Margined Futures section detailing Mark Price and Price Index.

    Funding Rate Adjustments

    The capped funding rate will be adjusted from the previous range of ±2.00% to ±0.005% effective August 27, 2026, at 11:00 (UTC). The schedule for these adjustments is as follows:

    • August 27, 2026, 08:00 (UTC): Maximum Funding Rate of +2.000% / -2.000%
    • August 27, 2026, 12:00 (UTC): Maximum Funding Rate of +0.005% / -0.005%
    • August 27, 2026, 16:00 (UTC): Maximum Funding Rate of +0.005% / -0.005%
    • August 27, 2026, 20:00 (UTC): Maximum Funding Rate of +0.005% / -0.005%

    Contract Exemptions and Future Funding Rate Rules

    The aforementioned contract is exempt from the standard rule 8.1 concerning the Adjustment of Funding Interval. The funding interval will not be adjusted from every four hours to every one hour when the previous funding rate settlement for this contract reaches the capped funding rate.

    Once the LPP period concludes, the funding rate will revert to the standard rules for perpetual futures contracts, with maximum and minimum rates potentially reaching ±2.00%. In such cases, the funding interval will be adjusted from every four hours to every one hour when the previous funding rate settlement hits ±2.00%.

    Users are encouraged to refer to the following resources for further details:

    • Trading Rules to Trading Parameter
    • Funding Rate History
    • Mark Price and Price Index
    • Binance Futures Contract Specification

    Important Notes

    This information is issued as a Notice under Binance Exchange Rule 17.

    During the LPP period, Binance Futures will be the sole component of the price index.

    A stricter maximum price will be enforced during the LPP period. Binance reserves the right to adjust this maximum price as market risk conditions dictate. API users can access this information via GET /fapi/v1/exchangeInfo, while UI users can find the latest maximum price on the designated page.

    Binance may also adjust the specifications of this Futures contract, including funding fees, tick size, maximum leverage, and initial/maintenance margin requirements, based on prevailing market risk conditions. Users should consult the Trading Rules for the most up-to-date information on any such adjustments.

  • Bybit Lists SHEINUSDT on Pre-IPO Tradfi Perpetual Aug 27

    Bybit Lists SHEINUSDT on Pre-IPO Tradfi Perpetual Aug 27

    Bybit to Launch Pre-IPO Perpetual Contracts for Fast Fashion Giant Shein

    Cryptocurrency exchange Bybit is set to introduce Pre-IPO Tradfi Perpetual Contracts for SHEINUSDT, allowing traders to gain leveraged exposure to the valuation of fast fashion retailer Shein ahead of its anticipated initial public offering (IPO).

    Pre-Market Trading Schedule for SHEINUSDT

    The trading of these pre-IPO contracts will follow a specific schedule:

    • Call Auction: Commences on August 27, 2026, at 8:00 AM UTC.
    • Order Withdrawal: Available for a 20-minute window immediately following the start of the Call Auction.
    • Match-Making Tradeoff: Begins 25 minutes after the Call Auction opens.
    • Continuous Auction: Starts 30 minutes after the Call Auction, contingent on the success of the match-making tradeoff.

    Contract Specifications

    During the pre-IPO phase, the contract will feature a fixed fee of 0.005% every four hours. This mechanism will revert to the standard trading model once the company transitions to its post-IPO status.

    It is important to note that the estimated share count provided is for informational purposes only and does not constitute investment advice, a recommendation, or a warranty. The definitive share count will be confirmed following the company’s S-1 filing. Bybit will subsequently adjust the Contract Size to reflect this information.

    Understanding Pre-IPO Perpetual Contracts

    A Pre-IPO Perpetual Contract enables trading on a company’s estimated valuation prior to its public debut. These contracts are settled in USDT, and participants do not acquire actual company shares. Instead, trading activity focuses on price movements.

    Key Mechanisms

    Pricing: The contract price is derived from the estimated share price multiplied by the estimated number of shares, aiming to approximate the company’s market capitalization. Prior to any adjustment, one contract represents approximately 1/4,250,000,000 of Shein’s estimated market capitalization.

    Rebase (Proportional Adjustment): When the actual share count is officially disclosed, such as through the company’s S-1 filing, Bybit may implement a Rebase. This adjustment is designed to align the contract with the company’s actual share structure. Bybit will issue a separate announcement in advance of any Rebase. Following a Rebase, one contract will be equivalent to one actual share, while the value of a trader’s position will remain largely unchanged.

  • XRP Whale Withdrawals Surge from Binance Amidst Mixed Market Signals and Increased Network Activity

    XRP Whale Withdrawals Surge from Binance Amidst Mixed Market Signals and Increased Network Activity

    Large holders, often referred to as ‘whales’, have withdrawn over 231 million XRP, valued at more than $335 million, from the Binance exchange in a single day. This significant outflow far surpasses the 90-day average of approximately $40 million in XRP withdrawals from the exchange. The substantial movement of XRP occurred concurrently with a recent 40% price increase for the cryptocurrency and a $25 billion rise in its market capitalization over the past week.

    Network Activity Surge

    Network activity for XRP has also seen a considerable surge, with active addresses increasing by over 654%. Data indicates that active XRP addresses rose to 356,070 from a previous count of 47,180. This heightened participation can often coincide with sharper price swings, according to market analysts.

    Mixed Derivatives Market and Weakening Buying Pressure

    However, the derivatives market presents a mixed picture regarding future price movements. Long liquidations reached approximately $4.66 million, marking a 31.82% daily increase, while short liquidations stood near $1.13 million, up 61.61%. This indicates a degree of short-term pressure in the market.

    Further complicating the outlook, XRP’s Money Flow Index (MFI) has fallen to 35.89 from around 60. A reading below 50, and particularly below 40, typically suggests weakened buying pressure. While the MFI remains above the 20 threshold, indicating that the asset has not yet entered technically oversold territory, the decline points to a significant weakening in the buying pressure that supported the earlier price move.

    Interpreting the Signals and Uncertainties

    The surge in whale outflows from Binance is a notable event, potentially amid reported market activity in behavior among large XRP holders. Coupled with the increased network activity, some analysts suggest that if this accumulation trend continues, XRP could potentially test the $2 level. However, the mixed signals from the derivatives market and the declining MFI introduce considerable uncertainty.

    It remains uncertain whether the accumulation trend will continue or if XRP will test the $2 level. The extent of further downside for XRP, given the current MFI, is also unclear. The exact duration for which whale withdrawals have reached their highest level in six months is also not specified. Therefore, while the recent activity is significant, definitive conclusions about future price direction cannot be drawn at this time.

    Why This Matters

    The materials describe a narrow update: Large holders, referred to as ‘whales’, have withdrawn over 231 million XRP, valued at more than $335 million, from the Binance exchange in a single day. Whether the accumulation trend will continue.

    Broader Context

    Source materials place the factual news in this context: XRP briefly surged past $1.7 before stabilizing near $1.4.

  • Altcoin Dominance Surges to Two-Year High Amidst Shifting Crypto Market Liquidity

    Altcoin Dominance Surges to Two-Year High Amidst Shifting Crypto Market Liquidity

    Altcoins have captured a dominant share of the cryptocurrency market, with trading volume and market capitalization reaching a two-year high. This significant shift indicates a redistribution of liquidity, with altcoins attracting a larger portion of market activity compared to Bitcoin and Ethereum over the past week.

    The total altcoin market capitalization, excluding Ethereum, increased by approximately $135 billion in the past week. During the same period, Bitcoin saw a gain of nearly 25%. On the Binance exchange, altcoins reached a peak of 65% of total trading volume, a level not observed in two years. At this peak, Bitcoin constituted 21% of the volume, and Ethereum accounted for 13.6%.

    According to CryptoQuant analyst Darkfost, investor attention and capital have strongly moved toward altcoins, potentially signaling a broader resurgence of risk appetite across the market. Darkfost noted that the scale of this move highlights the rapid entry of capital into the altcoin segment. This redistribution of liquidity across the market saw altcoins attracting a larger share of trading activity than Bitcoin and Ethereum.

    Market breadth indicators also suggest a widespread rally. Altcoin Vector reported that its ‘Altcoin Impulse’ reading jumped to 93%. However, the analysis considers a breadth reading above 75% as potentially overextended, indicating that the current move could face exhaustion or a reset. This suggests a degree of uncertainty regarding the sustainability of the current altcoin surge.

    While the exact drivers are complex, some market participants point to recent announcements related to Bitcoin and legislative proposals as potential contributors to this liquidity shift. For instance, announcements made on August 19, including calls for the US to purchase Bitcoin and for Congress to pass the Clarity Act, are cited by Darkfost as having helped push liquidity into altcoins.

    In terms of historical parallels, analyst Matthew Hyland previously predicted that altcoins could deliver substantial returns, comparing the June sell-off to the March 2020 market collapse. Hyland suggested that many altcoins could recover significantly within months. However, these predictions are based on historical comparisons and carry inherent uncertainty.

    The current situation presents a complex picture for the cryptocurrency market. While the surge in altcoin activity indicates a notable shift in dynamics and potentially increased risk appetite, the high ‘Altcoin Impulse’ reading serves as a caution against potential overextension. The long-term sustainability of this altcoin dominance and the ultimate market reaction remain subjects of uncertainty.

    Why This Matters

    The materials describe a narrow update: Altcoins have experienced a surge in trading activity and market capitalization, capturing a larger share of the overall crypto market volume and value. The long-term sustainability of the altcoin rally.

    Broader Context

    Source materials place the factual news in this context: Altcoins have taken a leading role in the latest crypto market rally, as trading activity and market capitalization surged alongside Bitcoin’s sharp move higher.

  • RAIN Altcoin Surges 20% Daily: Drivers and Outlook

    RAIN Altcoin Surges 20% Daily: Drivers and Outlook

    Crypto Market Sees Minor Dip as RAIN Token Surges 20%

    The broader cryptocurrency market experienced a slight downturn on August 26, following a significant rally in recent days. Major digital assets including Bitcoin (BTC), Ethereum (ETH), and Ripple (XRP) all registered modest losses.

    However, the token RAIN defied this trend, experiencing a remarkable 20% surge in its valuation over a 24-hour period. This article explores the factors driving RAIN’s impressive performance and its potential future price targets.

    RAIN Leads Top Cryptocurrencies Amidst All-Time High

    RAIN emerged as the top-performing cryptocurrency among the top 100 by market capitalization on August 26. The token reached a new all-time high of nearly $0.02 before settling at its current price of $0.0176, according to CoinGecko. This surge has propelled its market capitalization to approximately $12.5 billion, positioning it as the 13th-largest digital asset.

    Token Burn and Community Governance Fuel Rally

    The primary catalyst for RAIN’s upward momentum appears to be the team’s decision to burn $108 million worth of tokens. This action was executed in direct response to a community request during the first Decentralized Autonomous Organization (DAO) governance vote.

    This significant token burn has garnered attention from various industry observers. One X user, Route 2 FI, commented that Rain Protocol is developing an infrastructure layer enabling anyone to create markets for any asset, indicating their personal investment in the project.

    Exchange Listing and Analyst Optimism

    The recent listing of RAIN on HyperliquidX, a decentralized exchange designed for trading with an on-chain order book and self-custodial settlement, is another factor believed to have positively influenced its price. An X post described HyperliquidX as a “permissionless protocol, permissionless venue.”

    Analyst AltcoinSherpa suggested that this listing should boost RAIN’s overall trading volume, citing “a lot of backing for this project.”

    Keval Gala, another X user, outlined four key reasons for his bullish outlook on RAIN: the substantial token burn, the integration with Hyperliquid, the upcoming V2 with a committed $100 million, and the allocation of 2.5% of trading volume towards buybacks and burns. Gala also noted that he is closely watching the resistance level at $0.0195 and anticipates a deeper pullback if the price falls below the $0.017-$0.018 range.

    Rain Protocol: A Decentralized Market Creation Platform

    Rain Protocol, built on the Arbitrum network, is a decentralized platform that empowers users to create permissionless options on a wide array of subjects. It allows participants to define their own markets, establish potential outcomes, and engage in free trading, aligning with the project’s core principles of transparency and user control.

    The native token, RAIN, was launched in September and is currently available on exchanges such as Gate, MEXC, and BingX. The token initially gained traction in November 2025 following a private investment deal where Enlivex Therapeutics, a clinical-stage immunotherapy company, agreed to purchase and sell $212 million in ordinary shares. Enlivex intended to utilize these funds for its RAIN prediction markets token treasury strategy. Notably, former Italian Prime Minister Matteo Renzi sits on Enlivex’s Board of Directors.

    Caution Advised Amidst Concentration Concerns

    Despite its recent strong performance, traders and investors are advised to remain prepared for a potential short-term correction. The cryptocurrency market often experiences pullbacks after periods of substantial gains. Furthermore, RAIN’s holder distribution presents a potential bearish indicator.

    Data reveals that the top 10 addresses control nearly 90% of the coin’s supply. This high level of concentration is considered a red flag, as it increases the risk of price manipulation.

  • XRP Price Surge Driven by Korean Volume and Binance Positioning; Sustainability Uncertain

    XRP Price Surge Driven by Korean Volume and Binance Positioning; Sustainability Uncertain

    XRP has experienced a significant price surge this week, reaching the $1.40 range and outperforming other top cryptocurrencies. This rally is reportedly driven by a substantial increase in trading volume, particularly from South Korea, and significant positioning on the Binance exchange. However, technical indicators suggest the token may be overbought, raising questions about the sustainability of the current price movement.

    Market Drivers Behind the Surge

    According to the article, XRP’s price increase was fueled by a 50% surge, with a notable portion of the trading volume originating from South Korean exchanges, specifically Upbit. The XRP/KRW trading pair saw 623 million in 24-hour volume, indicating strong interest from the region. Concurrently, substantial accumulation was observed on Binance order books, contributing to the upward momentum.

    Technical Indicators Signal Caution

    Despite the positive price action, the source states that overbought signals are flashing. XRP’s 14-day Relative Strength Index (RSI) is reportedly pressing toward 87, a level that historically precedes a market cooldown. This technical observation leads to uncertainty about whether the rally has genuine momentum or is primarily driven by exchange activity alone.

    The market context for XRP’s surge is described as noisy, with mixed signals from the broader altcoin market, including ETF flow data, regulatory clarity efforts like the CLARITY Act, and fluctuating macro liquidity. This backdrop increases the stakes for what comes next for XRP’s price.

    From a technical analysis perspective, XRP is trading in a tight range between $1.40 and $1.45. Key support levels are identified at $1.42, which corresponds to the 38.2% Fibonacci retracement, and a lower level at $1.36. On the upside, resistance is noted at $1.52 (the 23.6% Fibonacci retracement) and a higher level at $1.64. A break below $1.42 could risk a slide toward $1.36 and potentially $1.30–$1.31.

    Assessing Sustainability and Future Outlook

    Traders are advised to monitor network activity data alongside these price levels to better assess the rally’s legs. The article suggests that while XRP holders have seen solid short-term gains, the token, already up significantly, faces stacked resistance overhead. This situation may not offer asymmetric upside from current levels, and the math becomes less attractive as the price approaches the top of its range. This scenario could lead to rotation capital seeking earlier-stage investment opportunities.

    In contrast to XRP’s current market dynamics, LiquidChain is mentioned as a project positioning itself to fuse liquidity from Bitcoin, Ethereum, and Solana into a single execution environment. Its presale is currently priced at $0.01494, having raised $950,000 so far. LiquidChain aims to reduce friction in cross-chain liquidity through features like Single-Step Execution and Verifiable Settlement.

    Overall, while XRP’s recent price surge is a notable development driven by specific market forces, the presence of overbought signals and a complex market environment introduce uncertainty regarding its sustainability. Further analysis of network activity and broader market trends will be crucial in determining the future trajectory of XRP’s price.

    Why This Matters

    The materials describe a narrow update: XRP’s price increased to approximately $1.40. Whether XRP has momentum left for further gains after the recent surge remains uncertain.