Tag: Market Trends

  • XRP Leads Crypto Dip as Leverage Unwind Tests Rally

    XRP Leads Crypto Dip as Leverage Unwind Tests Rally

    Crypto Markets Brace for Inflation Data and Tech Earnings Amidst XRP Pullback

    Cryptocurrency markets are navigating a significant week, with Bitcoin briefly surpassing the $80,000 mark on Tuesday before settling around $78,000. Traders are now keenly awaiting crucial economic indicators, including the core Personal Consumption Expenditures (PCE) inflation data and Nvidia’s earnings report, both anticipated to shape market sentiment leading into the Jackson Hole Economic Symposium.

    While overall risk appetite has seen a broad improvement this month, the gains have not been evenly distributed across all digital assets. XRP, in particular, is experiencing a more pronounced retracement of its recent rally compared to the wider market.

    According to CoinMarketCap data, XRP has fallen 6.23% in the past 24 hours, trading near $1.38. This performance marks the weakest among the ten largest cryptocurrencies by market capitalization. This sharp reversal contrasts with XRP’s position earlier in the week, where it stood out as a market leader. Despite the recent dip, XRP remains up 35.55% over the past seven days, trailing only Hyperliquid’s 38.65% weekly gain among the top 10 and significantly outperforming Bitcoin, Ethereum, and other major cryptocurrencies.

    The current pullback can be attributed to the rapid pace of XRP’s recent ascent. The token surged from approximately $1.00 on August 18 to an intraday high near $1.69 just four days later. This aggressive move briefly touched the psychologically significant $1.70 level before Bitcoin’s own retreat from its $80,000 peak began to exert downward pressure on altcoins across the board.

    A notable positive development, however, comes from XRP-linked Exchange Traded Funds (ETFs). These traditional investment vehicles, which track XRP’s price without requiring direct ownership of the cryptocurrency, have recorded nine consecutive days of net inflows. This suggests that the current market dynamics are more indicative of leverage adjustments rather than institutional investors exiting their positions.

    XRP Price: Leverage Catches Up With the Rally

    On the daily chart, XRP opened at $1.4344, reached a high of $1.4513, and is currently trading around $1.3790, representing a 3.86% decline for the current trading session.

    This price action brings XRP back to the $1.40 zone, a level that recently transitioned from resistance to support following last week’s breakout. This is also the same level where XRP first reclaimed its 200-day exponential moving average, a technical milestone that chart watchers had identified as an early indicator of a potential trend reversal. The ability of XRP to hold the $1.40 level will be critical in determining whether this pullback remains a healthy correction or evolves into a more significant downturn.

    Technical indicators are presenting a mixed outlook. The Relative Strength Index (RSI), which gauges an asset’s overbought or oversold conditions on a scale of 0 to 100, stands at 66.7. While still in bullish territory, it is approaching the 70 mark, a level where traders often begin to take profits.

    The Average Directional Index (ADX), which measures trend strength irrespective of direction, is elevated at 44.1, well above the 25 threshold that signifies a confirmed trend. Furthermore, the positive directional line (DI+) remains above the negative directional line (DI-), indicating a bullish bias.

    However, moving averages present a conflicting view. The longer-term (EMA 200) and shorter-term (EMA 50) moving averages show the latter still positioned below the former. This structural arrangement is a remnant of the broader downtrend that has characterized XRP’s chart for much of the year, even as the price experienced its most substantial rally in months.

    Bitcoin’s ability to maintain support within the $77,000-$78,000 range will be a significant factor for all altcoins, including XRP. Tonight’s PCE data and Nvidia’s earnings report are the next scheduled catalysts that could influence this trend in either direction.

    For XRP specifically, the immediate focus is on defending the $1.40 level. Holding this support would likely preserve the integrity of its seven-day rally, suggesting a normal market cooldown. A daily close below $1.40, however, could trigger further selling pressure, with short-side indicators suggesting potential declines toward the lower boundary of the support zone established since August’s breakout.
  • XRP Price Analysis: Examining Market Indicators Amidst Recent Price Movement

    XRP Price Analysis: Examining Market Indicators Amidst Recent Price Movement

    XRP’s price has seen a notable increase of over 45% in the past week, accompanied by a surge in active addresses and ETF trading volume. However, the sustainability of this rally remains uncertain, with key technical levels and market indicators providing a mixed outlook.

    The cryptocurrency experienced a significant price surge, gaining over 45% in the past seven days and 50% over the trailing week, though it remains down 20% year-to-date. Currently trading around $1.41, XRP saw a slight 2% decrease in the past 24 hours, suggesting traders are digesting the recent gains rather than reversing the trend.

    On-chain data indicates a substantial spike in network activity. According to analyst Ali Charts, active addresses surged by 650%, from 47,180 to 356,070. Receiving addresses reportedly increased by over 698%. This heightened activity, combined with three consecutive days of record trading volume for the Bitwise XRP ETF, has been interpreted by some as a sign of increased participation and potential accumulation.

    Whale positioning offers a more nuanced perspective than retail hype. While some initial profit-taking occurred, long positions that had dipped are reportedly climbing again. This pattern, where significant market participants re-enter after booking gains, often precedes continuation rather than a collapse, provided macro conditions remain favorable. XRP’s market capitalization currently stands at $80 billion.

    Technically, XRP is in a post-notable move consolidation phase. Key resistance levels are identified at $1.51, $1.53, $1.57, and $1.62. Support is layered at $1.31 and $1.30, with a more significant floor near $1.00. The current consolidation range is observed between $1.31 and $1.52.

    A sustained close above $1.51, supported by consistent ETF inflow volume, could potentially lead to a move toward $1.62 and beyond. Some analyst models suggest an upside target of $2.50 if new catalysts emerge. However, a break below the $1.30 support level would invalidate the near-term bullish structure and could bring the $1.00 zone back into play.

    The possibility of XRP reaching $10 this year is considered unlikely based on current data, as it would require approximately a seven-fold increase, and no clear catalysts of that magnitude are apparent yet. This outlook underscores the inherent uncertainties surrounding extreme price targets.

    In summary, XRP’s recent price action is characterized by increased on-chain activity and positive ETF trends, alongside cautious whale positioning. While technical indicators suggest potential upside if key resistance levels are breached, significant support levels and the absence of strong catalysts for extreme price targets introduce considerable uncertainty. Investors are advised to monitor established technical levels and consider the prevailing market conditions.

    Why This Matters

    The materials describe a narrow update: XRP’s price increased by over 45% in seven days, reaching $1. Whether the current XRP surge is the start of a larger trend or a temporary bounce.

    Broader Context

    Source materials place the factual news in this context: XRP is trading at $1.41, down 2% over the past 24 hours in a mild pullback after one of the sharpest weekly moves in the top-10.

  • Cardano Drops 6% Amid Correction Fears

    Cardano Drops 6% Amid Correction Fears

    Cardano’s native token, ADA, experienced a significant pullback on August 26, halting a recent rally as the broader cryptocurrency market saw a slight downturn. While many analysts maintain a positive outlook on the asset, some are cautioning that a double-digit percentage decline from current levels could be on the horizon.

    Recent Surge and Market Dynamics

    ADA had surged by 22% over the preceding two weeks, a rally attributed in part to a broader market revival influenced by monetary policy shifts announced by the U.S. Treasury Department. At its peak, the token reached a three-month high of over $0.25. However, the past 24 hours have seen a correction, with ADA trading around $0.21 at press time. This represents a 6% decline on the day, making it one of the day’s biggest decliners.

    Divergent Analyst Perspectives

    On the social media platform X, user SBlockSpy observed that ADA faced rejection around the $0.22 mark and is closely watching the current pullback. They suggested that the move indicates increased seller activity and predicted a potential downtrend to as low as $0.164 if selling pressure continues. Conversely, SBlockSpy believes that if buyers emerge, they could initiate an initial surge towards $0.24, followed by a move to $0.30.

    Another X user, Rand Group, also weighed in. Earlier this week, they highlighted ADA’s strong breakout, asserting that it had breached its primary downtrend resistance. However, Rand Group indicated they would remain on the sidelines until ADA consolidates above the $0.25 resistance level.

    Meanwhile, More Crypto Online expressed uncertainty about whether a “B-wave” pullback has commenced. They noted that as long as ADA maintains support above $0.157, upward momentum could persist, potentially pushing the price into the $0.314-$0.404 range.

    Bullish Outlooks Persist

    Despite the recent dip, several prominent figures on X remain firmly bullish on ADA. Earlier this month, analyst Lucky informed their nearly two million followers that ADA was among their “hot picks,” forecasting a short-term ascent to approximately $0.50. The last time ADA traded at such levels was in November of the previous year.

    Analyst CW also expressed optimism, opining that ADA has broken through a significant resistance line and transitioned into a bullish trend. “The long downtrend is over. The real bull market has begun,” CW stated.

  • Bitcoin Faces Profit-Taking Hurdle Above $80,000; Demand Key for Next Move, Analysts Say

    Bitcoin Faces Profit-Taking Hurdle Above $80,000; Demand Key for Next Move, Analysts Say

    Bitcoin’s recent test of the $80,000 mark has encountered resistance from existing holders realizing profits, according to market analysis. The ability of new demand to absorb this selling pressure is now a key factor in determining Bitcoin’s next move, with analysts suggesting a period of consolidation may be necessary.

    As of August 26, Bitcoin had slipped back below $80,000 after testing the level. XWIN Japan noted that nearly every investor group has returned to profit as the cryptocurrency approached this threshold. This situation creates a familiar challenge during a rapid recovery, as more profitable holders have an incentive to sell. The unrealized profit and loss (PnL) readings illustrate this, with long-term holders showing a reading of 21.1 and short-term holders at 13.4. Investors holding for one day to one month had a reading of 13.9, while the newest buyers stood at 5.3.

    The Spent Output Profit Ratio (SOPR) also reflects this dynamic. The SOPR Ratio briefly reached 1.4 as Bitcoin neared $80,000, indicating that long-term holders were realizing profits at a higher relative rate. However, the ratio has since fallen to 0.93, suggesting that short-term holders are now demonstrating stronger realized performance relative to long-term holders.

    Analysts suggest that any sustained notable move above $80,000 would require not only overcoming this profit-taking but also absorbing fresh demand. If this occurs, Bitcoin could potentially target the $88,000 to $90,000 range. However, a more immediate concern is the support level around $75,000 to $76,000. In XWIN’s opinion, failure to hold this level could make it difficult for short-term holders to secure profits, potentially accelerating a price correction.

    Further complicating the picture is fading buying pressure at higher prices. BorisD noted that Binance’s volume delta, a measure of aggressive buying versus selling, decreased significantly, falling from $1.17 during Bitcoin’s move from $63,000 to $70,000 to approximately $350 million near $80,000. Other major exchanges showed flatter readings. BorisD suggested that the market might require a period of consolidation before attempting another notable move.

    Despite these headwinds, the broader market backdrop is considered more supportive than it was a week prior. Bitcoin experienced a notable climb from below $65,000 on August 19 to above $81,000. This surge was reportedly aided by Treasury buyback plans for longer-dated debt, renewed demand from US spot Bitcoin ETFs, and over $4 billion in short liquidations. Over the five days preceding August 26, nearly $2 billion flowed into US spot Bitcoin ETFs, while Treasury buybacks of longer-dated debt increased from $2 billion to at least $4 billion per operation.

    At the time of writing, Bitcoin was trading around $79,000. This represents a 2% decrease over the past 24 hours, but remains a 23% increase over the last seven days and a 21% gain over the past month. Year-to-date, Bitcoin is down close to 28% and approximately 37% below its all-time high of over $126,000, set in October of the previous year.

    The central question for the market remains whether new demand can effectively absorb the selling pressure from profitable holders. Without this absorption, Bitcoin may face a period of consolidation rather than an immediate push towards higher price targets, highlighting the inherent uncertainty in its near-term trajectory.

    Why This Matters

    The materials describe a narrow update: Bitcoin’s price has fluctuated around $80,000, with analysts citing profit-taking by existing holders and fading buying pressure as key factors. Whether fresh demand can absorb selling from profitable holders.

    Broader Context

    Source materials place the market analysis in this context: Bitcoin (BTC) slipped back below $80,000 after testing the level again, with XWIN Japan pointing to profit-taking by existing holders as a major barrier on August 26.

  • INS Loans TradFi Perpetual Contracts: Leverage Adjustments

    INS Loans TradFi Perpetual Contracts: Leverage Adjustments

    Bybit to Increase Leverage Limits for Stock Futures to Boost Institutional Trading

    Bybit is set to adjust leverage limits for eligible stock futures within its INS Loans product, aiming to better support institutional trading needs and enhance capital efficiency for TradFi Perpetual Contracts.

    Following the adjustment, these eligible stock futures will offer higher leverage levels, determined by their individual risk and liquidity profiles. The updated leverage limits will range from 10X, 15X, 20X, or 25X, depending on the specific contract. The changes are scheduled to take effect on August 26, 2026, at 10 AM UTC.

    Leverage Adjustment Details

    Symbols with Leverage Increased to 10X:
    SSPCUSDT, MVLLUSDT, INTWUSDT, AXTIUSDT, SHAZUSDT, AEHRUSDT, ZHONGJIUSDT, MINIMAXUSDT, ZHIPUUSDT, SKUUUSDT, BEUSDT, SKDDUSDT, CIFRUSDT, BOTUSDT, TSEMUSDT, ALABUSDT, QNTXUSDT, GIGADEVICEUSDT, BSPUSDT, WDCUSDT, PENGSTOCKUSDT, CRDOUSDT, FLNCUSDT, POETUSDT, COHRUSDT, APLDUSDT, ASTSUSDT, SMCIUSDT, STXXUSDT, OUSTUSDT, CLSKUSDT, FLYUSDT, TSLLUSDT, KODEX200USDT, FWDIUSDT, MARAUSDT, ARMUSDT & CXMTUSDT.
    Previous Leverage: 3X
    New Leverage: 10X

    Symbols with Leverage Increased to 15X:
    IRENUSDT, RDWUSDT, RKLBUSDT, TERUSDT, USARUSDT, SAMSUNGEMUSDT, HIMSUSDT, AMCUSDT, IONQUSDT, ONDSUSDT, GLWUSDT, NOKIAUSDT, CIENUSDT, CSOPSKHYNIX2LUSDT, AMATUSDT, BNCUSDT, NCLDUSDT, LRCXUSDT, BMNRUSDT, RIOTUSDT, MOUSDT, PURRUSDT, KLACUSDT, NETUSDT, APPSTOCKUSDT, FLEXUSDT, CSOPSAMSUNG2LUSDT, HPEUSDT, ONUSDT, NVDLUSDT, VRTUSDT, HYUNDAIUSDT, UVXYUSDT, KSTRUSDT, RDDTUSDT, REGNUSDT, SQQQUSDT, WENSTOCKUSDT, NOWUSDT, TQQQUSDT, BBXUSDT, SNOWUSDT, QCOMUSDT, SOXXUSDT, GEVUSDT, VRTXSTOCKUSDT, SPOTUSDT, GDXUSDT, SMICUSDT, CRMUSDT, DKNGUSDT, ADBEUSDT, RIVNUSDT, SOFIUSDT, AALUSDT, CATSTOCKUSDT, BIIBUSDT, MAUSDT, PANWUSDT, CRWDUSDT, TZAUSDT, AMGNUSDT, ASMLUSDT, SHOPUSDT, SMHUSDT, GMESTOCKUSDT, GILDUSDT, TXNUSDT, ZMUSDT, LYTEUSDT, POPMARTUSDT, VSTUSDT, EWTUSDT, SONYUSDT, ARKKUSDT, TTWOUSDT, MEITUANUSDT, EBAYUSDT, XLKUSDT, BXUSDT, CSCOUSDT, PYPLUSDT, LLYUSDT, UBERUSDT, XOMUSDT, GEUSDT, TENCENTUSDT, GSUSDT, KUAISHOUUSDT, XBIUSDT, BACUSDT, LGELECTRONICSUSDT, NVOUSDT, XLVUSDT, TMFUSDT, NFLXUSDT, XLFUSDT, XIAOMIUSDT, XLEUSDT, UNHUSDT, TBTUSDT, JNJUSDT, HANMIUSDT, BRKBUSDT, NAVERUSDT, BITOUSDT, VUSDT, JPMUSDT, PEPUSDT, COSTUSDT, WMTUSDT, IWMUSDT & KOUSDT.
    Previous Leverage: 3X
    New Leverage: 15X

    Symbols with Leverage Increased to 20X:
    SNXXUSDT, KORUUSDT, MUUUSDT, SOXLUSDT, SOXSUSDT, AAOIUSDT, NBISUSDT, CBRSUSDT, SKHYNIXUSDT, SKHYUSDT, SAMSUNGUSDT, DRAMUSDT, DELLUSDT, AMDSTOCKUSDT & IBMUSDT.
    Previous Leverage: 3X
    New Leverage: 20X

    Symbols with Leverage Increased to 25X:
    SPCXUSDT.
    Previous Leverage: 3X
    New Leverage: 25X

    Symbols with Leverage Increased to 10X:
    CRWVUSDT.
    Previous Leverage: 5X
    New Leverage: 10X

    Symbols with Leverage Increased to 15X:
    LITEUSDT, PLTRUSDT, TSMUSDT, BABAUSDT, AVGOUSDT & EWJUSDT.
    Previous Leverage: 5X
    New Leverage: 15X

    Symbols with Leverage Increased to 20X:
    SNDKUSDT, MUUSDT, MRVLUSDT, COINUSDT, HOODUSDT, ORCLUSDT, METAUSDT, AMZNUSDT & SPYUSDT.
    Previous Leverage: 5X
    New Leverage: 20X

    Symbols with Leverage Increased to 25X:
    INTCUSDT, CRCLUSDT, MSTRUSDT, EWYUSDT, TSLAUSDT, NVDAUSDT, GOOGLUSDT, MSFTUSDT, AAPLUSDT & QQQUSDT.
    Previous Leverage: 5X
    New Leverage: 25X

    Important Note

    This adjustment applies to stock futures currently eligible under INS Loans. Any newly listed stock futures will initially maintain the current default leverage of 3X, unless otherwise specified.

    Bybit stated that it will continue to monitor and review leverage parameters in response to market conditions, liquidity, volatility, and risk considerations.

  • XRP Network Activity Surges: Key Level to Watch

    XRP Network Activity Surges: Key Level to Watch

    XRP Surges on Network Activity Boost, Analysts Eye Key Levels

    XRP has staged a remarkable comeback this week, distinguishing itself as one of the market’s top performers after a period of subdued activity. The cryptocurrency briefly touched $1.76 before settling around the $1.50 mark.

    This resurgence has been bolstered by a significant increase in network participation. Analyst Ali Martinez reported a dramatic surge in active addresses, which climbed from 47,180 to 356,070 – an increase of 654.71% within days. Such a substantial spike typically signals heightened engagement and can coincide with increased price volatility.

    If this marks the beginning of a new trend for XRP, analyst Casi Trades suggests that the $1.20 level may soon become a distant memory. She anticipates XRP first targeting $1.78, followed by a retracement to approximately $1.30, before embarking on another push towards $2.57.

    According to this analysis, a complete five-wave structure could eventually propel XRP to around $2.90, completing Wave 1 of a larger macro Wave 3. A subsequent correction might bring the asset back towards $1.65, potentially transforming current resistance into future support. In this scenario, the critical factor will not only be the extent of XRP’s ascent but also whether the token experiences another opportunity to trade below $1.20.

    Meanwhile, Crypto Patel noted that XRP has broken through seven months of resistance with a weekly gain of approximately 70% from its accumulation zone, shifting the market’s focus to the $1.55 level. Sustaining prices above this point could pave the way for further bullish momentum, while a breach below might trigger a retracement or re-accumulation phase. The long-term outlook remains optimistic, with a target range of $5 to $10.

    On the institutional front, the launch of US-based spot XRP ETFs last week began quietly, with zero inflows recorded on Monday. However, this trend rapidly shifted. Tuesday saw inflows of $5.81 million, followed by $2.35 million on Wednesday.

    Activity accelerated following an announcement from the US Treasury Department regarding its intention to double the maximum size of liquidity-support buybacks for longer-dated government debt. Thursday registered $13.24 million in inflows, and Friday reached $18.38 million, marking the strongest performance since mid-May.

    This buying momentum has carried into the current week. On August 25th, inflows totaled $13.82 million. Bitwise’s fund led the pack with $8.25 million, with Franklin and Canary’s ETFs following with $4 million and $1.57 million, respectively.

  • XRP Price Analysis: Technical Indicators Present Ambiguous Signals

    XRP Price Analysis: Technical Indicators Present Ambiguous Signals

    XRP has recently experienced a notable price surge followed by a pullback, a development that has captured attention in the crypto market. While the cryptocurrency saw a significant gain, technical indicators are presenting a complex picture, suggesting uncertainty about its immediate future trajectory.

    The broader crypto market has shifted from fear to ‘extreme greed’ this week. Against this backdrop, XRP registered a substantial 46% gain over a seven-day period, pushing its market capitalization to over $91 billion at its peak. However, this recent price movement has since moderated. XRP is currently trading at $1.4554 on the daily chart, down from a recent high of $1.5505. This pullback follows a period where XRP had bottomed near $1.00 in early August, with the subsequent move to $1.55 representing a roughly 55% increase.

    Technical Indicators: A Mixed Signal
    Analysis of key technical indicators provides a nuanced view of XRP’s current market position. The Average Directional Index (ADX), which measures trend strength, stands at 44.8, indicating a strong directional move occurred. However, the latest daily candle closed at $1.4554, down from its opening price of $1.4818, marking the second consecutive day of decline. This pattern has been interpreted by some as a potential relief rally stalling under resistance, rather than a definitive trend reversal.

    Further complicating the outlook is the relationship between XRP’s 50-day and 200-day Exponential Moving Averages (EMAs). The 50-day EMA is currently below the 200-day EMA, a formation often referred to as a ‘death cross.’ According to the analysis, this configuration suggests that the medium-term trajectory may still be pointed downward, implying potential bearish conditions ahead for XRP. While a death cross is considered a lagging indicator, its presence adds a layer of caution to the recent price action.

    The Relative Strength Index (RSI), a momentum gauge, is reading 76.8. An RSI above 70 is typically considered overbought, suggesting that XRP’s recent recovery may have been too rapid and could be vulnerable to a pullback. The combination of these indicators—the death cross formation and an overbought RSI—raises questions about the sustainability of XRP’s recent gains.

    Potential Scenarios and Uncertainty
    Looking ahead, several scenarios are being considered. For a sustained bullish case, XRP would need to reclaim and hold the resistance level around $1.5507, with potential targets at $1.5824 and $1.6227. This would likely require positive momentum and a cooling of the RSI without a significant price notable move.

    Conversely, a bearish scenario could unfold if XRP falls below the support level of $1.4342. A daily close below this level could see the price drift back towards the $1.40 shelf and potentially revisit the early August low of $1.00.

    It remains uncertain whether XRP’s recent bounce will ultimately resolve into a bull trap. The ability of XRP to reclaim and sustain levels above $1.5507 is a key factor. Until such a move is reported, the prevailing analysis suggests a potential drift towards lower support levels before a clearer direction emerges. The limitations of technical analysis in predicting exact price movements, especially in volatile markets, should be noted. Therefore, while indicators provide insights, they do not offer definitive predictions about XRP’s future price action.

    Why This Matters

    The materials describe a narrow update: XRP saw a 46% gain over seven days, reaching a market cap of over $91 billion, but has since pulled back, trading at $1.4554. It is uncertain whether XRP’s bounce will resolve into a bull trap, and its ability to reclaim and hold levels above $1.5507 is a key factor in determining its next move.

    Broader Context

    Source materials place the market analysis in this context: The crypto market flipped from fear to “extreme greed” this week for the first time since 2024, and the Ripple-linked XRP rode that wave hard.

  • Crypto Market Shifts from Fear to Extreme Greed

    Crypto Market Shifts from Fear to Extreme Greed

    Crypto Market Surges into “Extreme Greed” for First Time Since Late 2024

    The cryptocurrency market has entered “extreme greed” territory for the first time since late 2024, according to the Crypto Fear and Greed Index.

    The index, measured by Coinmarketcap, reached 81 late Sunday evening and has maintained that level, surpassing the 80-point threshold that signifies panicked buying and strong conviction. This marks a significant turnaround for a market that has largely languished in “fear” over the past year, with only brief excursions into “neutral” territory.

    The rapidity of this shift is particularly striking. Just one month ago, the index stood at 36, firmly within the “fear” zone. A week prior, it was at 41, barely in neutral territory. The surge to 81 on Sunday and its sustained presence today represents a 45-point climb in 30 days, effectively erasing much of the caution that characterized the first half of 2026.

    This is also the fastest sentiment reversal between two extremes ever recorded, and the only instance of a move from extreme fear to extreme greed since Coinmarketcap began tracking the index. While Alternative.me, which has been monitoring sentiment for a longer period, places its index in “greed” (though not yet “extreme” by 6%), the momentum shift is consistent: traders are rapidly becoming extremely bullish, mirroring a similar movement observed in 2021.

    The index had previously bottomed out at 5 on February 5, deep within “extreme fear” and marking its lowest point of the year. The journey from that nadir to this week’s 81 represents a complete cycle from total capitulation to unbridled greed within six months – an arc typically associated with significant price volatility in spot markets.

    This sentiment reversal coincides with a surge in Bitcoin’s performance, which has outpaced the broader crypto market. Bitcoin saw gains of approximately 24% in a single week, while the overall crypto market experienced more modest growth, a disparity evident in Bitcoin’s increasing share of the total crypto market capitalization.

    The recent breakout appears to be linked to an announcement last Wednesday by the U.S. Treasury. The department stated it would double its long-bond buybacks – purchases of its own debt aimed at bolstering demand – from $2 billion to $4 billion per operation, effective September 9. This move is expected to weaken the dollar and encourage investors to turn to Bitcoin as a hedge against inflation.

    The same market conditions also compelled bearish traders to cover their positions at a loss. As Bitcoin surpassed the $70,000 mark, a short squeeze liquidated over $4 billion in crypto shorts within two to three days. Bitcoin ETFs recorded their largest single day of inflows since May, with both Ethereum and Bitcoin ETFs collectively attracting approximately $2.3 billion in assets.

  • XRP Soars on ETF Hopes

    XRP Soars on ETF Hopes

    XRP Price Surges as Spot ETF Inflows Skyrocket

    XRP is currently trading around the $1.50 mark, a seemingly stable figure that belies a dramatic three-week surge from $1.00 to nearly $1.70, defying bearish forecasts. Beneath the surface of this price action lies a significant shift in the ETF landscape, transforming a niche category into a crucial driver of demand.

    ETF Category Sees Explosive Growth

    Spot XRP Exchange-Traded Funds (ETFs) recorded net inflows of $39.78 million last week, marking the strongest weekly performance since mid-May. This influx has propelled cumulative net inflows to approximately $1.55 billion, a stark contrast to the week ending August 8th, when inflows plummeted to a mere $1.01 million. This dramatic turnaround has been described as a “zero to hero” narrative.

    Institutional Appetite Reaffirmed

    The timing of this surge in ETF inflows closely aligns with XRP’s breakout above the $1.20 level. This correlation suggests that institutional interest in XRP exposure, far from waning, has simply become more assertive and impatient.

    XRP is currently consolidating around the $1.50 area, with intraday trading between $1.46 and $1.54. This reflects a market still processing last week’s substantial 50% price increase. While trading volume has subsided from its peak during the breakout, it remains elevated compared to early August levels.

    Key Technical Levels to Watch

    The immediate technical hurdle for XRP lies at the $1.51 resistance level. Further upside targets are positioned at $1.60 and the recent high of $1.70. On the downside, bulls must defend the $1.45 level; a breach below this could lead to a retest of $1.36 and, in a worst-case scenario, a return to the $1.00 floor.

    The daily chart indicates that the Relative Strength Index (RSI) is in overbought territory. The price is currently positioned between the 20-day Exponential Moving Average (EMA20) and the 50-day Exponential Moving Average (EMA50), a configuration that often precedes a period of consolidation rather than continued upward momentum.

    Future Outlook for XRP

    Sustained ETF inflows could propel XRP past the $1.51 and $1.60 resistance levels, potentially leading to new price highs. Alternatively, consolidation may occur between $1.36 and $1.51 as momentum recalibrates. However, a stall in ETF inflows coupled with a sharp decline in the RSI could bring the $1.00 level back into play.

    Emerging Infrastructure Plays

    While XRP holders who entered at $1.00 have already realized significant gains, a cryptocurrency with a market capitalization exceeding $85 billion typically requires a substantial catalyst to double its value. The current overbought RSI and stacked resistance near $1.60 suggest that the easiest gains on this upward leg may have already been captured. This dynamic is prompting capital to shift towards earlier-stage infrastructure projects with greater growth potential.

    One such project, Bitcoin Hyper ($HYPER), is developing the first Bitcoin Layer 2 solution with full Solana Virtual Machine (SVM) integration. It claims to offer smart contract execution faster than Solana itself, while leveraging Bitcoin’s inherent security. The presale has reportedly raised $33 million at a current token price of $0.0136852, with a 35% Annual Percentage Yield (APY) staking option available for early investors. The project’s value proposition includes low-latency L2 processing, a decentralized bridge for Bitcoin transfers, and enhanced programmability for Bitcoin.

  • XRP’s Momentum Falters After $1.70 Rejection

    XRP’s Momentum Falters After $1.70 Rejection

    XRP Faces Critical Resistance After Sharp Recovery

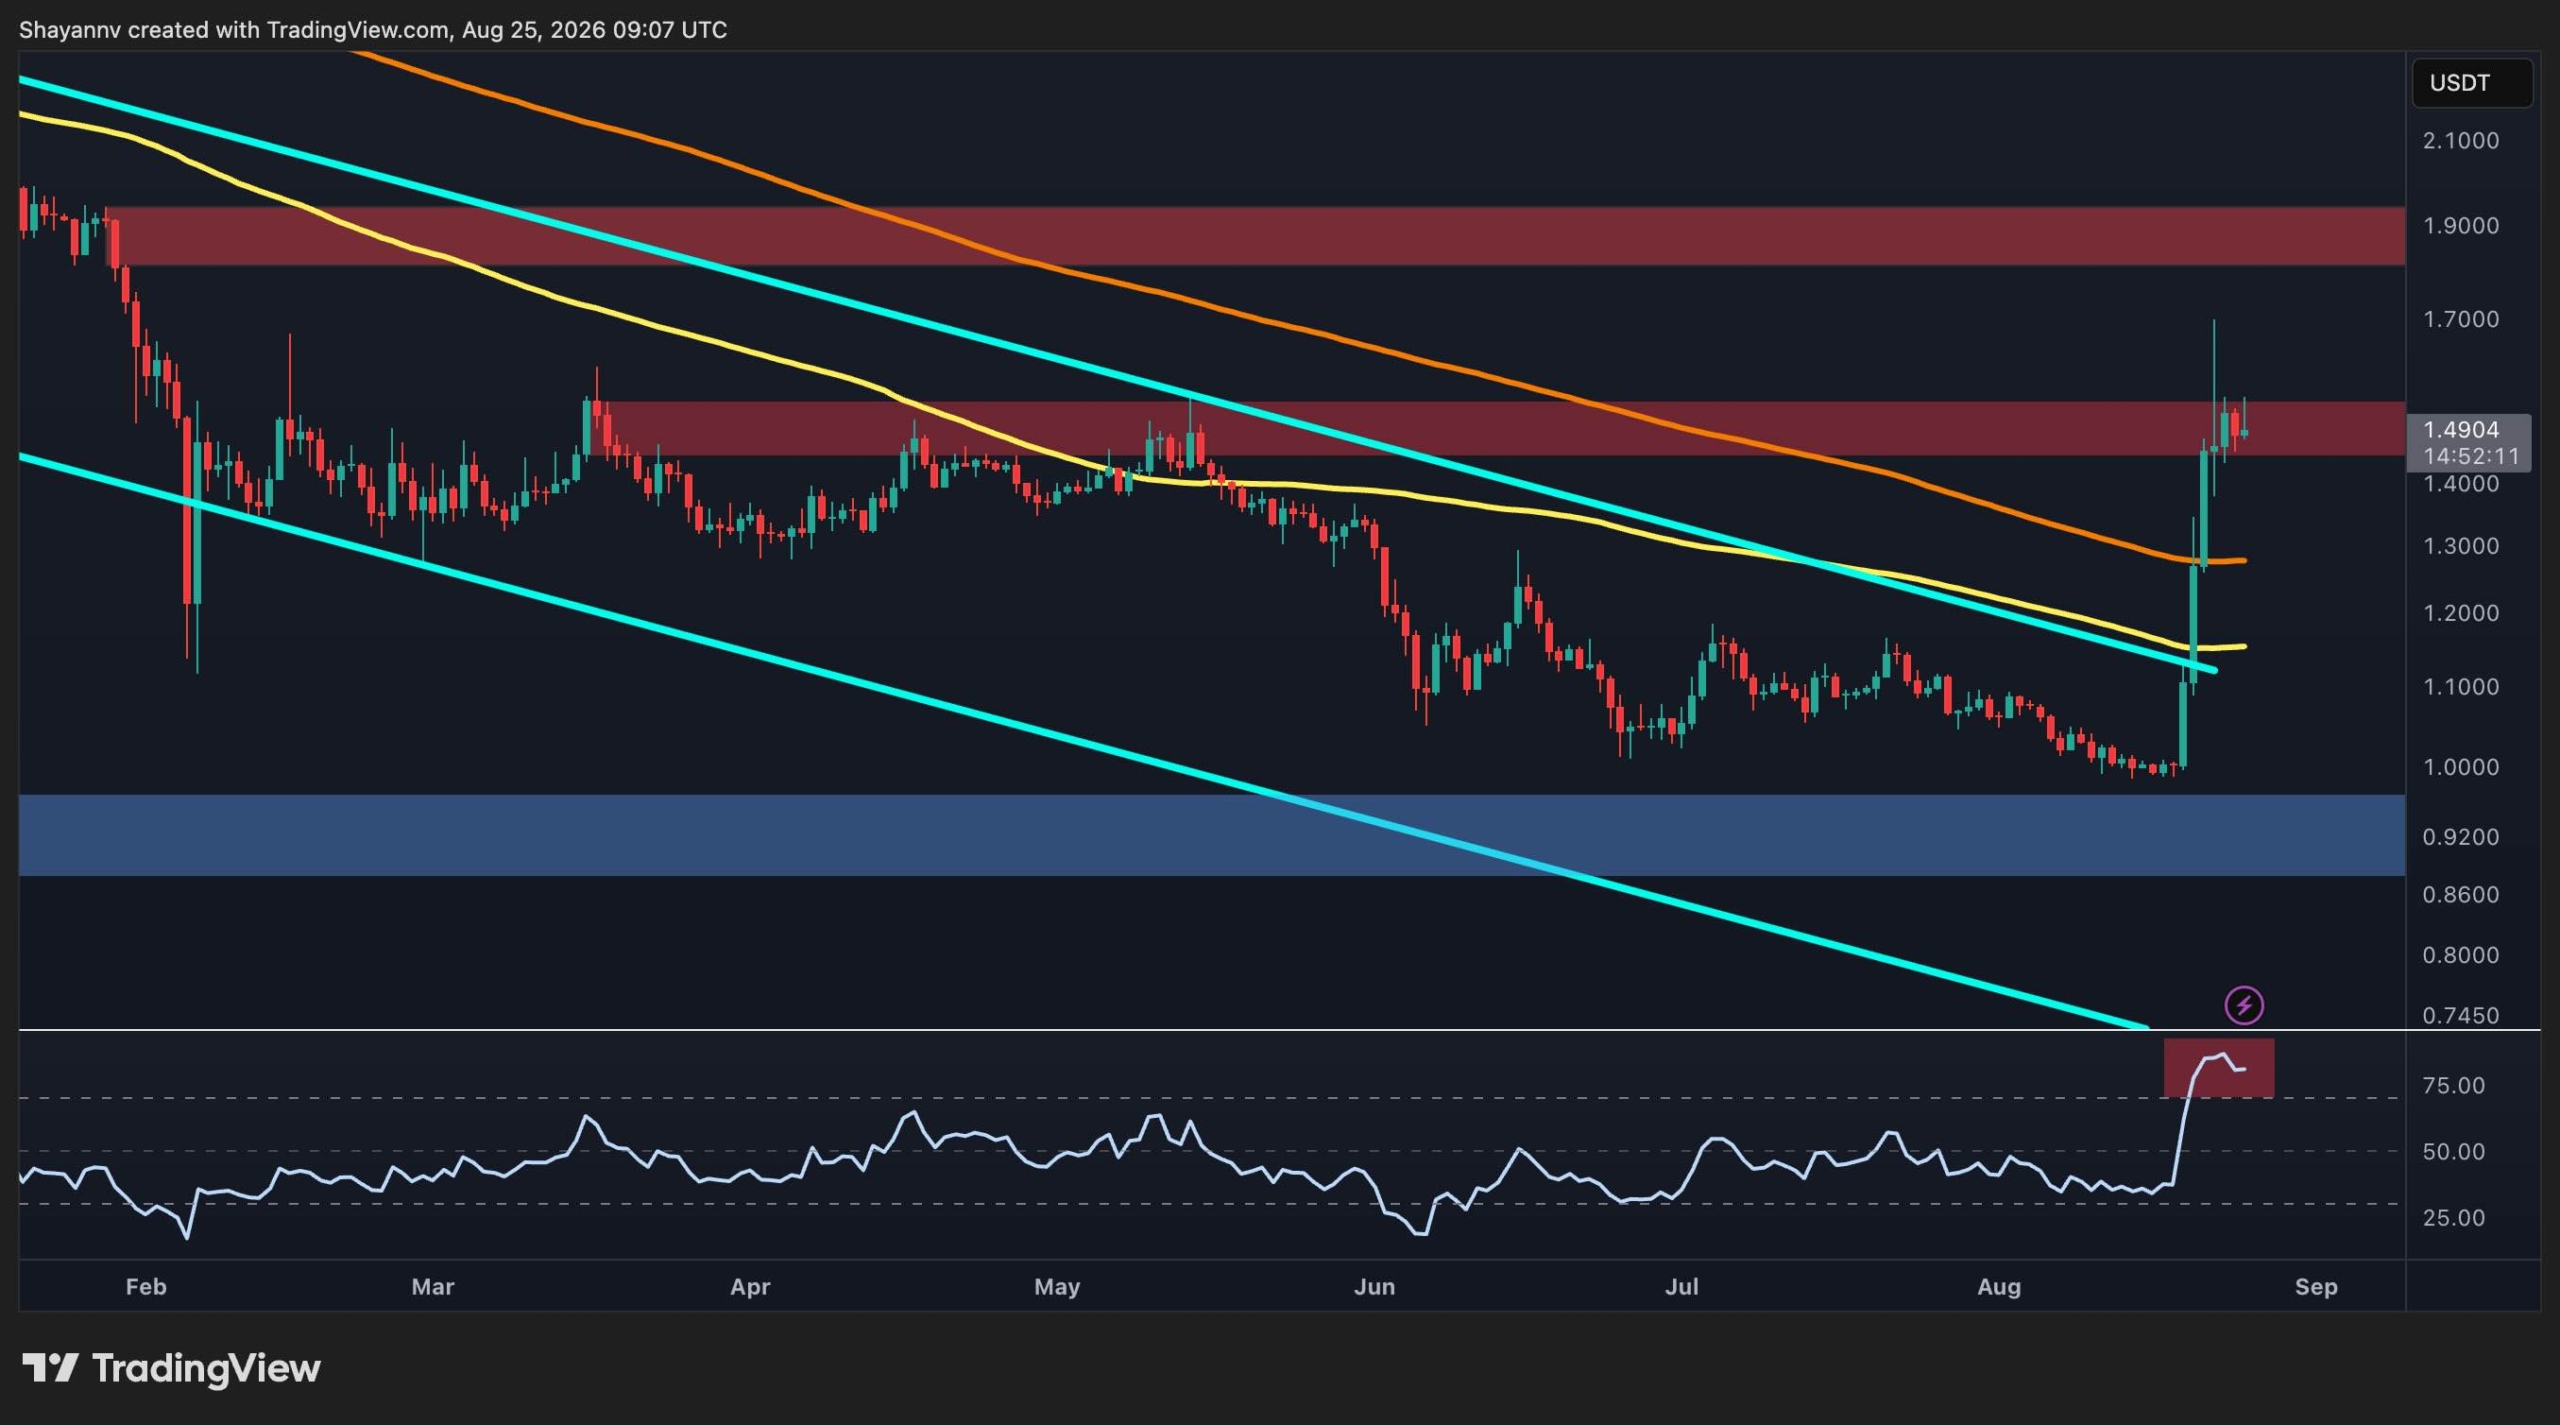
    XRP has experienced a significant rebound, climbing back from the $1.00 mark and successfully breaking through long-standing descending trendlines on both USD and BTC charts. However, the cryptocurrency’s recent rally has now encountered major resistance levels, placing current price action at a crucial juncture for determining its next directional move.

    The digital asset found support around the $1.00 level before breaching its broader descending channel. Subsequently, XRP has re-established its position above both the 100-day and 200-day moving averages, which were previously situated around $1.2 and $1.3, respectively. The move beyond $1.3 has effectively transformed these former resistance points into immediate support zones.

    Currently, XRP is testing the critical $1.50 resistance area, where price consolidation has begun. A decisive daily close above $1.50 could pave the way for a potential advance towards the $1.80-$1.90 range. Conversely, a rejection at this level, followed by a descent below $1.30, would undermine the recent breakout structure and increase the likelihood of a more substantial correction, potentially pushing prices back towards the $1.00 area.

    The Relative Strength Index (RSI) has surged past the 70 mark, remaining in overbought territory. While this indicates strong upward momentum, it also suggests the possibility of a short-term cooldown, which could lead to a retest of the 200-day moving average.

    XRP/BTC Pair Shows Mixed Signals

    On the XRP/BTC daily chart, the price has attempted to break out of its descending channel after reaching a low near 1,500 satoshis. However, unlike its USDT counterpart, this breakout has so far been unsuccessful. The pair briefly traded above the channel’s upper boundary before experiencing a significant rejection wick, indicating persistent selling pressure around this resistance level.

    XRP/BTC is now retracing towards the previously breached 200-day moving average, which is currently serving as a potential support level. The price action around this moving average will be a key determinant for the pair’s next move. If XRP/BTC can maintain its position above this average and solidify the former breakout area as support, another attempt at the 2,000 satoshis resistance zone may follow.

    A successful breach above 2,000 satoshis would bolster the relative strength outlook for XRP against Bitcoin. Conversely, a decisive failure to hold the 200-day moving average would suggest that the recent breakout attempt was a false signal, potentially exposing the pair to further downward pressure. The RSI has also pulled back after a brief stint above 70, reflecting a loss of momentum following the failed breakout and hinting at potential consolidation or correction in the coming weeks.