Tag: Neutral

  • XRP’s 13-Year Top 10 Streak: A Constant in Evolving Crypto Market

    XRP’s 13-Year Top 10 Streak: A Constant in Evolving Crypto Market

    XRP has maintained a consistent position among the top 10 cryptocurrencies by market capitalization for 13 consecutive years, a feat unmatched by any other altcoin besides Bitcoin. This enduring presence underscores its resilience through significant market volatility and regulatory challenges.

    According to an analysis by CoinGecko, XRP, alongside Bitcoin, is the only digital asset to have remained within the top 10 by market cap from 2014 through the projected year of 2026. This remarkable streak has persisted through multiple market downturns, including the 2018 bear market, the COVID-19 crash, the Terra collapse, and the FTX bankruptcy. Notably, XRP has held its ranking despite the ongoing legal action initiated by the U.S. Securities and Exchange Commission (SEC) against Ripple.

    The cryptocurrency landscape has transformed considerably since 2014. Bitcoin’s market share, which stood at approximately 87% in 2014, has decreased to under 57% on CoinGecko, indicating a broader diversification and maturation of the market. Hundreds of projects have entered and exited the spotlight, with many early prominent cryptocurrencies falling out of the top rankings.

    In contrast to Bitcoin’s declining dominance, stablecoins have become a permanent fixture within the top 10 and 20 cryptocurrencies. Exchange tokens like BNB have also solidified their positions alongside traditional layer-1 networks. This year, Hyperliquid’s HYPE token entered the top 10, overtaking Dogecoin and marking a significant milestone for decentralized finance (DeFi) projects.

    Despite its consistent ranking, XRP has experienced considerable price fluctuations. The token reached an all-time high of $3.65 last July but has since seen a 70% decrease. Following the SEC’s action, XRP faced delisting from numerous exchanges, which coincided with a sharp price decline at the time.

    The sustained presence of XRP in the top 10, as reported by CoinGecko, may suggest a degree of market stability and investor confidence, even when navigating regulatory scrutiny. However, it remains uncertain whether XRP will continue this streak for a 14th year. The analysis period extends to 2026, and barring a major market collapse, the cryptocurrency is positioned to potentially extend its record.

    It is important to note that the CoinGecko report analyzed annual market-cap snapshots between 2014 and 2026. While XRP’s consistency is a notable observation, the future performance of any cryptocurrency, including XRP, remains subject to market dynamics and regulatory developments. The exact timing of the SEC’s offensive against Ripple and the specific release date of the CoinGecko report are not detailed in the provided information.

    Why This Matters

    The materials describe a narrow update: A report by CoinGecko analyzed annual market-cap snapshots from 2014 to 2026 and found that XRP, alongside Bitcoin, has been the only cryptocurrency to consistently stay within the top 10 by market capitalization for 13 consecutive years. Whether XRP will continue its streak in the top 10 for a 14th year.

    Broader Context

    Source materials place the factual news in this context: The report by CoinGecko is not new and was released over a month prior to the article’s publication.

  • a16z: TradFi’s Blockchain Demands Revealed

    a16z: TradFi’s Blockchain Demands Revealed

    TradFi’s Blockchain Adoption Driven by Efficiency, Not Ideology, a16z Reports

    Traditional finance (TradFi) institutions are integrating blockchain technology primarily to enhance their existing operations, rather than out of a commitment to decentralization, according to a recent report by venture capital firm a16z.

    The technology’s ability to reduce operating costs, accelerate settlement times, broaden distribution channels, and strengthen customer relationships positions it as a pragmatic business tool, a16z argues, rather than a reflection of an ideological shift.

    Rather than merging with the current decentralized finance (DeFi) landscape, these institutions are selectively adopting elements of blockchain that align with their regulatory, operational, and risk management frameworks, while eschewing features that do not. This curated approach is leading to a new iteration of blockchain-based finance, distinct from both traditional finance and existing DeFi protocols.

    The outcome is the emergence of a programmable financial infrastructure tailored to institutional demands, built upon blockchain technology.

    a16z points to initiatives like JPMorgan’s permissioned blockchain for institutional deposits and tokenized money market funds from BlackRock and Franklin Templeton not as instances of institutions embracing DeFi. Instead, these are seen as strategic uses of blockchain to optimize established financial services such as interbank settlements, fund subscriptions, and yield-generating products.

    These institutions are leveraging blockchain’s inherent programmability, transparency, and atomic settlement capabilities, while deliberately sidestepping core DeFi tenets like open access, pseudonymity, and trustless execution. The emphasis, the report suggests, is on improving the efficiency of traditional financial infrastructure, not on adopting decentralized finance in its original, open form.

    Notably, the blockchain functionalities now being adopted by institutions were initially developed within open, permissionless ecosystems, outside the confines of traditional banks and financial firms. These environments fostered the testing of novel financial models and infrastructure. Consequently, institutional adoption is largely predicated on innovations that originated in the broader crypto ecosystem.

    The report cautions against an overemphasis on banks and asset managers as the sole drivers of the industry, despite their significant role as customers. While these traditional financial institutions represent a substantial source of demand, they do not encompass the industry’s full potential, and opportunities beyond the TradFi sphere should not be overlooked.

    “Designing for institutional requirements is a legitimate and valuable pursuit, but it is only one lane, not the whole road,” a16z concluded.

  • Ethereum Price Tests Support, Outlook Remains Uncertain

    Ethereum Price Tests Support, Outlook Remains Uncertain

    Ethereum’s price is currently at a critical technical juncture, defending key support levels while facing significant resistance, leading to an uncertain outlook for its immediate trajectory. This price action represents a technical decision point that could shape Ethereum’s short-to-medium term direction and influence market dynamics.

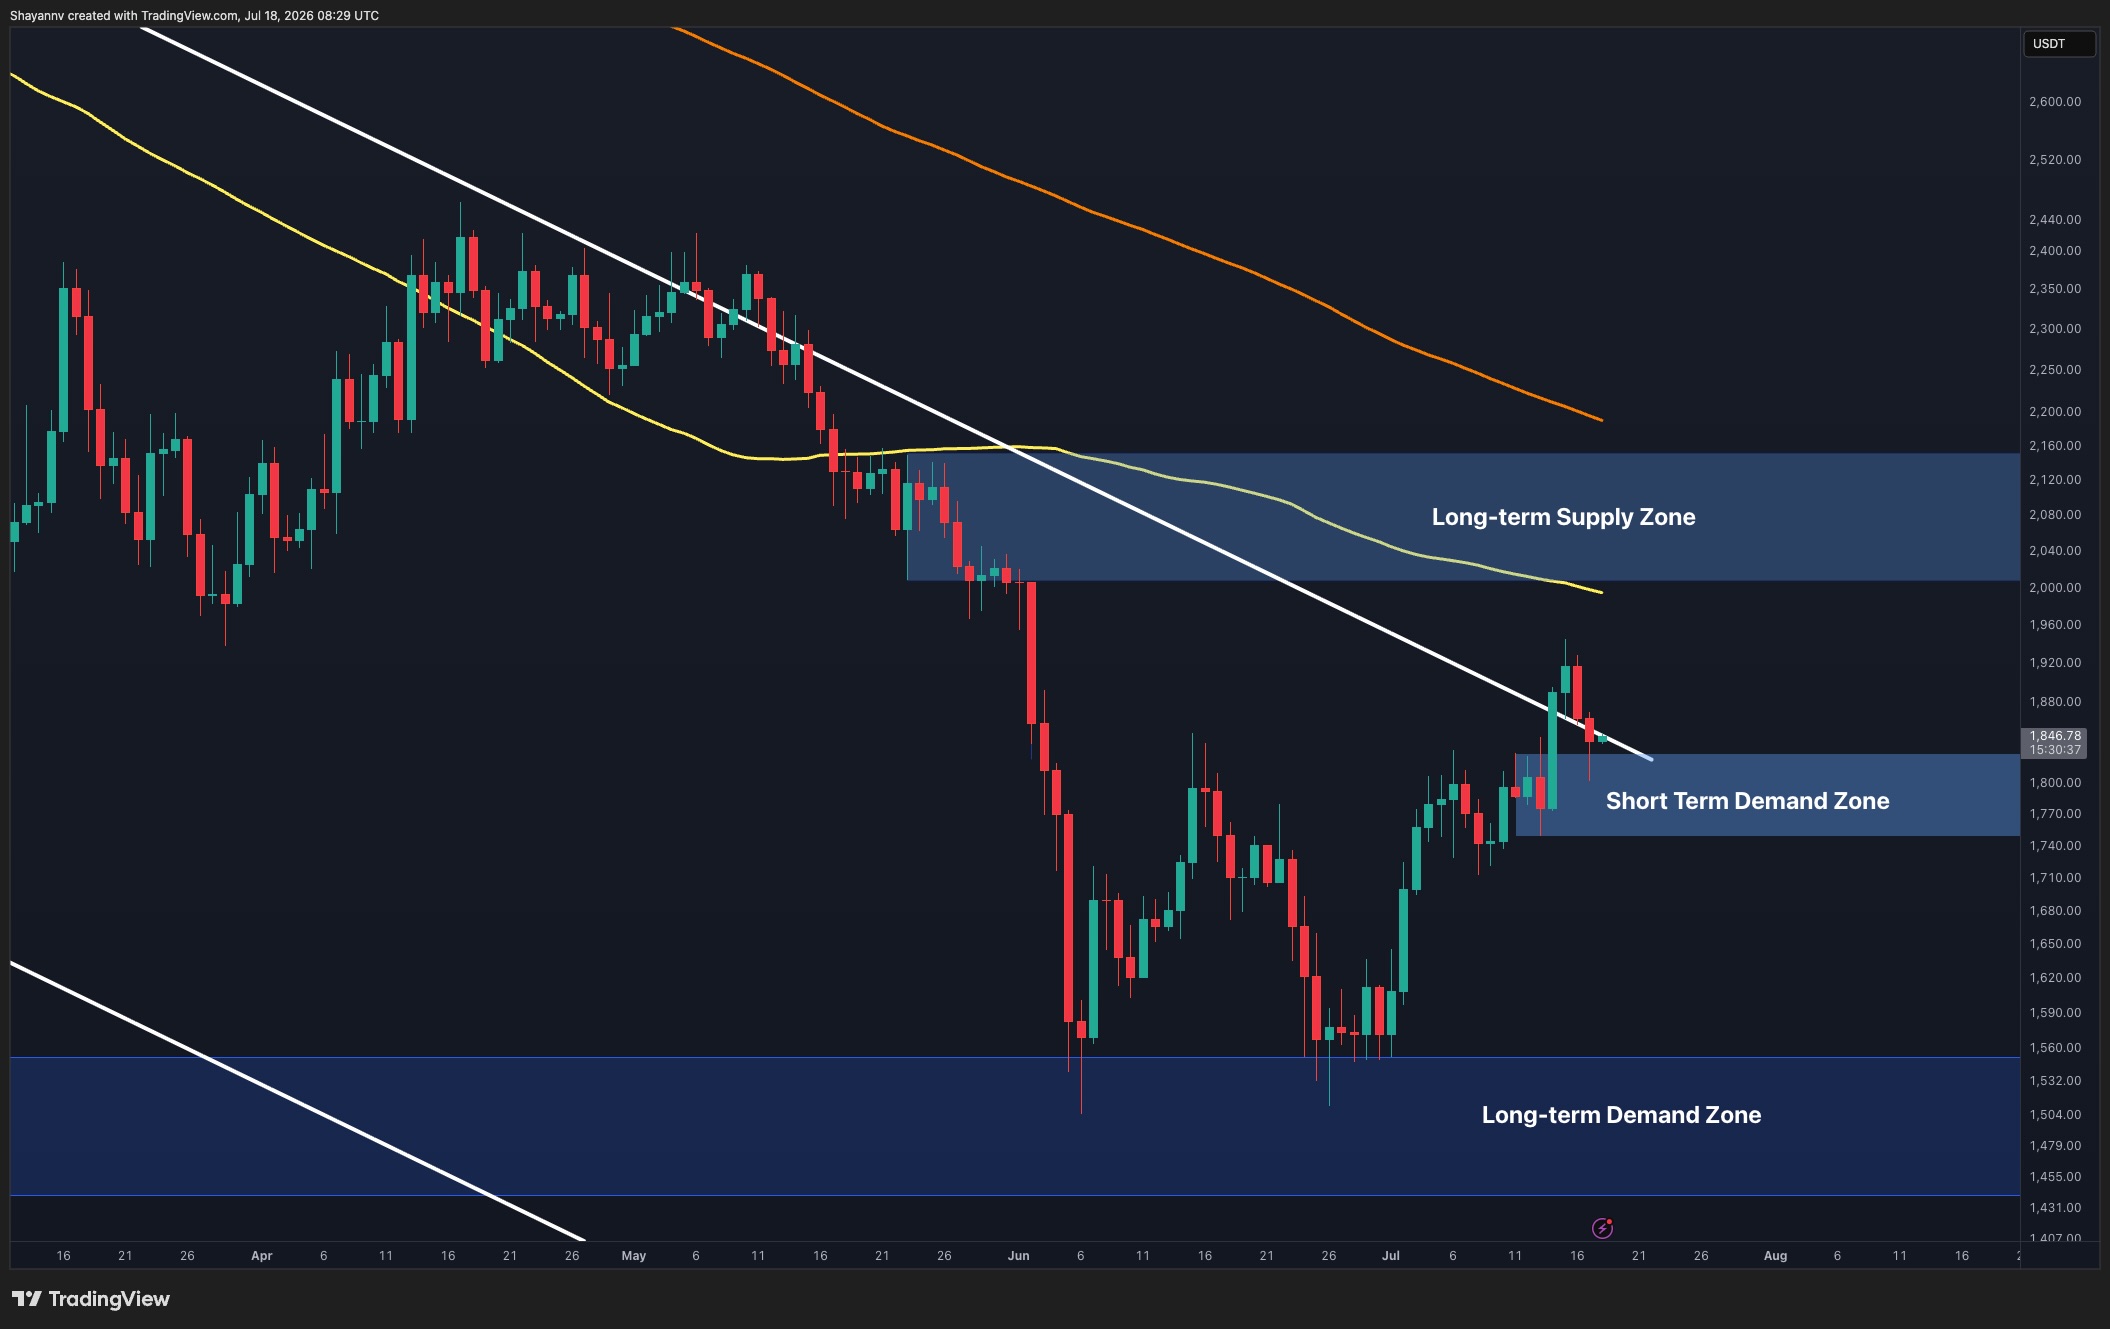
    According to the analysis, Ethereum has pulled back into a demand zone between $1,750 and $1,850 after failing to sustain a move above $1,900. This support zone is critical for buyers to defend to maintain the current recovery structure. On the daily timeframe, ETH continues to trade below the descending 100-day and 200-day moving averages, indicating that the broader market structure remains bearish despite recent rebounds. The asset recently failed to extend above the short-term resistance around $1,900 and has now retreated to this demand zone, which has acted as support throughout the current recovery and represents the first line of defense for buyers.

    Potential Upside and Resistance
    As long as Ethereum holds above this area, another push toward the major decision zone between $2,000 and $2,150 remains possible. This resistance region aligns with the descending long-term trendline and the declining 100-day moving average, making it a significant cluster on the daily chart. A successful move above this confluence would mark an important structural improvement. However, rejection from this zone would likely shift attention back toward the long-term demand zone around $1,450-$1,550.

    Short-Term Dynamics and Liquidity
    The 4-hour chart shows Ethereum pulling back after failing to extend above the recent swing high near $1,950. The correction has brought the price to the short-term demand zone around $1,760-$1,840, which has repeatedly attracted buyers over the past week. This area now serves as the immediate support needed to preserve the sequence of higher lows established since early July. Holding above it could allow another attempt toward the upper boundary of the current recovery structure and eventually the daily resistance around $2,000. Conversely, losing this demand zone would likely expose lower support levels around $1,700 before buyers attempt another recovery.

    Further analysis reveals a large concentration of short liquidations positioned above the current market, with a notable cluster around the $1,950-$2,000 region. This liquidity pool aligns closely with the key technical resistance visible on both the daily and 4-hour charts. The cluster sits directly beneath the higher-timeframe supply zone around $2,000-$2,150 and near the descending trendline, creating a confluence between derivatives positioning and technical resistance. This alignment increases the probability that Ethereum could first stage an upside liquidity grab into the $1,950-$2,000 area to sweep leveraged short positions before facing renewed selling pressure from the overhead supply zone. A decisive move through both the liquidity cluster and the daily resistance would invalidate this scenario and strengthen the case for a broader bullish reversal.

    Outlook and Uncertainty
    It remains uncertain whether buyers can extend the recovery toward higher resistance or if another corrective leg will unfold. The critical question revolves around Ethereum’s ability to hold above the $1,750-$1,850 demand zone. The data suggests that while a liquidity grab before potential rejection is a possibility, the immediate focus remains on the defense of current support levels. A decisive move above the $2,000-$2,150 resistance zone is not guaranteed, and rejection could lead to a retest of lower price levels.

    Why This Matters

    The materials describe a narrow update: Ethereum has pulled back into a demand zone between $1,750 and $1,850. It remains uncertain whether buyers can extend the recovery toward higher resistance or whether another corrective leg unfolds.

    Broader Context

    Source materials place the market analysis in this context: Ethereum remains trapped below a major higher-timeframe resistance cluster despite recovering strongly from its June lows.

  • Crypto Week: MetaMask Incident Contained, Knaken Bankruptcy, Injective Filing, and Robinhood Chain Inflows

    Crypto Week: MetaMask Incident Contained, Knaken Bankruptcy, Injective Filing, and Robinhood Chain Inflows

    The past week has seen a series of distinct developments in the cryptocurrency space, including a security incident at MetaMask, the bankruptcy of exchange Knaken, Injective’s regulatory filing with the US SEC, and significant inflows to the Robinhood Chain. These events highlight ongoing challenges and advancements within the digital asset sector.

    MetaMask Security Incident
    Consensys, the company behind the MetaMask cryptocurrency wallet, reported a security incident involving a consultant with alleged links to North Korea who had access to the project for approximately one month. Consensys stated that access was terminated upon identification of the connection. According to Consensys, investigations found no evidence that user assets or data were stolen, malicious code was deployed, or that users were impacted by the consultant’s involvement. Product releases were temporarily suspended to facilitate a thorough investigation.

    Knaken Bankruptcy and Regulatory Questions
    In Rotterdam, the cryptocurrency exchange Knaken has been declared bankrupt by a court. Reports indicate that approximately €7 million (equivalent to $7.6 million) in customer funds are missing and unaccounted for. Users had been unable to access their funds on Knaken for about a month, as the exchange halted operations in June. The court concluded that Knaken lacked sufficient assets to repay all its customers. This bankruptcy occurs as the European Union’s Markets in Crypto-Assets (MiCA) framework has recently been implemented, raising questions about the framework’s effectiveness in safeguarding customers against unauthorized platforms.

    Injective’s SEC Filing for Tokenized Securities
    Injective, a decentralized finance platform, has submitted a Form TA-1 to the US Securities and Exchange Commission (SEC) to register as a transfer agent for tokenized securities. This filing is interpreted as an effort to bridge public blockchains with regulated US capital markets, potentially facilitating the integration of traditional financial instruments with blockchain technology.

    Robinhood Chain Sees Substantial Early Inflows Amidst Uncertainty
    The Robinhood Chain has experienced significant early adoption, with over $70 million worth of Ethereum bridged to the network within its first weeks. These substantial inflows indicate a high level of initial interest in the new ecosystem. However, it remains to be seen whether this liquidity will persist beyond the initial hype period and develop into sustained trading and application usage. The activity also raises questions about whether it represents genuine demand for tokenized assets or is primarily driven by short-term speculative activity.

    These varied developments underscore the dynamic and often intricate nature of the cryptocurrency industry. While the MetaMask incident was contained without apparent user harm, the Knaken bankruptcy highlights persistent risks and regulatory challenges. Injective’s filing points to evolving pathways for institutional involvement, and the Robinhood Chain’s early traction illustrates ongoing innovation in blockchain infrastructure. The coming weeks will be crucial in observing the longer-term implications of these diverse events.

    Why This Matters

    The materials describe a narrow update: Consensys reported a consultant with links to North Korea worked on MetaMask for a month before access was terminated, with no evidence of data theft or user impact. Whether the liquidity on Robinhood Chain remains after the initial hype period.

    Broader Context

    Source materials place the factual news in this context: It’s easy to get lost in the sea of news coming daily in the cryptocurrency world, from bitcoin price volatility to regulatory battles in Washington and everything in between.

  • Ethereum Price Analysis: Speculative Patterns Suggest Long-Term Potential Amidst Significant Uncertainty

    Ethereum Price Analysis: Speculative Patterns Suggest Long-Term Potential Amidst Significant Uncertainty

    Recent analyses of Ethereum (ETH) suggest the cryptocurrency may be part of a long-term pattern with ambitious price targets, though these projections are highly speculative and accompanied by considerable uncertainty. Verified market data indicates that Ethereum’s price has experienced fluctuations, trading near $1,800 at the time of writing, following a 5% drop in the past 24 hours but remaining up over 3% for the week. This comes after softer US inflation data pushed ETH to a recent high of $1,940, a level not seen in about a month and a half, before it retreated below $1,900.

    Why This Matters

    The materials describe a narrow update: Multiple analysts have shared projections for Ethereum’s future price, with some suggesting a significant long-term upward trend based on technical patterns and market data. The projection of $22,000 for Ethereum is highly speculative.

    Broader Context

    Source materials place the market analysis in this context: The analysis is shared by pseudonymous crypto commentator NoName on July 17.

    Analytical Perspectives on Ethereum’s Trajectory

    One analytical perspective, shared by pseudonymous commentator NoName on July 17, posits that Ethereum could be entering the final stage of a long-term pattern. This analysis, based on a chart shared on X, suggests a potential price target as high as $22,000. The pattern described is an expanding diagonal, characterized by five waves where each successive wave is larger than the last. According to this analysis, the fourth wave found support between $1,072 and $1,385. Expanding diagonals, in theory, often conclude with a fifth wave that surpasses previous cycle highs. This structure is compared to a historical Dow Jones Industrial Average (DJIA) fractal, with the projected target range cited as anywhere from $12,000 to $22,000. This projection carries a low confidence level.

    Another analytical framework, discussed by Crypto Patel, suggests Ethereum might be following a Wyckoff accumulation pattern. This pattern could potentially lead to a price target of $10,000 by 2027 or 2028, provided that the recent swing low around $1,500 remains intact. Crypto Patel also identified a resistance zone between $2,400 and $2,600 as the first significant hurdle for any substantial price advance.

    Further contributing to the market discussion, CW8900, a contributor to CryptoQuant, presented data indicating that Ethereum wallets holding over 100,000 ETH have returned to profitability following recent price rebounds. Historically, large holders, often referred to as ‘whales,’ have typically experienced losses only during major market bottoms, and their return to profit has often coincided with sustained rallies or short-term recoveries. This signal is assessed with medium confidence.

    However, not all analyses point towards immediate upward movement. Analyst Crypto Rover suggests that a repeating 1,369-day cycle could indicate a scenario where Ethereum might dip below $1,500 again before a lasting bottom is established. This perspective introduces a degree of caution regarding the timing of any significant recovery.

    Verified Facts and Inherent Uncertainties

    The verified facts highlight Ethereum’s recent price action, including June lows near $1,500 and its trading range around $1,800. The analysis of these patterns and signals is inherently speculative. The comparison to the DJIA fractal, the interpretation of the expanding diagonal and Wyckoff patterns, and the long-term price targets all carry low confidence. The potential for Ethereum to reach $22,000 or $10,000 is not guaranteed, and the validity of these projections remains uncertain.

    Key uncertainties include the precise resolution of the expanding diagonal pattern, the reliability of the DJIA fractal comparison for ETH, and whether the $1,500 support level will hold. The first major resistance identified is between $2,400 and $2,600. The possibility of a short-term decline below $1,500, as suggested by the 1,369-day cycle analysis, also remains a factor.

    In summary, while various analysts have presented technical patterns and on-chain data suggesting potential long-term price appreciation for Ethereum, these outlooks are speculative. The market remains subject to significant uncertainties, and definitive conclusions about Ethereum’s future recent price action cannot be drawn from current analyses alone.

  • FTX to Distribute $900 Million to Creditors

    FTX to Distribute $900 Million to Creditors

    FTX to Distribute Another $900 Million to Creditors

    FTX, the once-dominant cryptocurrency exchange, announced yesterday that it will commence its fifth creditor distribution at the end of this month, pushing total announced repayments past $10 billion nearly four years after its collapse.

    The upcoming disbursement amounts to $900 million, aligning with the company’s Chapter 11 reorganization plan. According to a press release from the firm, the distribution is set to begin on July 31. Eligible creditors are expected to receive their funds through BitGo, Kraken, or Payoneer within three business days. This repayment specifically applies to creditors with allowed claims in FTX’s Convenience and Non-Convenience Classes who had completed the necessary procedures by June 16.

    The exact amount each creditor receives will vary by class. Users of FTX’s global and U.S. exchanges (ftx.com and FTX US) will see an additional 9% under Class 5a, bringing their cumulative recovery to 105% of the value of their approved claims.

    General unsecured creditors and holders of crypto loan claims will each receive an incremental 3%, with their total expected to reach 103%. Convenience-class creditors, typically representing smaller customer claims, will receive a cumulative 120% of their approved claims following this latest repayment.

    The defunct exchange also plans to distribute $18 million to eligible preferred shareholders on July 31, bringing the total payments from the separate Preferred Shareholder Remission Fund Trust to $95 million.

    It is important to note that these repayment figures do not necessarily mean customers have been made whole in cryptocurrency terms. Claims were assessed in U.S. dollar terms based on crypto prices around FTX’s bankruptcy in November 2022, prior to significant price rallies for most of the involved assets.

    Consequently, receiving 105% or 120% of initial claims in U.S. dollars may still represent a substantially lower value than the current market price of the cryptocurrency assets held on the platform at the time of its collapse. For example, Bitcoin was trading around $20,000 when FTX imploded. Despite subsequent corrections from its all-time high in October 2025, it remains more than 200% higher.

    Sam Bankman-Fried, FTX’s former CEO and widely considered responsible for its rapid downfall, was convicted in 2023 on seven counts of fraud and conspiracy related to the misappropriation of over $8 billion in customer funds.

    He remains incarcerated. Bankman-Fried had sought clemency, particularly after U.S. President Donald Trump issued pardons to Changpeng Zhao and Arthur Hayes. However, in a unanimous vote earlier this week, the Senate resolved that “under no circumstances should Samuel Bankman-Fried receive executive clemency, including a pardon, or commutation.”

  • XRP Eyes $1 Trillion: Analyst Predicts ‘Kaboom 4’ – Is It Realistic?

    XRP Eyes $1 Trillion: Analyst Predicts ‘Kaboom 4’ – Is It Realistic?

    Ripple’s token, XRP, is no stranger to ambitious price predictions, often bordering on the fantastical. While such forecasts can capture attention during bull market surges, their realization seems improbable when the underlying asset languishes 70% below its all-time high.

    However, market conditions akin to the present are often a prerequisite for full capitulation, paving the way for the next upward trajectory. This analysis delves into EGRAG CRYPTO’s outlook for XRP and its potential path to a $1 trillion market capitalization.

    EGRAG CRYPTO is recognized for its optimistic XRP price analyses, frequently projecting targets exceeding $10 for the next market cycle’s peak. In his latest assessment, the analyst highlighted that XRP’s monthly market cap continues to adhere to a macro pattern that has recurred throughout its 14-year history.

    He posited that each significant cycle has commenced with a retest of a long-term ascending structure, coupled with the 33-period simple moving average, preceding an explosive rally. These phases, dubbed ‘Kaboom,’ have historically delivered remarkable expansions, including a 95% surge in the first instance, followed by subsequent cycles generating gains of approximately 15 times.

    EGRAG now believes XRP has entered the fourth iteration of this pattern. He has identified $64.1 billion, $48.8 billion, and $37.2 billion as crucial support levels for the market cap, which XRP must maintain to validate the bullish structure.

    Should these levels hold, EGRAG forecasts subsequent targets based on Fibonacci extensions: $130 billion, $310 billion, $493 billion, and ultimately $955 billion.

    While acknowledging that a long-term symmetrical triangle projection could theoretically point to a market cap exceeding $2 trillion, he considers the $1 trillion target a more conservative and attainable objective.

    Despite the current XRP market cap being under $70 billion, making these trillion-dollar targets appear distant, it is noteworthy that the token has a history of surprising investors.

    Nevertheless, a surge from under $70 billion to $955 billion would necessitate an extraordinary increase of over 1,250%. While not theoretically impossible, the prevailing market environment is far from conducive.

    A $955 billion market cap would translate to an XRP price well above $10, even with the monthly unlocking of new coins. This valuation would also position XRP significantly above Ethereum’s current market cap and approach that of Bitcoin, the only cryptocurrency to have achieved a trillion-dollar market cap.

    Potential catalysts for such a substantial rally could include the growth of Ripple, the company behind XRP. Ripple has undertaken significant initiatives over the past year, including acquisitions, regional expansions, and partnerships, though these have yet to translate into a boost for its native token.

    Furthermore, ETF inflows would need to surge to levels seen shortly after their launch, rather than the current subdued interest.

    Consequently, while XRP reaching these ambitious targets is conceivable, it would require substantial shifts in market narratives, improved economic conditions, a more favorable perception of risk-on assets, and a confluence of other supportive factors.

  • Bitcoin Bottom at $57.7K? Analysis Weighs In

    Bitcoin Bottom at $57.7K? Analysis Weighs In

    Bitcoin’s Bear Market: Has the Worst Passed?

    Bitcoin’s recent slide to approximately $57,700 at the close of June may signal the end of the most severe phase of its 2026 bear market, according to a new market analysis released by BIT on July 17.

    The crypto investment firm, which accurately predicted much of Bitcoin’s recent decline, now advises traders to evaluate whether this low point represents the conclusion of the correction or merely a temporary reprieve before a further downturn.

    BIT’s latest report builds upon research published on June 12, where the firm posited that Bitcoin had entered the final stage of its bear market. At that time, BIT outlined an Elliott Wave A-B-C correction pattern originating in October 2025. This pattern predicted an initial sell-off into the $60,000 to $69,000 range, followed by a rebound towards $80,000 to $90,000, and culminating in a final Wave C drop during the 2026 FIFA World Cup, which is scheduled to conclude on July 19.

    This forecast has largely materialized. Bitcoin initially plunged from around $97,000 to $62,900 in February of this year before recovering to approximately $82,000 in May, an event the report characterized as a “counter-trend rally within a bear market.” Subsequently, the cryptocurrency fell further, eventually reaching $57,700 at the end of June, a decline attributed to geopolitical tensions and shifting expectations regarding U.S. monetary policy, which exerted significant pressure on risk assets.

    In its July 17 update, BIT acknowledged that it had underestimated the impact of the conflict between the United States and Iran, which contributed to higher-than-expected inflation, and the hawkish stance adopted by the new Federal Reserve chair, Kevin Warsh. Despite these factors, the firm maintained that the broader price structure closely aligned with its initial outlook.

    The earlier report also highlighted several technical indicators suggesting a potential market bottom, including historically depressed sentiment and oversold stochastic readings. Furthermore, at that time, Bitcoin was trading significantly below its weekly moving average. The new analysis shifts focus to the 21-week moving average, identifying it as a crucial indicator for determining whether the market has transitioned back into a longer-term uptrend.

    However, not all market observers agree that a bottom is forming. For instance, IT Tech, a contributor to CryptoQuant, expressed skepticism in a note titled “You really think the bottom is already in?” IT Tech pointed to a notable decline in spot Bitcoin ETF flows in 2026, which had been a primary driver of the cryptocurrency’s rally over the past two years.

    In 2024, cumulative net inflows exceeded 500,000 BTC, with 2025 recording similarly robust inflows of approximately 250,000 BTC. In contrast, 2026 has witnessed outflows of roughly 120,000 BTC. This trend leads the analyst to question: “If ETF demand drove the rally up, how can you be bullish while that demand reversed completely?” According to IT Tech, the market is currently experiencing headwinds rather than tailwinds.

    Earlier this week, Bitcoin briefly surpassed the $65,000 mark following the release of U.S. CPI data that came in significantly lower than market expectations. However, these gains were quickly eroded by sellers. At the time of writing, the asset was trading near $63,000, representing a nearly 3% decrease over 24 hours and approximately 2% over the past week. The cryptocurrency remains over 50% below its all-time high.

  • Hardware Wallet Security Debated as Investigator Questions Self-Custody Alternatives

    Hardware Wallet Security Debated as Investigator Questions Self-Custody Alternatives

    The security and practicality of cryptocurrency self-custody solutions are under scrutiny following a prominent investigator’s critique of hardware wallets. The debate, which has unfolded across platforms like Telegram and X (formerly Twitter), questions the efficacy of dedicated hardware devices compared to alternatives such as dedicated mobile phones or multi-signature setups.

    Crypto investigator ZachXBT ignited the discussion by stating on his Telegram channel that hardware wallets are “complete garbage” and not advisable for storing funds or signing transactions. He suggested that a spare iPhone could serve as a more practical alternative for users handling significant amounts of cryptocurrency. ZachXBT specifically criticized Ledger, claiming that its Ledger Live software frequently undergoes updates that disrupt basic functionalities. He also listed potential issues with hardware wallets, including battery failures, mandatory upgrades, user interface changes, and bugs that can prevent multisignature transactions.

    In response to ZachXBT’s assertions, other figures in the crypto space offered their perspectives. Axel Bitblaze questioned the security of using a phone as a replacement, noting it could represent a single point of failure. Bitblaze recommended a 2-of-3 multisignature setup using separate signing devices as a more robust solution. Roman Storm, who is facing a prison term after being convicted of operating an unlicensed money-transmitting business in 2025, agreed with the concept of using a mobile device but pointed out that current mobile wallets often lack support for BIP39 passphrases, a key advantage of hardware wallets for enhanced security.

    Wallet manufacturers also weighed in on the debate. Trezor argued that phones, running full operating systems, present numerous potential attack vectors. In contrast, hardware wallets are designed as dedicated devices that keep private keys isolated from general computing environments. Keystone Wallet acknowledged the potential of an isolated phone but maintained that purpose-built hardware wallets are generally better suited for most users, emphasizing that phone security relies heavily on strict user discipline. Ledger, while not directly addressing ZachXBT’s claims, reiterated its security model, stating that private keys which never touch the internet cannot be phished or compromised through online means.

    The discussion also touches upon the inherent risks in self-custody. An incident earlier this year saw a victim lose $282 million in Bitcoin and Litecoin from an offline device due to a social engineering scam, highlighting that even offline storage is not immune to sophisticated attacks.

    The debate underscores that no single self-custody solution is universally perfect. Users must consider the trade-offs between security, usability, and the specific risks associated with each method. While hardware wallets offer a dedicated, offline environment for private keys, their usability can be hampered by updates and potential bugs. Mobile devices, if properly secured and potentially enhanced with features like BIP39 passphrase support, could offer an alternative, but they also introduce the risks associated with general-purpose operating systems. Ultimately, the choice of self-custody solution depends on an individual’s risk tolerance, technical expertise, and security priorities.

    Why This Matters

    The materials describe a narrow update: ZachXBT claimed hardware wallets are ‘complete garbage’ and suggested a spare iPhone could be a better alternative for signing transactions and storing funds. Ledger’s direct response to ZachXBT’s claims.

    Broader Context

    Source materials place the factual news in this context: The debate was sparked by ZachXBT’s claims on his Telegram channel.

  • Cardano Surges on Decentralization Push

    Cardano Surges on Decentralization Push

    Cardano’s Founding Developer Cedes Control of Core Infrastructure

    Input Output Global (IOG), the primary developer behind the Cardano blockchain, announced Friday it will transfer control of key blockchain infrastructure to external specialist firms. This significant shift, commencing in August, will see the Haskell node, Plutus smart-contract platform, Daedalus wallet, and Hydra scaling technology all transition to outside management.

    External Firms to Oversee Cardano’s Core Components

    Among the firms taking over are Se7en Labs, a development agency with prior experience in Solana infrastructure, and Teragone, a cryptographic research team already spearheading development of Mithril, Cardano’s stake-based signature protocol. The plan involves running at least three independent node implementations in Haskell, Rust, and Go concurrently. Oversight of these operations will be managed by community bodies Intersect and Pragma. This comprehensive transition is slated to conclude by 2027.

    The blockchain’s new guiding principle will be: “Built by many, owned by all.”

    Voltaire Era Nears Completion with Decentralization Push

    Charles Hoskinson, Cardano’s founder, characterized this move as the final push of the Voltaire era, the phase of governance and decentralization that Cardano has been progressively building towards since 2024. “Our partners are ready, and the ecosystem now has many diverse options,” Hoskinson stated in the IOG Group announcement.

    Cardano’s protocol and governance mechanisms are already decentralized. This transition extends that decentralization to its engineering operations.

    An official statement from Input Output Group on July 17, 2026, read: “The last stage of the Voltaire era is full decentralization of node and reference blueprint development. Since 2024, IOG and its partners have carefully managed a process that will conclude…”

    Van Rossem Hard Fork Set to Go Live

    The Van Rossem hard fork is scheduled to go live on the mainnet on July 18 at 21:44 UTC. This upgrade, ratified on July 13 with 77.63% approval from delegated community representatives, will advance Cardano to Protocol Version 11. It also introduces new Plutus built-in functions aimed at reducing smart contract execution costs.

    Market Performance and Investor Sentiment

    Cardano, trading under the ticker ADA, saw a modest increase of approximately 2% on the day, trading near $0.165 with a market capitalization of $6 billion. Open interest in ADA futures stands at around $193 million. The current long-to-short ratio of 2.84 suggests that a majority of traders are anticipating a price surge.

    Input Output Global’s Future Focus

    For Input Output Global, this handover marks the end of a significant chapter. The company will now redirect its efforts towards research and new ventures through its IO Labs and IO Ventures divisions. The responsibility will fall upon the community to demonstrate whether a decentralized engineering model can achieve greater velocity than the system it is replacing.

    Technical Analysis and Future Outlook

    From a purely technical standpoint, a rapid upward trend appears unlikely in the immediate future. ADA has not approached its 2024 highs of nearly $1.20, and current chart indicators are not encouraging. The coin has been in a downward grind since August 2025, with the 50-week exponential moving average falling below the 200-week average.

    The Relative Strength Index (RSI), a momentum indicator, is currently at 34. On a scale of 0 to 100, readings above 70 are considered overbought and below 30 oversold. The Average Directional Index (ADX), which measures trend strength, indicates a strong bearish long-term trend. Investing at current levels appears to be an act of faith rather than a conviction-based trade.

    However, ADA has surprised traders in the past. If the Van Rossem hard fork successfully delivers on its cost-reduction promises, the Leios upgrade arrives as scheduled, and decentralized engineering proves more productive than the current model, investors holding ADA at 16 cents could potentially see significant upside.