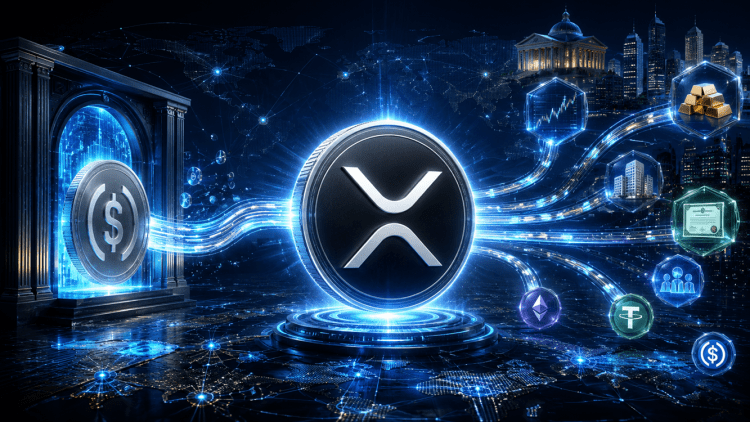
ChatGPT, the artificial intelligence developed by Sam Altman, is forecasting a significant upward movement for XRP over the next 30 days, projecting a price target between $1.55 and $1.80. This optimistic outlook contrasts with XRP’s current trading price of $1.238. According to the AI’s analysis, a “squeeze scenario” pushing the price toward $1.60 and beyond could be triggered if XRP successfully reclaims the $1.35 level as support.
A Clear Bullish Signal
The bullish case presented by ChatGPT is straightforward, with the timing of the potential catalyst adding a layer of intrigue to this week’s XRP price predictions. After months of underperformance, a substantial amount of capital is reportedly on the sidelines, awaiting a clear signal to re-enter the market. ChatGPT suggests this signal may be imminent.
Several factors are contributing to this optimistic forecast: growing institutional interest in exchange-traded funds (ETFs), an uptick in activity on the XRP Ledger (XRPL), and the dissipation of regulatory uncertainty that has historically suppressed participation. The AI posits that the convergence of these three elements could pave the way for aggressive capital rotation once Bitcoin stabilizes and allows altcoins more room to maneuver.
The $1.35 mark is identified by ChatGPT as a critical technical trigger. Currently acting as resistance, its conversion into support, confirmed by volume, would signify a shift from a period of range-bound trading to a momentum-driven surge towards $1.60 and higher. This precise identification of a technical level offers a tangible benchmark, moving beyond vague directional forecasts.
The Bearish Counterpoint
The AI also outlines a specific bearish scenario. The zone between $1.15 and $1.18 is identified as the most crucial support level on the downside. A decisive breach of this area could lead to a liquidity flush, pushing XRP’s price towards $1.00, a level not seen since before its significant breakout in late 2024.
Potential catalysts for such a downturn include broad market weakness or a waning of ETF momentum. Both are considered live risks given Bitcoin’s current market position.
Chart Analysis and Historical Context
XRP is closing the current week at $1.238, marking a nearly 7% decline over the past seven days. The weekly chart, extending back to early 2024, reveals a pattern not observed since the initial breakout in late 2024: the price is approaching the “launch zone” where significant institutional repricing began.
The rapid ascent from $0.55 to $3.40 in late 2024 occurred too quickly to establish robust structural support levels. This speed, while fueling the initial surge, now hinders recovery, as there are few strong historical support zones between $1.00 and $1.60 built through accumulation rather than simply being traversed during a parabolic move.
The $1.20 level represents the closest approximation to a genuine floor on the current chart, having been tested and held on multiple weekly closes since February. This week’s candle low of $1.188 dipped below $1.20 intraweek before recovering to close at $1.238, mirroring the wick behavior observed at the February low. Such instances of trading below support followed by a recovery close are often interpreted as a final liquidity grab before a substantial bounce, aligning with ChatGPT’s $1.15 to $1.18 bearish floor.
If the $1.20 level holds on a weekly closing basis, the base between $1.20 and $1.60 is expected to remain intact, keeping the $1.55 to $1.80 target within reach. A break below this level would point to $1.00 as the next significant historical level, marking the beginning of pre-election institutional positioning in late 2024.
The Rotation Beyond Established Assets
The market rotation is already underway, though its direction may not be immediately apparent to many. Large-cap cryptocurrencies are not necessarily “broken” but rather “capped,” with Bitcoin, Ethereum, and XRP all encountering similar resistance bands tested repeatedly in recent weeks.
The anticipated macroeconomic relief that could fuel the next leg of the rally continues to be delayed, and expected institutional inflows are being pushed back. Holding assets whose upside is entirely dependent on external catalysts presents a strategy with a discernible ceiling.
Savvy investors who understand market cycles are reportedly moving their capital before the next trend becomes obvious. Early-stage infrastructure projects, operating with fundamentally different market dynamics, offer the potential for dramatic price movements with relatively modest capital rotations due to their smaller market capitalization.
The upside potential in these nascent projects remains largely unpriced, as the market has yet to fully discover their value. This gap between intrinsic worth and current market perception is where asymmetric returns can be generated.
LiquidChain: Addressing DeFi Fragmentation
Multi-chain fragmentation poses a persistent and costly challenge in decentralized finance (DeFi). Bitcoin, Ethereum, and Solana each operate with isolated liquidity infrastructure, lacking native interoperability. Users transferring value between these ecosystems incur costs through fees, slippage, and failed transactions.
LiquidChain aims to eliminate these costs by consolidating these three networks into a single execution layer. This approach promises a unified deployment with full ecosystem access, removing the “cross-chain tax” on every interaction.
The LiquidChain presale is currently priced at $0.01454, with over $700,000 raised. This is described not as marketing jargon but as an accurate reflection of its current lifecycle stage.
The project acknowledges that its execution and adoption remain unproven, presenting real risks that are openly stated. While established assets offer a more predictable path to a visible ceiling, LiquidChain presents an opportunity to participate in a project at its foundational stages.