Category: Uncategorized

  • DTCC Collateral Lists Clarify XRP Status, Dispelling Delisting Rumors

    DTCC Collateral Lists Clarify XRP Status, Dispelling Delisting Rumors

    DTCC Update Sparks Crypto Panic, Misinterpreted by Retail Traders

    A recent update regarding collateral eligibility from the Depository Trust and Clearing Corporation (DTCC) circulated on Crypto Twitter, triggering a wave of panic among retail investors. This led to a sell-off of Ripple’s XRP and a shift into Stellar’s XLM, fueled by the belief that the DTCC had effectively blacklisted Ripple’s token from institutional infrastructure. However, this interpretation is inaccurate.

    The DTCC’s collateral eligibility lists serve as post-trade operational reference tools, not directives for exchanges. Analysts are characterizing the resulting price dip as a “Fear, Uncertainty, and Doubt” (FUD)-driven capitulation event, rather than a structural delisting.

    On-chain data revealed $900 million in weekly Ripple realized losses during the peak of the panic, marking the largest capitulation spike since 2022, when realized losses reached approximately $1.93 billion. Historically, such spikes have often signaled local bottoms.

    The retail rotation from XRP to XLM, following the DTCC–Stellar Development Foundation tokenization partnership announcement, was a misinterpretation of back-office infrastructure as a trading signal.

    Understanding the DTCC’s Role

    The DTCC is a critical component of U.S. capital markets. Its subsidiaries, the National Securities Clearing Corporation (NSCC) and the Depository Trust Company (DTC), handle clearing, settlement, and custody for trillions of dollars in securities transactions daily.

    Collateral eligibility lists published by these entities specify which assets are acceptable for use within the DTCC’s clearing and margin operations. These lists govern what banks and broker-dealers can pledge as collateral within that specific post-trade infrastructure.

    Misconceptions and Reality

    The focus on the DTCC’s partnership with Stellar overlooks the broader context. The DTCC launched a Tokenization Working Group in May, with Ripple’s involvement. Additionally, the DTCC adopted Chainlink (LINK) CRE standards in May. The partnership with XLM, announced later, was misinterpreted as a preference for XLM over XRP.

    The DTCC’s lists do not instruct exchanges to delist any assets. The assumed chain of events – collateral eligibility update, XRP absence from the list, institutional trading ban, and exchange delisting – is flawed at every step. Exchange listing decisions are based on each venue’s risk framework, regulatory standing, and commercial judgment, which are separate from DTCC’s back-office operations.

    The DTCC has also emphasized its chain-agnostic approach to digital assets. Its 2024 “Great Collateral Experiment” involved tokenized collateral across multiple networks with 10 major banks, demonstrating interoperability as a key design principle.

    The Ripple Effect

    The misinterpretation followed a familiar pattern. Screenshots of DTCC and NSCC eligibility files were shared on Crypto Twitter without proper context. XRP’s status on these lists was then interpreted as evidence of an impending delisting. This narrative was amplified by influencers, prompting an emotional reaction from retail traders, and causing XRP to fall below $1.30 as the rotation accelerated.

    The DTCC–Stellar announcement further fueled the confusion. The Stellar Development Foundation’s partnership with DTCC, with DTC-tokenized assets expected to launch on the Stellar network in the first half of 2027, was seen by some as a displacement of XRP from institutional pipelines. This interpretation disregards the DTCC’s multi-chain strategy and the fundamental nature of global financial infrastructure, which does not operate on a winner-take-all basis.


  • Bitcoin Strategy Shift? Standard Chartered Bullish on Ethereum’s Future.

    Bitcoin Strategy Shift? Standard Chartered Bullish on Ethereum’s Future.

    Crypto markets are ending the week on a surprisingly strong note, with Bitcoin holding steady despite significant options expiry pressure. The crypto community is currently navigating three key narratives: movements from Michael Saylor’s Bitcoin holdings, Standard Chartered’s comparison of Ethereum’s long-term potential to Amazon’s early growth, and Vitalik Buterin’s announcement that he is writing a sci-fi novel about decentralized governance.

    Geopolitical Developments

    Adding to the market’s dynamics, reports indicate that the U.S. and Iran have reached an agreement on a memorandum of understanding, including a 60-day ceasefire. This development, which is reportedly awaiting final approval from Donald Trump, could potentially boost the entire risk sector if confirmed.

    MicroStrategy’s Bitcoin Transfers

    A significant development involves MicroStrategy, with 411.48 Bitcoin transferred to Coinbase Prime. This move has drawn considerable scrutiny, and Polymarket odds that MicroStrategy will sell any Bitcoin before the end of the year have risen to 84 percent. However, this could be a routine treasury management or custody adjustment. While MicroStrategy’s Bitcoin holdings are currently in the red, the company remains a core holder, and there are no signs of panic. If Michael Saylor does sell some Bitcoin, it would likely be part of the company’s strategy to fund high dividends on preferred stock and optimize its balance sheet. These moves appear strategic rather than bearish.

    Standard Chartered’s Ethereum Outlook

    Standard Chartered has issued a bullish outlook on Ethereum, suggesting a potential 1,000x upside by comparing ETH’s growth potential to Amazon’s. In a recent client note, Geoffrey Kendrick, Standard Chartered’s Global Head of Digital Assets Research, compared Ethereum’s current price action to Amazon after the 2001 dot-com crash. Kendrick noted that Ethereum will eventually catch up to its internal metrics. Standard Chartered reaffirmed its bullish ETH price targets of $4,000 by the end of 2026 and $40,000 by the end of 2030.

    Vitalik Buterin’s Novel

    Adding an unexpected element, Vitalik Buterin, the face of Ethereum, announced that he is writing a sci-fi novel about decentralized governance. This news has become a community meme, but it could also indicate Buterin’s continued focus on visionary ideas beyond code.

    Sui Network Outage

    In other news, the Sui network experienced a two-hour stall before recovering. This brief outage had little impact on market sentiment and was quickly resolved.

    SEC Approvals

    The SEC has granted Paxos clearance, providing another regulatory green light for stablecoins and infrastructure players. This move alleviates compliance concerns and could encourage more institutional participation.

    Upcoming SEC Meeting

    Looking ahead to next week, the SEC Investor Advisory Committee meeting will be held on June 4. The agenda includes private market assets, passive index funds, shareholder proxy voting, and quarterly versus semi-annual reporting. This meeting could affect crypto, retail protection, and fund rules. Any constructive tone could spark fresh buying.

    Market Outlook

    Overall, despite early-week challenges, the crypto market appears poised for upside. Geopolitical stability, regulatory clarity, and the positive momentum surrounding Ethereum create a favorable environment. The situation with MicroStrategy’s Bitcoin holdings appears tactical, and Vitalik’s creative endeavors contribute to the culture. With potential headwinds seemingly behind us, there is reason to remain bullish.

  • Cardano Millionaire Wallets Hold Most ADA Since 2017

    Cardano Millionaire Wallets Hold Most ADA Since 2017

    Cardano Whales Accumulate, Holdings Reach Highest Point Since 2017

    On-chain data indicates that Cardano addresses holding at least one million ADA have reached their highest combined holdings since 2017. The trend suggests continued accumulation by large Cardano investors.

    In a recent post on X, the on-chain analytics firm Santiment discussed the latest developments in the supply distribution among significant Cardano investors. The “Supply Distribution” metric tracks the amount of ADA held by specific wallet groups. These groups are categorized based on the number of ADA tokens held in their balances. For this analysis, the focus is on wallets holding a minimum of one million ADA. At current exchange rates, this equates to approximately $230,000, representing a substantial investment.

    Santiment’s chart illustrates the supply distribution trend for these “Cardano millionaire” wallets over the past decade. The graph reveals an upward trend since 2024, indicating that large investors, often referred to as “sharks” and “whales,” have been increasing their ADA holdings.

    Santiment noted that accumulation by key stakeholders generally signals confidence from those with the most significant investments and potential gains or losses. Notably, this upward trend has persisted despite the overall bearish sentiment in the cryptocurrency market since the fourth quarter of 2025, suggesting that the price decline has not deterred large investors from accumulating the altcoin.

    Following the latest increase, the total holdings of these wallets have reached 25.11 billion ADA tokens, the highest level since December 2017. In terms of supply percentage, these key holders currently control 64.49% of all circulating ADA, the highest share since July 2020.

    “As a long-term indicator, this is a bullish signal for those who can be patient enough to hold,” stated Santiment.

    However, while accumulation by Cardano whales has been consistent, the indicator warrants continued monitoring. The chart reveals a similar trajectory during the 2022 bear market, followed by a selloff by large holders that drove the coin to its cycle lows.

    At the time of writing, Cardano is trading around $0.23, down nearly 6% over the past week.

  • Dell Stock Surges After AI-Driven Earnings

    Dell Stock Surges After AI-Driven Earnings

    Dell Technologies has emerged as a major beneficiary of the artificial intelligence boom, with investors driving up the stock price following a strong earnings report.

    Stock Surge and Political Attention

    The rally has also attracted political attention after former President Donald Trump praised the company earlier in May.

    Dell Technologies experienced a significant surge in its share price during after-hours trading. This followed the company’s first-quarter results, which significantly surpassed Wall Street expectations, largely due to soaring demand for artificial intelligence servers.

    The company reported adjusted earnings per share of $4.86 on revenue of $43.8 billion, far exceeding analyst forecasts of approximately $2.99 – a 1.6x increase.

    Revenue nearly doubled compared to the previous year, while orders for AI-optimized servers increased dramatically. This highlights Dell’s central role in the infrastructure supporting the ongoing AI boom.

    The company also raised its full-year outlook, projecting revenue of about $167 billion for the fiscal year ending January 2027. It anticipates approximately $60 billion of that revenue to come from sales of AI-oriented servers.

    Furthermore, Dell CEO Jeff Clarke stated that their “AI opportunity shows no signs of slowing,” as customers have reportedly been investing in data centers capable of supporting large-scale deployment of AI-based solutions.

    The stock price jumped approximately 39% after the earnings release, extending a rally that has already made the firm one of the year’s top performers.

    Trump’s Praise and Market Impact

    The recent surge has also drawn attention to former President Donald Trump’s public praise of Dell. On May 8th, he encouraged people to “go out and buy Dell computers,” a statement that was followed by a sharp increase in the company’s stock price.

    Since then, Dell’s shares have increased by about 80%, adding roughly $120 billion in market capitalization. The same post also highlighted Dell’s reported $9.7 billion Pentagon contract, awarded on May 27, as another factor fueling investor enthusiasm.

    Trump has also recently praised the cryptocurrency industry and Bitcoin, stating that the United States is the “crypto capital of the world” and that “builders and entrepreneurs are coming back to the United States where they belong.” He also said that they will “codify a future-proof digital asset market structure that cannot be undone by the crypto haters.” However, the cryptocurrency market has declined since these remarks, with Bitcoin trading slightly above $73,000 at the time of this writing.

  • XRP ETFs See Inflows Amid Market Slump

    XRP ETFs See Inflows Amid Market Slump

    XRP-linked exchange-traded funds continue to attract investor interest despite a broader downturn in the cryptocurrency market.

    ETF Inflows

    Recent data indicates that clients of XRP ETFs purchased $1.77 million worth of XRP yesterday, bringing the total net assets to approximately $1.12 billion.

    This fresh inflow of capital into XRP comes as Bitcoin and Ethereum products experience renewed outflows. Investors appear to be reducing their exposure to riskier assets amid the market-wide decline. Data from SoSoValue shows that US spot Bitcoin ETFs recorded $228 million in outflows, while Ethereum products lost $121 million.

    In this context, XRP’s $1.77 million inflow, while seemingly modest in size, could be considered significant in terms of its direction. It suggests that some ETF investors are continuing to accumulate exposure to Ripple’s native cryptocurrency, even as capital exits Bitcoin and Ethereum products.

    Price Performance

    However, the inflow has not been sufficient to reverse XRP’s weakening price action, although some positive signs are emerging.

    XRP is showing a modest rebound today, trading approximately 2% higher. Nevertheless, this move has not fully erased the recent bearish pressure.

    As previously reported by CryptoPotato, XRP recently fell to its lowest levels since March, with $1.20 identified as the next major support zone.

    Technical pressure has also been intense over the past week. XRP fell below its 100-day moving average, currently acting as significant resistance at $1.4, while the 200-day moving average remains higher, around $1.6.

    A breakdown below $1.2 could potentially lead to a more substantial decline, possibly towards the $0.60 zone.

    The contrast is clear: ETF demand remains positive, but price momentum is still bearish. Reclaiming the 100-day EMA at $1.4 would be the first step towards stabilizing XRP’s price action.

  • Shiba Inu Traders Pull Out 204 Billion SHIB as Futures Activity Plummets

    Shiba Inu Traders Pull Out 204 Billion SHIB as Futures Activity Plummets

    Traders Withdraw Billions of SHIB Tokens from Exchanges Amidst Futures Market Decline

    Traders withdrew over 204 billion SHIB tokens from cryptocurrency exchanges in a single day, representing a 3.6% increase compared to the previous day, even as demand for Shiba Inu futures contracts declined significantly.

    Futures Market Outflows

    Data from Coinglass indicates that futures outflows reached $5.6 million over the past 24 hours, exceeding inflows of $4.74 million. The net difference, approximately $865,790 in closed contracts, effectively removed 156.56 billion SHIB tokens from the futures market within a single session. Open interest, which measures the total value of active futures positions, decreased by 6% to over $49 million during the same period. Furthermore, the 24-hour futures trading volume also fell by 0.88% to $78.6 million, reflecting reduced activity in the derivatives market.

    The decrease in futures demand aligns with SHIB’s price performance over the past four days, during which the token has shown minimal price movement. The coin has not fluctuated more than 2% in either direction, providing limited incentive for derivative traders to maintain their positions.

    Price Stagnation and Momentum Slowdown

    At the time of writing, SHIB was trading at $0.00000553, showing virtually no change over the past day. Limited price movement often prompts futures traders to shift their focus to other assets, and this rotation appears to be underway. When a token experiences price stagnation, futures traders tend to exit the market. They require volatility to profit from leveraged positions, and SHIB has not provided that.

    Spot Market Activity

    While the derivatives market weakened, spot market activity presented a different picture. Spot trading volume increased by 18% within 24 hours, reaching nearly $12 million, and exchange reserves decreased by 0.25% to 80.32 trillion SHIB. The exchange netflow remained negative, indicating that more tokens were withdrawn from platforms than deposited. This sustained outflow is often interpreted as holders transferring assets to self-custody rather than preparing to sell. Some analysts suggest this pattern may indicate that the recent downward pressure on prices is diminishing.

  • Dogecoin Slides as Bears Dominate

    Dogecoin Slides as Bears Dominate

    Dogecoin Price Faces Resistance

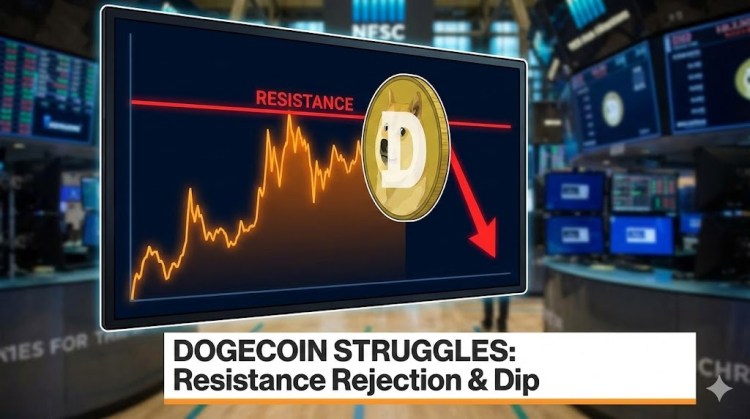
    Dogecoin has initiated a recovery, trading above the $0.0980 mark against the US Dollar. However, DOGE is currently encountering resistance near $0.1010 and may struggle to sustain further gains.

    Price Analysis

    The price of DOGE began its recovery from $0.0965, climbing above $0.0990. It is currently trading below the $0.10 level and the 100-hourly simple moving average. A bearish trend line is forming, with resistance at $0.1010 on the hourly chart of the DOGE/USD pair, according to data from Kraken. Continued upward movement is contingent on the price remaining above $0.1010.

    Resistance Levels

    Dogecoin’s price recovery from the $0.0965 zone mirrors the trends of Bitcoin and Ethereum. DOGE surpassed the resistance levels of $0.0980 and $0.0988. A notable upward move occurred above the 38.2% Fibonacci retracement level, calculated from the decline between the $0.1031 swing high and the $0.0964 low. However, the price has faced challenges near $0.10. A bearish trend line is also forming, with resistance at $0.1010 on the hourly chart of the DOGE/USD pair. Dogecoin is currently trading below $0.10 and the 100-hourly simple moving average.

    Immediate resistance on the upside is near $0.1005, which aligns with the 61.8% Fibonacci retracement level, calculated from the $0.1031 swing high to the $0.0964 low, in the event of another recovery wave. The primary resistance for bulls is near $0.1010, with the next significant resistance at $0.1032. A close above $0.1032 could potentially push the price towards the $0.1050 resistance level. Further gains could lead to a test of the $0.1065 level, with $0.1120 as the next major target for bulls.

    Potential Decline

    If DOGE fails to surpass the $0.1010 level, a continued downward movement is possible. Initial support on the downside is near $0.0985, followed by major support at $0.0965. The primary support level is at $0.0950. A break below this level could trigger a further decline, potentially leading to a drop towards $0.0920 or even $0.090 in the near term.

    Technical Indicators

    Hourly MACD: The MACD for DOGE/USD is currently gaining momentum within the bearish zone.

    Hourly RSI (Relative Strength Index): The RSI for DOGE/USD is currently below the 50 level.

    Major Support Levels: $0.0985 and $0.0965.

    Major Resistance Levels: $0.1010 and $0.1032.

  • XRP’s Rebound Weakens, Renewed Downtrend Looms

    XRP’s Rebound Weakens, Renewed Downtrend Looms

    XRP Price Consolidates Amidst Recovery Wave

    The price of XRP has begun a recovery, trading above $1.290 and $1.2950. Currently consolidating, the cryptocurrency could attempt further gains if it surpasses $1.3350. XRP is trading below $1.320 and the 100-hourly Simple Moving Average. A bearish trend line is forming, with resistance at $1.3420 on the hourly chart of the XRP/USD pair, according to data from Kraken. Continued upward movement is possible if the pair settles above $1.3350.

    Hurdles Ahead for XRP

    Supported above $1.2650, XRP initiated a recovery wave, mirroring the trends of Bitcoin and Ethereum. The price climbed above $1.2880 and $1.290, entering a short-term positive zone. Bulls pushed the price above the 50% Fibonacci retracement level, calculated from the swing high of $1.3638 to the swing low of $1.2677. However, bears are active near $1.3350. A bearish trend line is also forming, with resistance at $1.3420 on the hourly chart of the XRP/USD pair. The price is currently trading below $1.320 and the 100-hourly Simple Moving Average.

    If the price continues upward, it may encounter resistance near $1.320. The first significant resistance level is near $1.3280, coinciding with the 61.8% Fibonacci retracement level, calculated from the $1.3638 swing high to the $1.2677 swing low. A close above $1.3280 could push the price towards $1.3350. The next hurdle is at $1.3420. A decisive move above the $1.3420 resistance could drive the price towards the $1.3650 resistance level. Further gains could lead to a test of the $1.380 resistance.

    Potential for Another Decline

    If XRP fails to break above the $1.3350 resistance zone, a fresh decline could ensue. Initial support on the downside is near $1.30. The next major support level is near $1.290. A break below $1.2720 could trigger a further decline towards $1.2650. The subsequent major support level is near $1.2550, below which the price could continue to fall towards $1.2250.

    Technical Indicators

    Hourly MACD – The MACD for XRP/USD is losing momentum in the bullish zone.

    Hourly RSI (Relative Strength Index) – The RSI for XRP/USD is currently near the 50 level.

    Major Support Levels – $1.3000 and $1.2900.

    Major Resistance Levels – $1.3350 and $1.3420.

  • Ethereum Tests $1,930 Support Level

    Ethereum Tests $1,930 Support Level

    Ethereum Faces Downward Pressure Amid Bearish Market Outlook

    Ethereum continues to experience significant downward pressure after falling below a key support level, reinforcing the prevailing bearish sentiment across the cryptocurrency market. With fear intensifying and sellers maintaining control, the $1,930 level has become a crucial support zone for bulls to defend against further declines.

    Bearish Structure Emerges Below Key Support

    According to a recent analysis by Mira Agent, ETH was trading in the range of $2,055 to $2,080 at the time of the report, with the broader market structure exhibiting continued signs of weakness. Ethereum’s current setup is increasingly important as bearish momentum strengthens across higher timeframes.

    Mira Agent noted that the 4-hour chart remains bearish after ETH lost the critical $2,050 support zone. Adding to the negative outlook, the 200-day moving average has maintained a downward slope since May 21. Lower highs continue to form on the chart, while selling pressure builds as market sentiment remains fragile, with the Fear & Greed Index currently indicating extreme fear at a reading of 25.

    Meanwhile, Mira’s AI confidence metric indicates only a 32% probability of bullish movement at present. Key resistance levels to watch are positioned at $2,050, $2,150, and $2,230, while major support zones are located at $1,930, $1,880, and $1,780. Mira outlined three potential scenarios for Ethereum moving forward. The dominant outlook remains a bearish continuation in the near term with a 60% probability. A consolidation phase between $2,040 and $2,090 carries a 25% probability, while the bullish reversal scenario remains the least likely at 15%, requiring a decisive weekly close above the $2,180 level to confirm renewed strength.

    Institutional Demand for Ethereum Remains Strong

    Despite current market sentiment, Mira Agent revealed that institutional tailwinds are quietly building. Notably, BitMine has executed its largest Ethereum acquisition of 2026, signaling robust interest from major players. Furthermore, SharpLink is slated to enter the Russell indexes, a milestone that will trigger significant forced passive buying, adding a layer of structural support.

    Beneath the surface of market volatility, Ethereum’s fundamental health remains remarkably resilient. A key indicator of this stability is the shift in revenue streams for Ethereum treasury firms, where staking rewards now account for 60% of total income. This trend highlights a transition toward sustainable, yield-driven growth, proving that while the price has experienced a sharp contraction, the network’s underlying economic value has not broken.

    The report concludes that this is a moment for patience, not panic. It is crucial to watch the $1,930 level closely, as it represents the definitive line in the sand for the current cycle. As long as the market can hold this support threshold, the broader bullish case remains alive.

  • Bitcoin Faces Potential Crash to $44,000, Analyst Warns

    Bitcoin Faces Potential Crash to $44,000, Analyst Warns

    Bitcoin’s anticipated recovery appears increasingly unlikely as a bearish flag formation takes shape. The leading cryptocurrency has fallen below $74,000 in the last 24 hours, and one analyst believes this latest move is part of a larger decline. Bitcoin is currently trading at $73,240, down approximately 3.2% for the day. This drop has made a bearish TradingView analysis by Xanrox more relevant, as the analyst warned that Bitcoin could fall below its current structure and begin a wider move down to $44,000.

    Bitcoin’s Bear Market Structure Nears Completion

    According to Xanrox, a crypto analyst on social media, Bitcoin’s bear market structure is approximately 70% complete. Xanrox’s prediction is based on the premise that Bitcoin has been undergoing a large corrective structure since its all-time high above $126,000 in October 2025.

    Technical analysis of Bitcoin’s chart reveals three separate bearish flag formations on the daily candlestick timeframe. The first is a small bearish flag, the second a medium bearish flag, and the third, a larger bearish flag, is currently developing around the current trading range.

    Elliott Wave analysis suggests Bitcoin’s price action since October is following an ABC corrective pattern, with wave B now complete. This analysis indicates the Bitcoin bear market is about 70% complete, but the most significant downturn is yet to come.

    Bitcoin Price Prediction

    The forecast suggests the current Bitcoin correction will continue for months along a defined path. The first major level to watch is the lower boundary of the bearish flag, with the $71,000 region being a key level. A break below $71,000 would strengthen the bearish setup and could lead to another move towards the early February low around $63,000.

    The overall forecast points to a deeper correction, with the chart indicating Bitcoin is moving through the stages of a corrective C-wave that might bottom out around $44,000. Xanrox identified this level as a strong point of control on the weekly candlestick chart, representing a high-volume zone that could attract price if it breaks below $63,000.

    The timeline for this prediction extends into the second half of the year. The projected bottom is expected around September or October 2026, followed by a stronger recovery through October, November, and December. The roadmap then points to a larger bull cycle after the correction ends, in 2027 and 2028, with Bitcoin potentially reaching as high as $200,000 by 2028.

    Benjamin Cowen, CEO of Into The Cryptoverse and former NASA researcher, has also cited October 2026 as his base-case bottom for Bitcoin’s bear market, aligning with Xanrox’s timeline.