Tag: Negative

  • Crypto Venture Funding Dries Up Amidst Investor Exodus

    Crypto Venture Funding Dries Up Amidst Investor Exodus

    Crypto Venture Activity Contracts as Investor Participation Reaches Six-Year Low

    Venture capital activity in the cryptocurrency sector continued its contraction through 2026, with the number of participating investors plummeting from previous cycle peaks.

    CryptoRank’s latest analysis reveals a significant decline in unique investors engaging in crypto funding rounds. In the second quarter of 2026, this figure dropped to 651, a stark contrast to the record high of 2,564 investors observed in 2022.

    The only period exhibiting lower investor participation was in 2020, when the quarterly count of active investors fluctuated between 250 and 450. The analytics firm suggests this downturn indicates a venture market increasingly consolidating among a select group of specialized investors.

    Monthly data further underscores a pattern of weak and inconsistent investor engagement over the past year. In September 2025, the number of unique investors stood at 436, rising to 451 in October before falling to 316 in November.

    While the figure saw a modest recovery to 354 in December, it declined again to 273 in January and further to 224 in February. March offered a brief respite with a rebound to 389 investors, but this upward trend proved short-lived, with the number dropping to 229 in April.

    Investor participation edged up to 314 in May, only to fall to 222 in June, marking the lowest monthly level recorded during this period.

    These findings align with previous reports from Galaxy Research, which also noted a slowdown in crypto venture activity. Galaxy Research had previously reported that crypto venture firms deployed approximately $4 billion across 355 blockchain and crypto deals in the first quarter of 2026. This represented a 50% decrease in invested capital compared to the preceding quarter and a 16% reduction in the number of deals.

    Galaxy attributed this slowdown primarily to the absence of substantial late-stage financings that had bolstered activity in late 2025. However, early-stage and seed funding rounds remained relatively stable. The report also indicated that later-stage startups secured 57% of the invested capital during the quarter, with larger, more established companies continuing to attract a greater share of funding.

    Concurrently, fundraising conditions remained challenging. Venture firms grappled with macroeconomic pressures, the lingering effects of the crypto downturn, heightened investor interest in artificial intelligence, and increased competition from spot crypto exchange-traded funds and digital asset treasury companies.

  • DOGECOIN AT RISK: Price Collapse Looms

    DOGECOIN AT RISK: Price Collapse Looms

    Dogecoin Faces Headwinds as Seasonal Weakness Looms

    Dogecoin is currently trading at $0.073, marking a decline of over 3% today, with further downward pressure anticipated. The cryptocurrency is entering its historically weakest month of the year, and there are no immediate catalysts in sight to counter this trend. Seasonal data suggests a challenging period ahead for Dogecoin holders.

    A History of June Declines

    Dogecoin has experienced nine consecutive losing Junes, a streak it carries into the latter half of 2026. Current market data indicates that this weakness is rooted in a technical breakdown within a risk-averse market environment. Historical data reveals an average June return of -7.29% for DOGE, with a median loss of 9.94% over this losing streak. Applying this average loss to its current price suggests Dogecoin could approach $0.07 by the end of the month. Furthermore, Long Forecast’s model projects a 15.6% drop in July, potentially pushing the coin towards $0.066.

    Will Dogecoin’s Price Continue to Fall?

    Dogecoin is trading near $0.075, holding just above a critical support level around $0.074. Recent selling pressure has driven the price lower, accompanied by elevated trading volumes, indicating persistent distribution rather than a panic-driven sell-off.

    Momentum indicators remain weak but are not deeply oversold, with the Relative Strength Index (RSI) hovering near neutral territory. This suggests that sellers still have room to push prices lower. Technical signals continue to lean bearish, with resistance identified around $0.080 and subsequently in the $0.085 area.

    Should Dogecoin maintain support above $0.074 and market sentiment improve, a recovery towards the $0.080–$0.085 range could become feasible. A rebound in Bitcoin’s price could also contribute to such a move, particularly if buyers re-enter the market near current levels.

    The most probable near-term scenario involves consolidation between $0.074 and $0.082. Price action has repeatedly shown reactions around these levels, while momentum indicators are mixed, and conviction from either side of the market is limited.

    However, a decisive break below $0.074 could expose the next support zone near $0.070. In such a case, bearish momentum might accelerate as traders reduce risk exposure and await stronger signs of stabilization.

    Maxi Doge Emerges as an Alternative

    Dogecoin, currently trading 82% below its late-2024 peak, is experiencing a drawdown that is prompting traders to re-evaluate their exposure to meme coins. The upside potential for the original memecoin is currently limited by significant overhead resistance and a seasonal headwind that is expected to persist for at least another month. This imbalance between risk and potential return is a key consideration for rotational capital.

    Maxi Doge ($MAXI) is positioning itself as a presale-stage alternative for traders seeking meme coin exposure without the challenges of an asset deeply entrenched in a prolonged seasonal downtrend. The project has raised $4.8 million at a current price of $0.0002826. It is an ERC-20 token built around a “1000x leverage trading mentality.”

    The project’s community structure includes trading competitions exclusively for holders with leaderboard rewards, a Maxi Fund treasury for liquidity and partnerships, and dynamic staking APY. Its branding incorporates gym-culture meme humor, which has shown viral appeal within the meme coin space.

  • Bitcoin’s July Outlook Hinges on Key Factors

    Bitcoin’s July Outlook Hinges on Key Factors

    Bitcoin Faces Steep June Decline, July Recovery Hinges on Key Market Shifts

    As June draws to a close, Bitcoin appears poised for a significant monthly loss, with current data indicating an 18% drop. On-chain metrics reveal several critical factors contributing to this downturn and highlight what needs to change for a stronger performance in July.

    Stalled Accumulation and Declining Demand

    Popular analyst Ali Martinez pointed out in a recent X post that Bitcoin accumulation levels have stagnated for the past seven months. “Bitcoin apparent demand has remained negative for 208 consecutive days, recently dropping to a new low of -273,000 BTC,” Martinez stated.

    This metric, which compares new Bitcoin creation to the movement of existing supply, signifies a fall in real spot market demand. The trend shifted following a substantial liquidation event in early October, which saw over $19 billion erased in a single day. From November 9, 2025, to May 31, 2026, demand “hovered quietly in negative territory between 0 and -150,000 BTC, indicating a mild but steady distribution of supply,” Martinez noted. However, the metric plummeted to -273,000 BTC after significant price drops in early and late June and has since “flatlined around this level.”

    The prolonged negative trend suggests that a considerable amount of older Bitcoin is entering the market faster than the spot market can absorb it. This divergence indicates that selling pressure is consistently outweighing new capital inflows, a crucial factor that must reverse for Bitcoin to experience a more robust July.

    Weakening US Investor Demand

    Martinez also highlighted another metric indicating a lack of broad demand for Bitcoin, with demand primarily originating from US investors. The Coinbase Premium has been deeply negative for nearly two months, entering negative territory after Bitcoin’s peak above $82,000 in mid-May and remaining there.

    US institutional demand is a significant driver of Bitcoin’s price movements and represents the second key factor that needs to improve in July.

    Spot ETF Outflows Continue

    In line with these developments, spot Bitcoin ETFs have experienced substantial outflows for weeks. The past week saw consistent daily declines, with investors pulling nearly $700 million from these funds on Thursday, the same day Bitcoin dropped to $58,000 for the first time in almost two years.

    Lacie Zhang, a Research Analyst at Bitget Wallet, told CryptoPotato that ETF outflows need to stabilize. She added that market volatility is expected to normalize following a significant $11 billion options expiry event on June 26.

    “If redemptions resume and post-expiry positioning remains defensive, the market may stay choppy around current levels,” Zhang concluded. “The key point is that Bitcoin’s July direction may be shaped less by last week’s PCE print and more by how flows, leverage, and on-chain accumulation behave in the 72 hours after expiry settles.”

  • Ethereum Plummets: $1,000 Crash Imminent?

    Ethereum Plummets: $1,000 Crash Imminent?

    Ethereum’s Price Plummets to 14-Month Low Amidst Bear Market and Internal Shake-ups

    Ethereum, the second-largest cryptocurrency by market capitalization, has experienced a significant downturn in recent months, mirroring the struggles of most major altcoins. The digital asset’s price has fallen to a 14-month low, prompting analysts to warn of a potential further slump, with some speculating a crash to a multi-year low of around $1,000.

    Internal Challenges Compound Market Pressures

    The prolonged bear market is not the sole factor contributing to Ethereum’s declining valuation. Recent internal developments have also cast a shadow. Hsiao-Wei Wang stepped down as the Ethereum Foundation’s co-executive director and board member, and shortly thereafter, the organization reduced its workforce by 20%.

    Market Cap Fluctuation and Recovery

    These negative developments contributed to a sharp decline in ETH’s price, which nosedived to just above $1,500. Its market capitalization briefly dipped below $183 billion, allowing Tether’s USDT to momentarily surpass Ethereum as the second-largest cryptocurrency. While ETH has since reclaimed its position, the lead is now marginal.

    Key Support and Resistance Levels Identified

    According to analyst Ali Martinez, Ethereum has been trading within a critical volume block between $1,584 and $1,683, where approximately 4 million coins have changed hands. Martinez suggests that establishing this “specific area” as support could pave the way for a rise to the next major supply clusters at $1,980 and $2,079.

    Conversely, the analyst cautioned that a failure to hold this baseline support, as occurred recently, could trigger a more substantial decline to $1,237 and potentially as low as $1,089.

    Divergent Analyst Outlooks

    Other market observers have offered varying predictions. X user Ryker anticipates a drop to $1,260 before a potential rally above $3,000. This forecast was highlighted by Merlijn The Trader, who noted that Ryker is the only individual on X followed by Binance CEO Changpeng Zhao (CZ).

    Earlier this month, X user Ted posited that ETH is more likely to reach its cycle bottom before Bitcoin (BTC). At that time, Ted claimed that much of the downside liquidity had been depleted, projecting a fall to the $1,300-$1,400 range. Similarly, Niels envisioned a drop to $1,200 within the current year.

    Whale Activity Signals Bearish Sentiment

    Recent activity from large investors, often referred to as “whales,” further reinforces the bearish outlook. X user Max Crypto reported that a significant investor initiated a $68 million short position on ETH with 23x leverage. Additionally, Justin Wu observed that four “OG” wallets have begun selling off their holdings.

    Whales are closely watched by retail investors due to their potential access to insider information that could influence market movements. Their actions can sometimes trigger panic selling among smaller participants.

  • XRP Price Watch: Crash to $0.60 Looming as $1 Support Tested?

    XRP Price Watch: Crash to $0.60 Looming as $1 Support Tested?

    XRP Faces Persistent Selling Pressure, Testing Key Support Levels

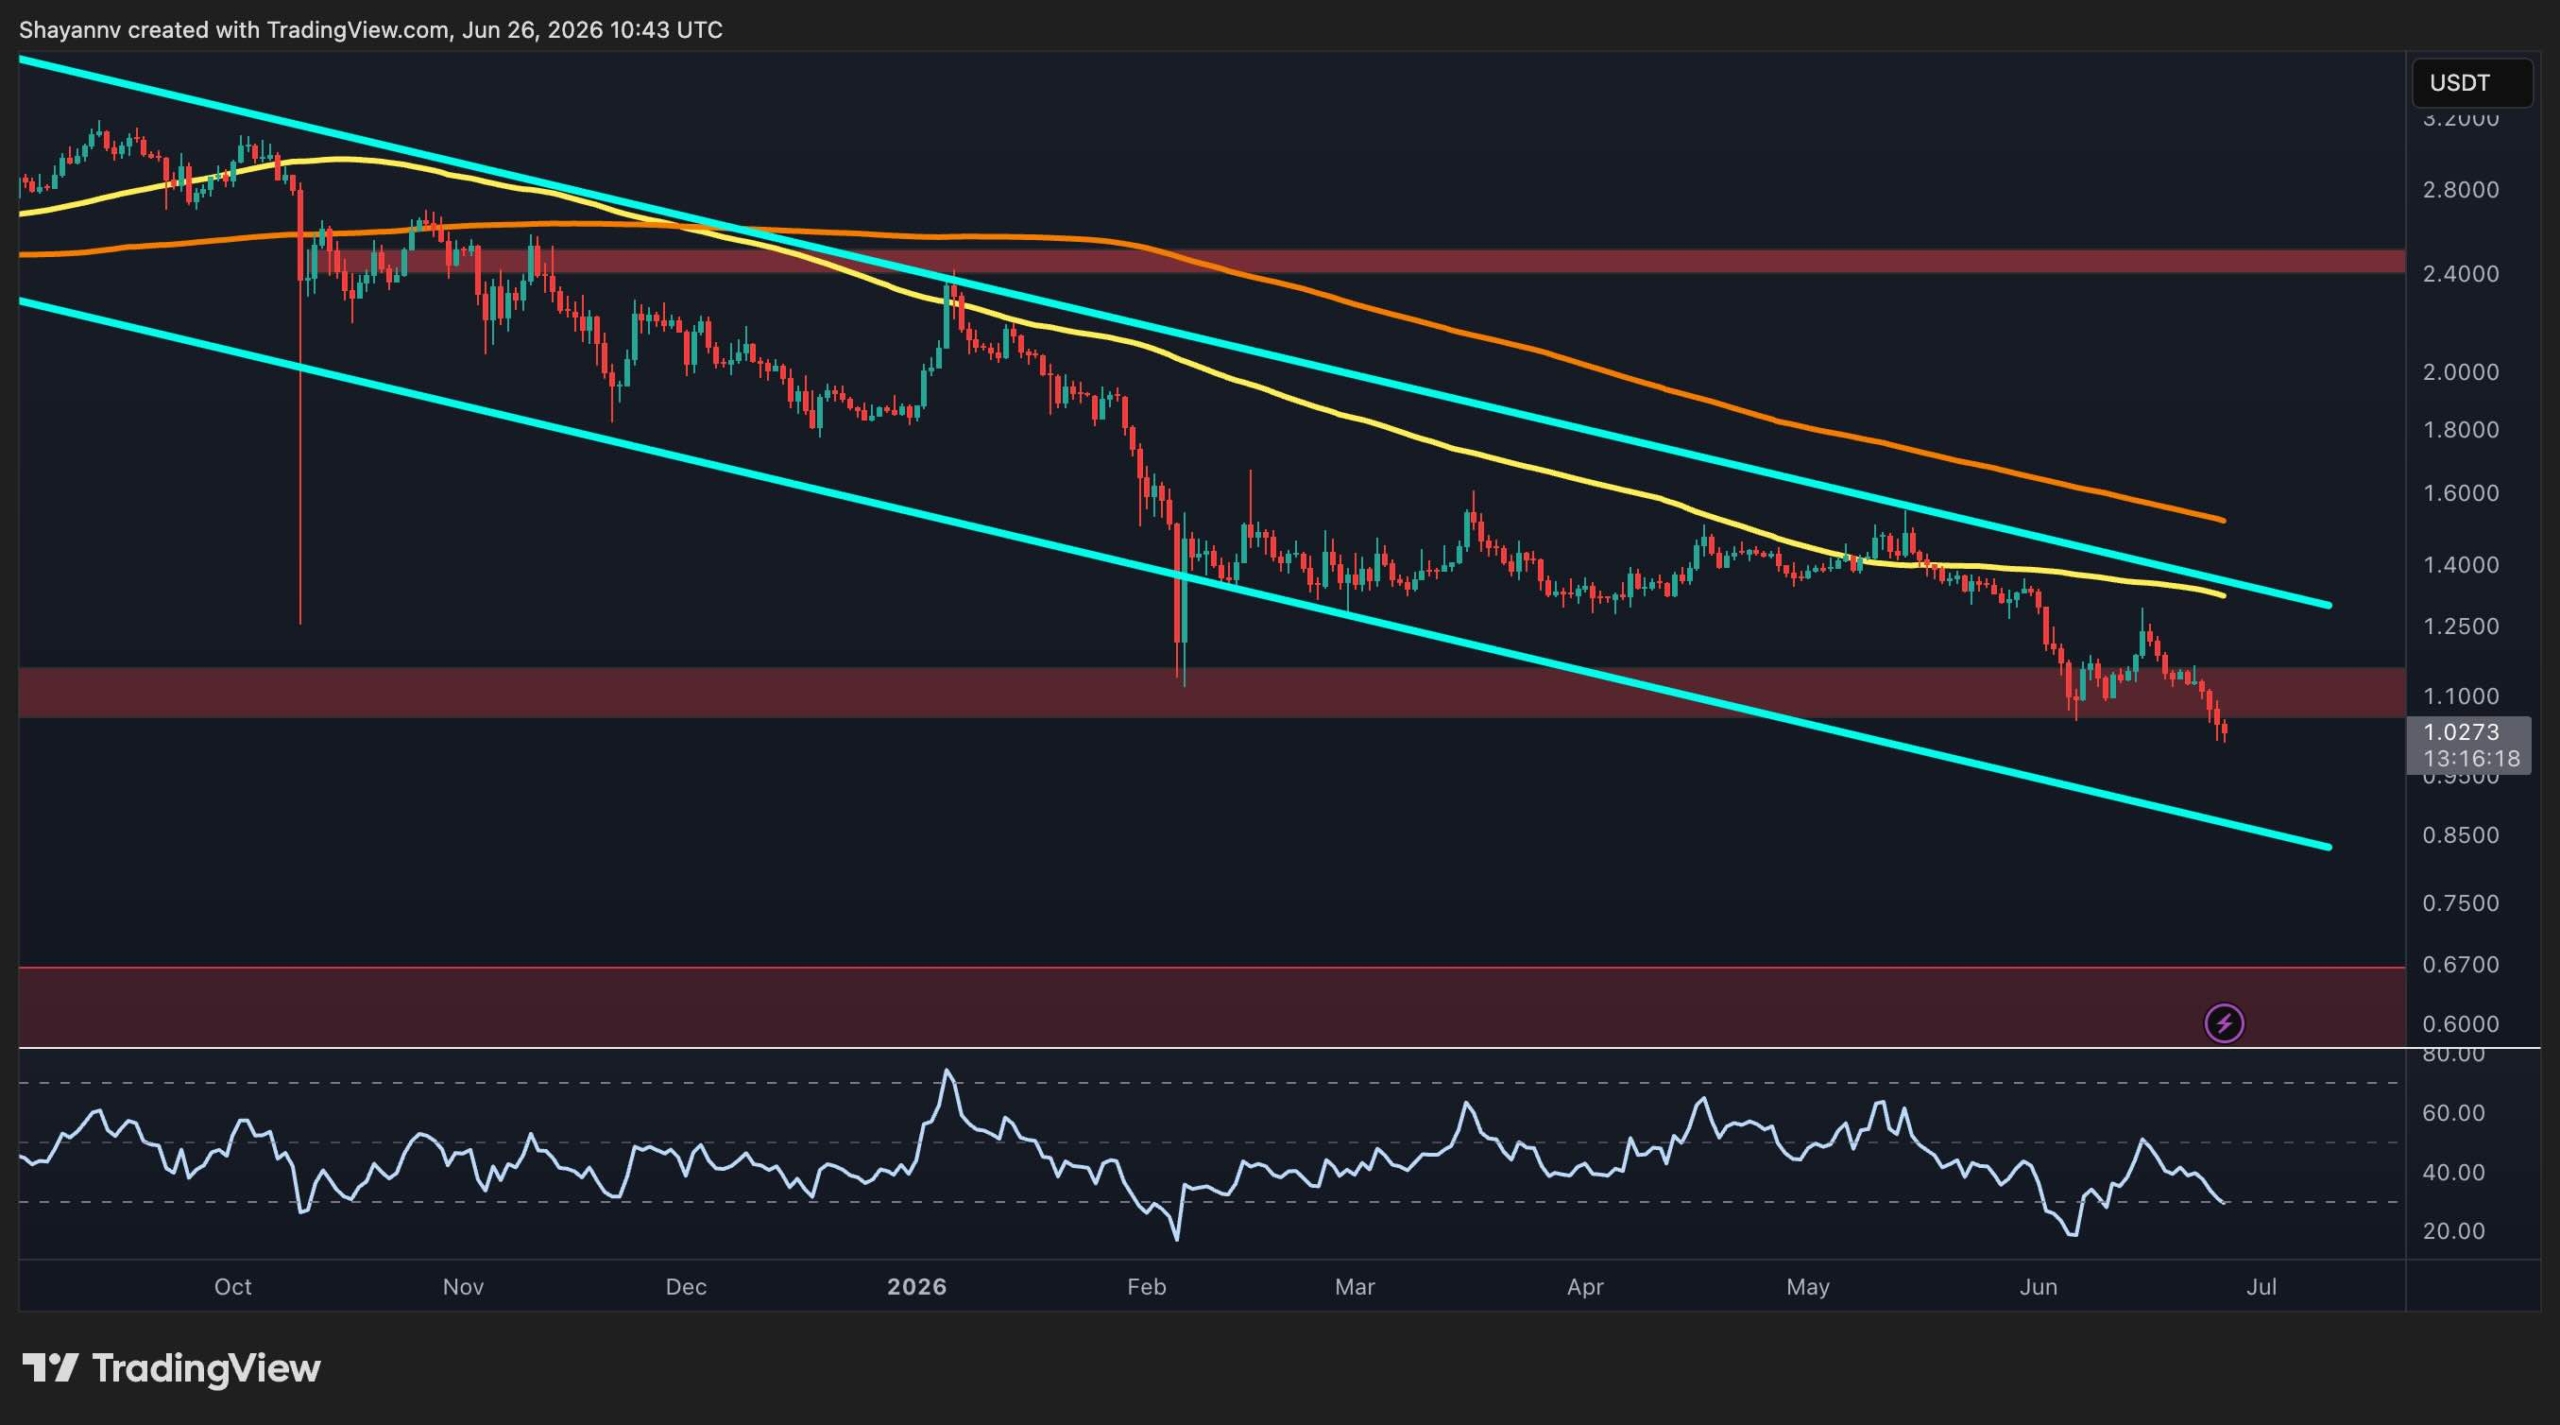
    XRP continues to experience sustained selling pressure, with the broader market trend firmly favoring sellers. Analysis of the USDT chart indicates the cryptocurrency is on the verge of breaching a significant support area following another downward movement. Concurrently, the XRP/BTC pair has retreated towards a critical floor, underscoring the token’s ongoing weakness relative to Bitcoin.

    XRP/USDT Analysis

    Against the USDT pair, XRP has extended its long-term downtrend, adhering to a descending channel that has capped price action for several months. The asset is currently trading around $1.04, having narrowly avoided a break below the crucial $1.10 support zone, which has now transitioned into immediate resistance.

    XRP remains positioned below both its 100-day and 200-day moving averages, with the 100-day average situated near $1.25 and the 200-day average around $1.5. Both averages are exhibiting a downward slope, reinforcing the prevailing bearish market structure. The upper boundary of the descending channel is converging with these moving averages, forming a robust resistance cluster that buyers would need to overcome for any significant trend reversal to be considered.

    On the downside, the current support zone around $1.00 is under intense scrutiny. A confirmed breach below this level could open the path to the next major demand region, located approximately at $0.60. Momentum indicators also show continued deterioration, with the Relative Strength Index (RSI) trending towards oversold territory, suggesting that bearish pressure remains dominant, although short-term relief bounces cannot be entirely discounted.

    As long as XRP remains below the descending channel resistance and the key moving averages, the broader market structure will continue to favor sellers, irrespective of any recent stabilization.

    XRP/BTC Analysis

    Against Bitcoin, XRP is also trading within a clearly defined descending channel, reflecting persistent relative weakness over the past several months. The pair is currently trading around 1,720 satoshis, resting directly on a horizontal support level that has historically attracted buyers since May.

    However, the broader technical outlook remains bearish. The price is trading below both the 100-day and 200-day moving averages, which are positioned around 1,850 satoshis and 2,000 satoshis, respectively, with both averages continuing their downward trajectory. Consequently, any recovery attempt is likely to encounter substantial resistance in the 1,850 to 2,000 satoshi range, followed by the upper boundary of the descending channel.

    Should the current support at approximately 1,700 satoshis fail to hold, sellers could target the lower boundary of the channel, near the 1,500 satoshi area. Conversely, defending this level might facilitate another short-term rebound towards the channel resistance. Nevertheless, the overall structure would remain bearish unless XRP manages to reclaim the major moving averages and establish higher highs.

  • XRP Faces Steep Selling Pressure as Profit-to-Loss Ratio Hits Multi-Year Low

    XRP Faces Steep Selling Pressure as Profit-to-Loss Ratio Hits Multi-Year Low

    XRP Selling Pressure Intensifies as Profit-to-Loss Ratio Reaches Multi-Year Low

    On-chain analytics firm Glassnode reported that XRP holders are continuing to realize more losses than profits, with a key indicator reaching its lowest point since August 2022. This decline suggests increasing selling pressure as more holders divest their assets at a loss.

    According to the firm’s update on June 25, the 90-day simple moving average of XRP’s Realized Profit-to-Loss Ratio has fallen to 0.33, down from 0.38 on June 9. This metric, which compares realized profits against realized losses from on-chain transactions, serves as a gauge of overall market profitability.

    A ratio above 1 signifies that realized profits are greater than realized losses, while a value below 1 indicates that losses are more prevalent. The current reading implies that for every dollar of realized losses, only 33 cents in profit is being realized.

    Glassnode noted that this ratio peaked at approximately 50 during XRP’s market surge in 2025, a period characterized by profit-taking significantly outweighing sales at a loss. The subsequent sharp decline signals a substantial shift in market dynamics, with an increasing number of holders exiting their positions at a deficit.

    Based on these observations, the analytics firm indicated that the market is exhibiting signs of intense capitulation among participants moving XRP on-chain. The sustained weakness in the ratio, Glassnode added, suggests that capitulation pressure has become more pronounced in recent weeks.

    Separate data released by Glassnode on June 9 also highlighted a significant reduction in activity on the XRP Ledger. The 90-day average of total transaction fees has dropped from 5,900 XRP in February 2025 to approximately 500 XRP, marking a decrease of roughly 91.5%.

    Collectively, Glassnode’s data suggests that a weakening of network activity has coincided with the deterioration in holder profitability. The realized profit-to-loss ratio experienced a sharp increase during the 2025 rally before steadily declining through late 2025 and into 2026. Total transaction fees followed a similar downward trend after the speculative peak.

    The subdued on-chain metrics have led to varied interpretations among market participants. Some users on X have suggested that such low readings could signal seller exhaustion. Others have pointed to XRP’s ability to remain above the $1 mark despite the weak profitability data.

  • BitGo Cuts 15% of Staff Amid Crypto AI Layoffs

    BitGo Cuts 15% of Staff Amid Crypto AI Layoffs

    BitGo Cuts Workforce Amid Pivot to AI

    BitGo, a prominent crypto custody and infrastructure company, has announced significant workforce reductions, joining a growing trend among technology firms to streamline operations and pivot towards artificial intelligence. The company is cutting nearly 15% of its staff, according to a statement from co-founder and CEO Mike Belshe.

    In a tweet shared on Thursday, Belshe explained the decision, stating, “The ecosystem has evolved, and the way we build financial services has changed dramatically.” He elaborated that to maintain a competitive edge for its clients, BitGo must become “sharper” and more focused. The company’s strategic direction will now emphasize “security, trading, stablecoins, settlement, and AI-powered infrastructure.”

    While BitGo did not disclose the exact number of employees affected, its 2025 annual report indicated a workforce of 603 full-time employees, suggesting approximately 90 roles may have been eliminated. Belshe characterized the layoffs as a “one-time action” and expressed confidence that further cuts are not anticipated, noting that the company’s job board still features numerous open positions.

    These reductions come several months after BitGo’s initial public offering in January, where it priced its shares at $18, raising approximately $213 million and valuing the firm at over $2 billion. Despite a substantial 112.6% surge in first-quarter revenue compared to the previous year, reaching $3.8 billion, the company also experienced an widening of net losses.

    The market reaction to the news was largely negative. BitGo shares, trading under the ticker BTGO, saw a nearly 5% decline on Thursday, closing at $4.80. This represents a significant drop of approximately 73% from its IPO price.

    BitGo’s move aligns with a broader pattern of staff reductions across the cryptocurrency and technology sectors in 2026. Earlier this year, Jack Dorsey’s Block eliminated around 4,000 jobs, roughly 40% of its workforce, citing increased reliance on automation and AI tools. In May, Coinbase reduced its staff by 14%, while crypto data firm Dune let go of a quarter of its employees. Robinhood also trimmed its workforce by 10% in June amid a downturn in crypto revenue.

    The wider tech industry has seen over 120,000 job cuts since the beginning of the year, with major companies like Microsoft and PayPal identifying AI as a key factor driving these downsizing efforts. However, the extent to which AI is the sole or primary driver of these layoffs remains a subject of ongoing debate, with some analysts suggesting it may serve as a convenient justification amidst a challenging market environment.

  • XRP’s Key Levels Post-$1.00 Crash

    XRP’s Key Levels Post-$1.00 Crash

    Key Support Levels for XRP Under Scrutiny After Multi-Year Low

    Popular analyst Ali Martinez has identified the next critical support levels for Ripple’s cross-border token, XRP, following its descent to a new multi-year low of just over $1.00 yesterday. Market observers are closely watching this level, which could prove pivotal in determining XRP’s trajectory for the current cycle.

    The cryptocurrency market, including Ripple’s native asset, has experienced a significant downturn recently. XRP reached $1.60 in mid-May before falling to $1.05 in early June. A subsequent rebound to $1.30 was short-lived, as the token faced renewed selling pressure, driving it to $1.01 on most exchanges yesterday.

    Martinez commented on XRP’s recent performance, noting a bounce to its current trading price of $1.04. He highlighted that the token is currently testing a “major volume block at $1.06,” a significant price area where over 830 million XRP were traded. This level was considered the most crucial above $1.00, but it has since been breached as of press time.

    According to Martinez, attention now shifts to the next major volume clusters, which are positioned considerably lower. The first significant area, with 923 million XRP transacted, is located at $0.80. Two larger clusters, with 1.16 billion and 1.06 billion XRP traded respectively, are identified at $0.62 and $0.51.

    This juncture is considered highly significant for XRP, a sentiment echoed by CasiTrades. As previously reported, she indicated that XRP has approached its final capitulation level, with calls for further price declines intensifying. However, she believes the current retracement is “doing exactly what it should,” describing it as “perfect market structure.”

    The market crash on Thursday resulted in the liquidation of over 200,000 traders, with total liquidations exceeding $1.5 billion. Among those heavily impacted was a prominent Bitcoin and XRP whale. Data from Lookonchain reveals that a single wallet, ending in 0xf79C, saw nearly $48 million in Bitcoin and $28.5 million in XRP long positions liquidated.

    The market crash liquidated whale 0xf79C’s longs. His 809.9 $BTC ($47.68M) and 27.92M $XRP ($28.45M) long positions were fully liquidated, resulting in an $8.42M loss.

  • Polymarket Refunds Users After $3M Hack

    Polymarket Refunds Users After $3M Hack

    Polymarket Confirms $3 Million Stolen in Frontend Attack, Promises Full Refunds

    Polymarket confirmed Friday that a compromised third-party vendor allowed attackers to inject malicious code into its frontend, resulting in the theft of approximately $3 million from fewer than 15 user accounts. The platform has pledged to fully reimburse all affected users.

    Security Researcher Flags Breach

    The attack was initially identified by on-chain security researcher Specter, who reported that an apparent phishing campaign had drained funds from over 11 victim wallets holding Polymarket’s PUSD stablecoin. At the time of Specter’s report, estimated losses stood at $2.94 million. PeckShield later corroborated this figure, noting that the attacker had bridged the stolen funds from Polygon to Ethereum and converted them into 1,893 ETH.

    Polymarket Acknowledges Incident

    The prediction market platform acknowledged the breach through one of its official communication channels, Polymarket Traders. “This morning we discovered a 3rd party vendor had been compromised, injecting a malicious script into our frontend for some users. We’ve contained it and removed the affected dependency,” the statement read on X. “We’re contacting impacted users and refunding them in full.”

    William LeGate, who works closely with Polymarket, reiterated the commitment to compensation, confirming that the issue had been resolved and that affected users would receive their full funds back.

    Supply Chain Attack Identified

    Other blockchain security firms, such as GoPlus Security, characterized the incident as a supply chain attack. They reported that the malicious code impacted approximately 15 accounts, with total losses amounting to $3 million. Bubblemaps reached a similar conclusion and commended Polymarket’s swift response in containing the losses.

    Previous Security Incidents

    This is not the first security breach to affect Polymarket. Last month, the platform disclosed an incident where an admin wallet used for employee rewards was drained of about $700,000, likely due to a private key compromise. Initially, crypto investigator ZachXBT estimated the losses at around $520,000, with Bubblemaps later revising the figure upwards after tracing the funds.

    Developer Josh Stevens confirmed at the time that a six-year-old private key had been exposed through an internal configuration error. The company subsequently rotated credentials and transitioned to key management services. Importantly, that prior incident did not affect user funds or core contracts.

    Broader Reputational Challenges

    While the two incidents involved distinct attack vectors, both targeted systems external to Polymarket’s core prediction markets. The latest breach occurs as the platform faces other reputational challenges. A recent report by The Wall Street Journal alleged that Polymarket paid college-age creators between $2,000 and $3,000 per month to post videos of staged bets on dummy versions of its website, with none of the over 1,100 clips demonstrably linked to real blockchain activity.

    Adding to recent controversies, an early-this-month claim by a trader alleged a $500,000 loss after the prediction service purportedly altered resolution rules for a market tied to Strategy’s Bitcoin sale.

  • Crypto Markets Brace for $11B Options Expiry

    Crypto Markets Brace for $11B Options Expiry

    Massive $11 Billion End-of-Quarter Options Expiry Could Rattle Crypto Markets

    Approximately 153,500 Bitcoin options contracts, with a notional value of around $9.3 billion, are set to expire on Friday, June 26. This expiration is significantly larger than usual, coinciding with the end of the month and quarter, and could inject further volatility into already struggling spot markets.

    This week has seen cryptocurrency markets plunge to nearly two-year lows, with the total market capitalization shedding over $180 billion since Monday as the bear market intensifies.

    The current batch of Bitcoin options contracts exhibits a put/call ratio of 0.73, indicating a slight dominance of sellers of long (call) contracts over sellers of short (put) contracts. The “max pain” level, a theoretical price at which most options would expire worthless, is estimated at $72,000. This is approximately $13,000 above current spot prices, suggesting that the majority of these contracts are likely to expire out-of-the-money.

    Open interest (OI), representing the total value or number of outstanding Bitcoin options contracts, remains highest at the $80,000 strike price on Deribit, totaling $1.4 billion. However, short sellers still hold $1 billion in OI at the $60,000 strike price. According to Coinglass, total BTC options OI across all exchanges has been on an upward trend over the past week, reaching $34 billion.

    Deribit observed that Bitcoin is heading into this expiration well below its $72,000 max pain level. The exchange also noted that while max pain is a closely watched metric, recent quarterly expirations have shown limited evidence of a consistent “pinning” effect on prices leading up to settlement.

    Derivatives provider Greeks Live reported this week that puts continue to command a significant premium over calls across all major tenors. This suggests persistent demand for near-term downside protection, while pricing for longer-dated options remains relatively stable.

    Q2 Options Expiry Alert

    At 08:00 UTC on Friday, approximately $10.8 billion in Bitcoin and Ethereum options are scheduled to expire on Deribit. This marks the largest expiry event on Deribit so far in 2026.

    In addition to the substantial Bitcoin options expiry, roughly 1 million Ethereum contracts are also set to expire, with a notional value of $1.6 billion. For Ethereum, the max pain level is $2,000, and the put/call ratio stands at 0.54. Total ETH options OI across all exchanges is currently low, at around $5.7 billion.

    Cumulatively, the total notional value of crypto options expiring this week reaches approximately $11 billion, positioning it as one of the largest expiry events of the year.

    Spot markets have experienced a further 3% decline today, reaching their lowest levels since September 2024. Bitcoin lost 4% during the Friday morning Asian session, dropping to just over $58,000. It saw a slight rebound towards $60,000 as of press time, following this fresh low for the current market cycle. Analysts had warned this week of an imminent significant sell-off in this price zone.

    Ethereum briefly lost its market capitalization rank to Tether, falling more than 5% to $1,522 on Friday morning. This marks its lowest point since a dip in April 2025 and returns it to levels seen during the 2023 bear market. Meanwhile, altcoins are broadly in the red, continuing a significant downturn.